
The past three years have been a remarkable period for household travel across America. Pandemic-era health restrictions, office closures, and surging e-commerce all contributed to striking changes in how, when, and where people traveled outside their homes. Decades-long patterns such as rush hour and holiday travel suddenly looked different. As a recent Department of Transportation report marveled, it was “one of the most dramatic changes in travel behavior since World War II.”
Now that the pandemic is largely over, the question is: Which changes in household travel behavior were fleeting, and which were more durable? After spending roughly a century building metropolitan areas to prioritize commuting between concentrated job hubs and lower-density residential neighborhoods—much of it oriented around the automobile—permanent shifts in travel demand could have far-reaching implications for how governments invest in new capacity, make use of current roads, and generally think about spatial development.
Using metropolitan-level travel data from fall 2019 and fall 2022,1 this report goes beyond traditional aggregate metrics to track trip purposes and what times those trips occur. This data exposes two structural changes taking shape in real time. On one hand, people have generally substituted longer commutes for shorter but more frequent trips to eat, shop, and run errands—and that pattern holds in all 109 metro areas studied.2 Yet even with consistent drops in commuting, total miles traveled are trending in wildly different ways when comparing metro areas to one another. Just as importantly, there is no single variable—such as population change, economic growth, or even the presence of telework-heavy industries—that consistently explains the differences among metro areas.
Taken together, these findings suggest each U.S. metro area now faces a unique inflection point when it comes to designing a regional transportation network responsive to contemporary economic demands. Clearly, the days of expanding roads to funnel workers in and out of job hubs should be over. Instead, with non-work trips increasing, policymakers and planners have an opportunity to use more local-serving transportation networks—including bike lanes and other safe street designs—to build proximity between where people live and where they want to go.
Commutes are down, but people are finding other reasons to leave the house
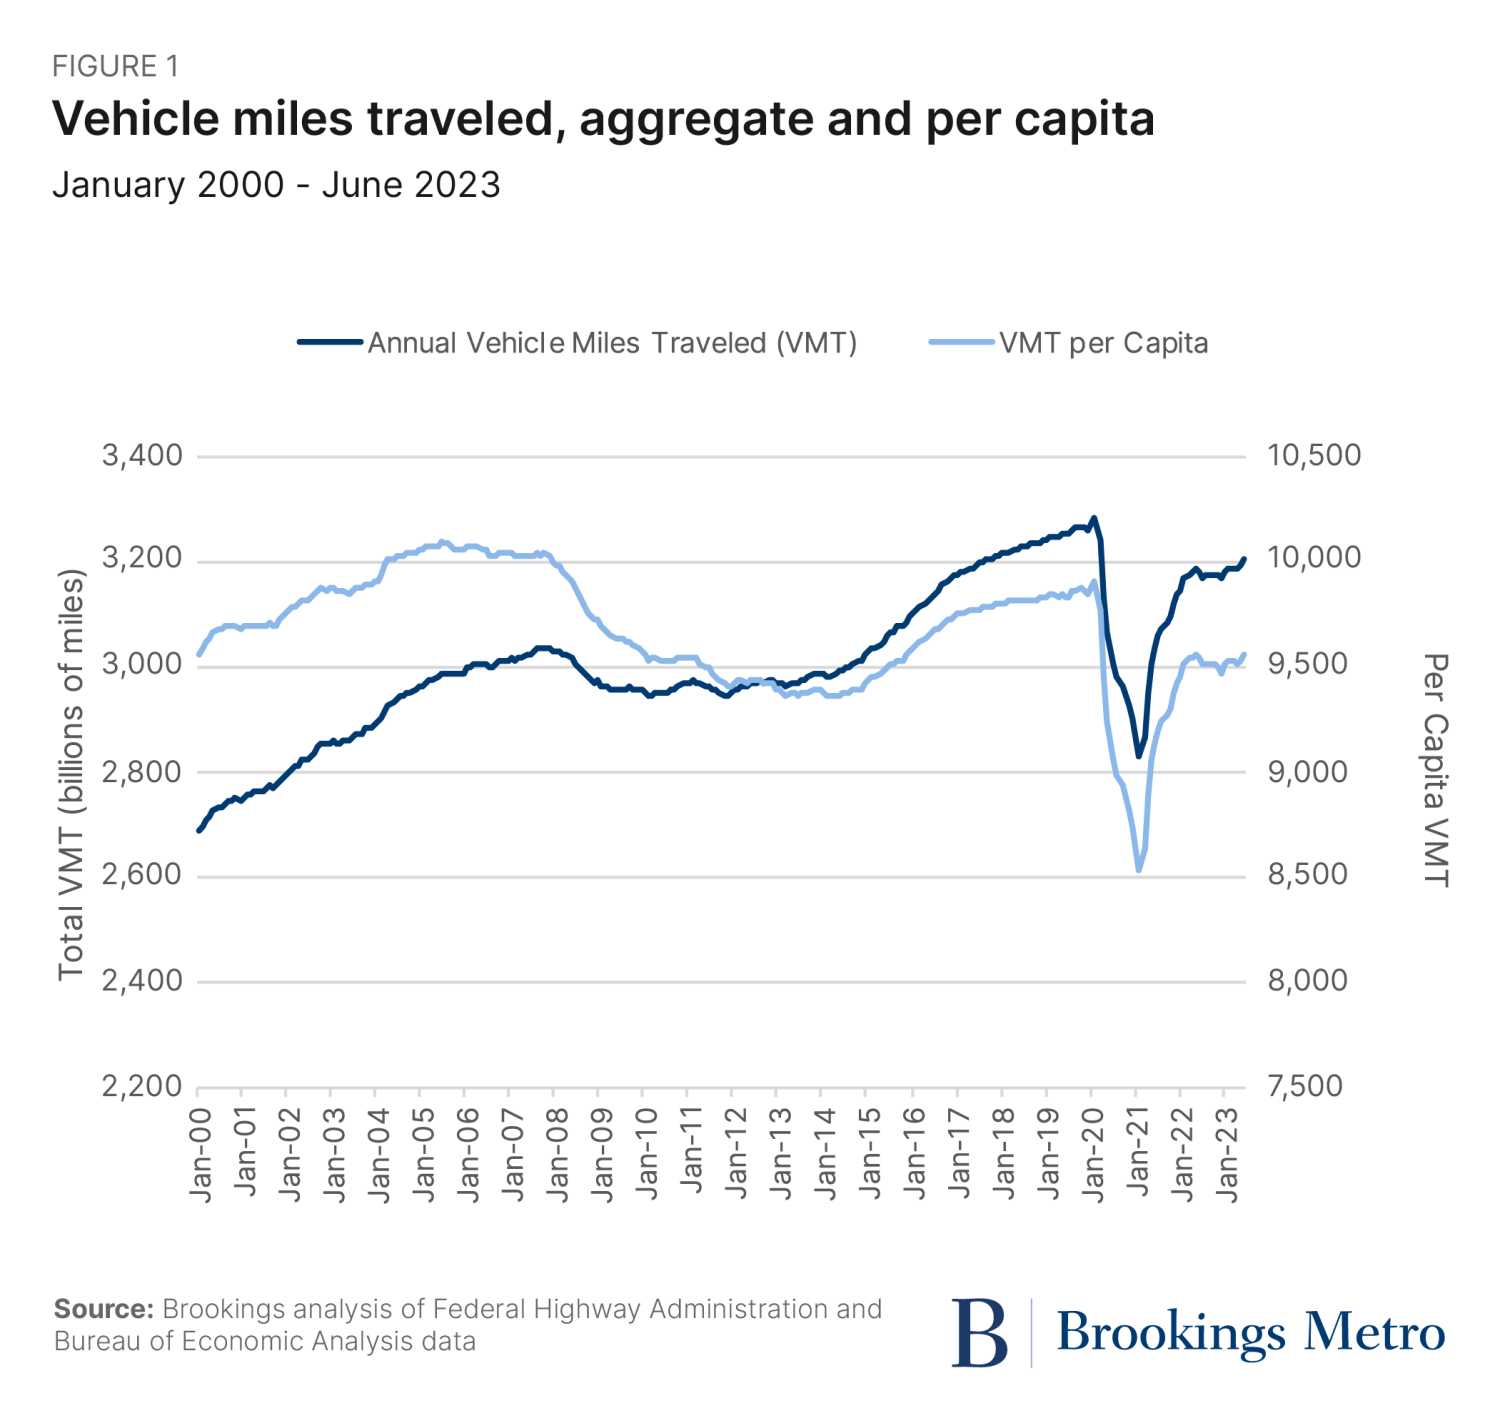
Whether measuring overall metropolitan travel patterns on a per-person or per-household basis, we find negligible changes in total mileage traveled when comparing fall 2019 to fall 2022. In both periods, the average American metropolitan household traveled approximately 90 miles on weekdays and nearly 85 miles on weekends. Average annual household travel mileage totaled around 30,000 miles for both periods. This reflects the general pattern seen in national travel data; for example, national vehicle miles traveled in fall 2022 had nearly reached fall 2019 levels (Figure 1).
However, we know structural changes to everyday life must continue to impact daily travel. Work-from-home rates have skyrocketed, with particularly high rates among employees in industries such as information services, professional business services, and educational services. It’s little surprise, then, that trips to work dropped from 16% of all trips in fall 2019 to only 12% in fall 2022. The mileage associated with work trips dropped as well: On average, households traveled 25% fewer miles for work on weekdays in fall 2022 than they did in fall 2019.
While work trips typically account for less than one-fifth of American travel, they play an outsized role in the other trips households take throughout the day. Many American households utilize “trip chaining”—stringing together multiple trips of different purposes and destinations in a single excursion from home or work—to structure travel throughout the day. Work trips often anchor household trip chains; other errands are fit in around this essential and time-specific travel. With the drop in work trips noted above, some households were able to rearrange their trip chains around other routines.
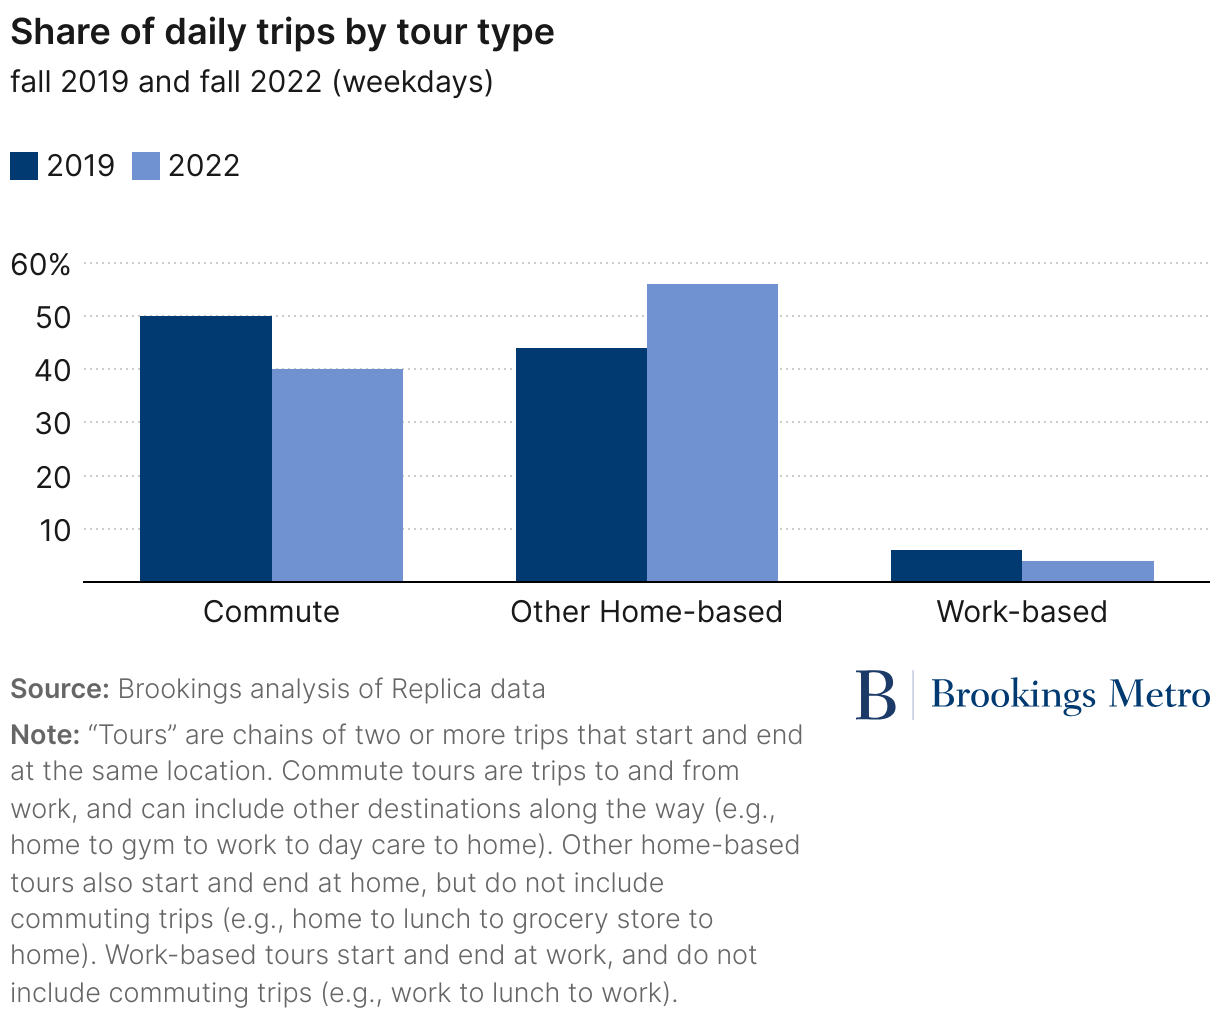
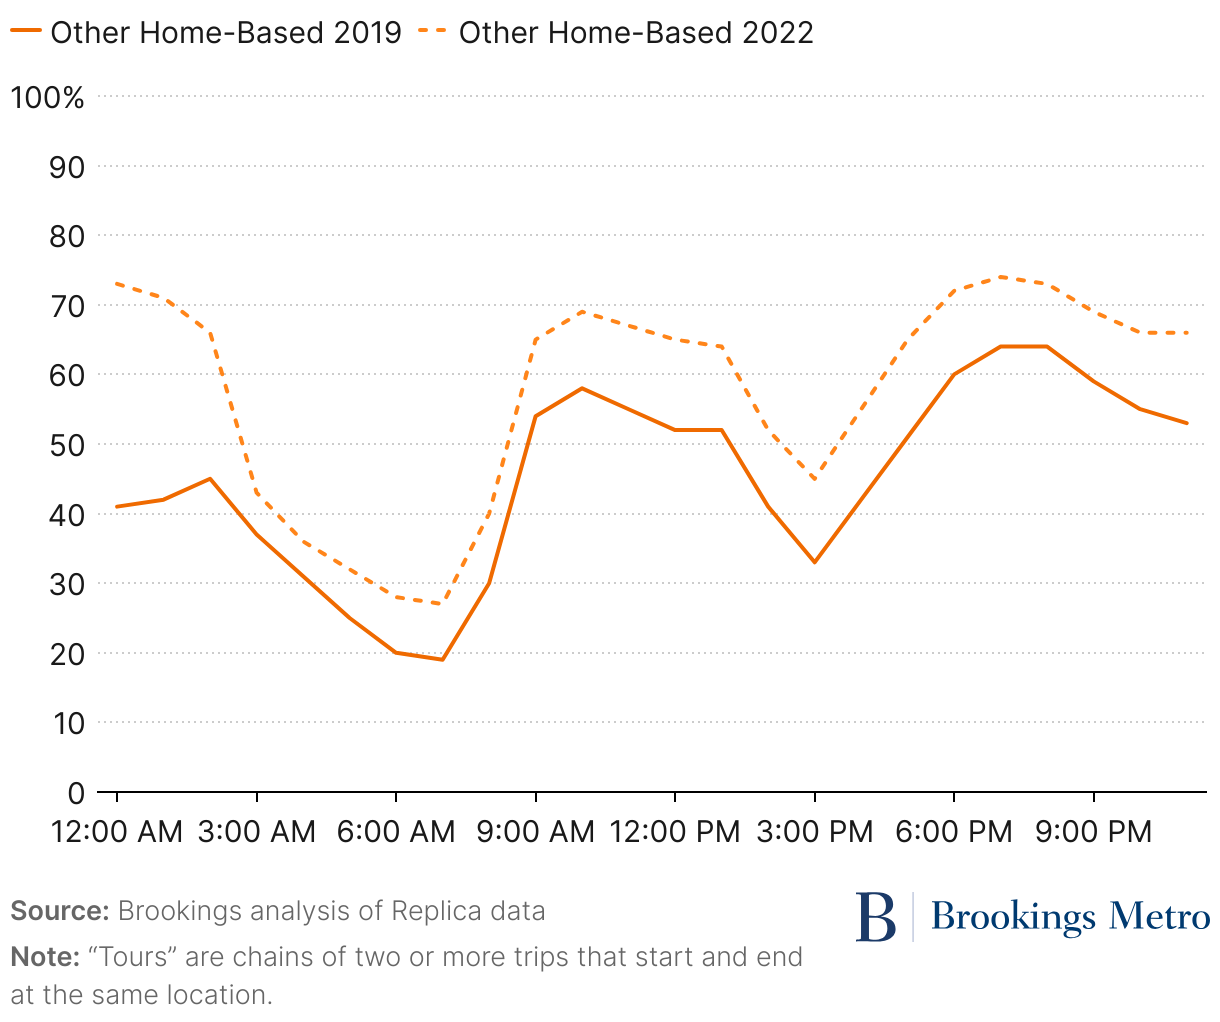
Figure 2 uses average weekday data to analyze the three main “tours” (chains of two or more trips) households take on a daily basis: trips taken during commutes, trips taken while at work, and tours that start and end at home. In 2019, 50% of all household trips were completed on the way to or from work; by 2022, that share fell to 40%. Instead, households shifted a greater share of trips to home-based tours.
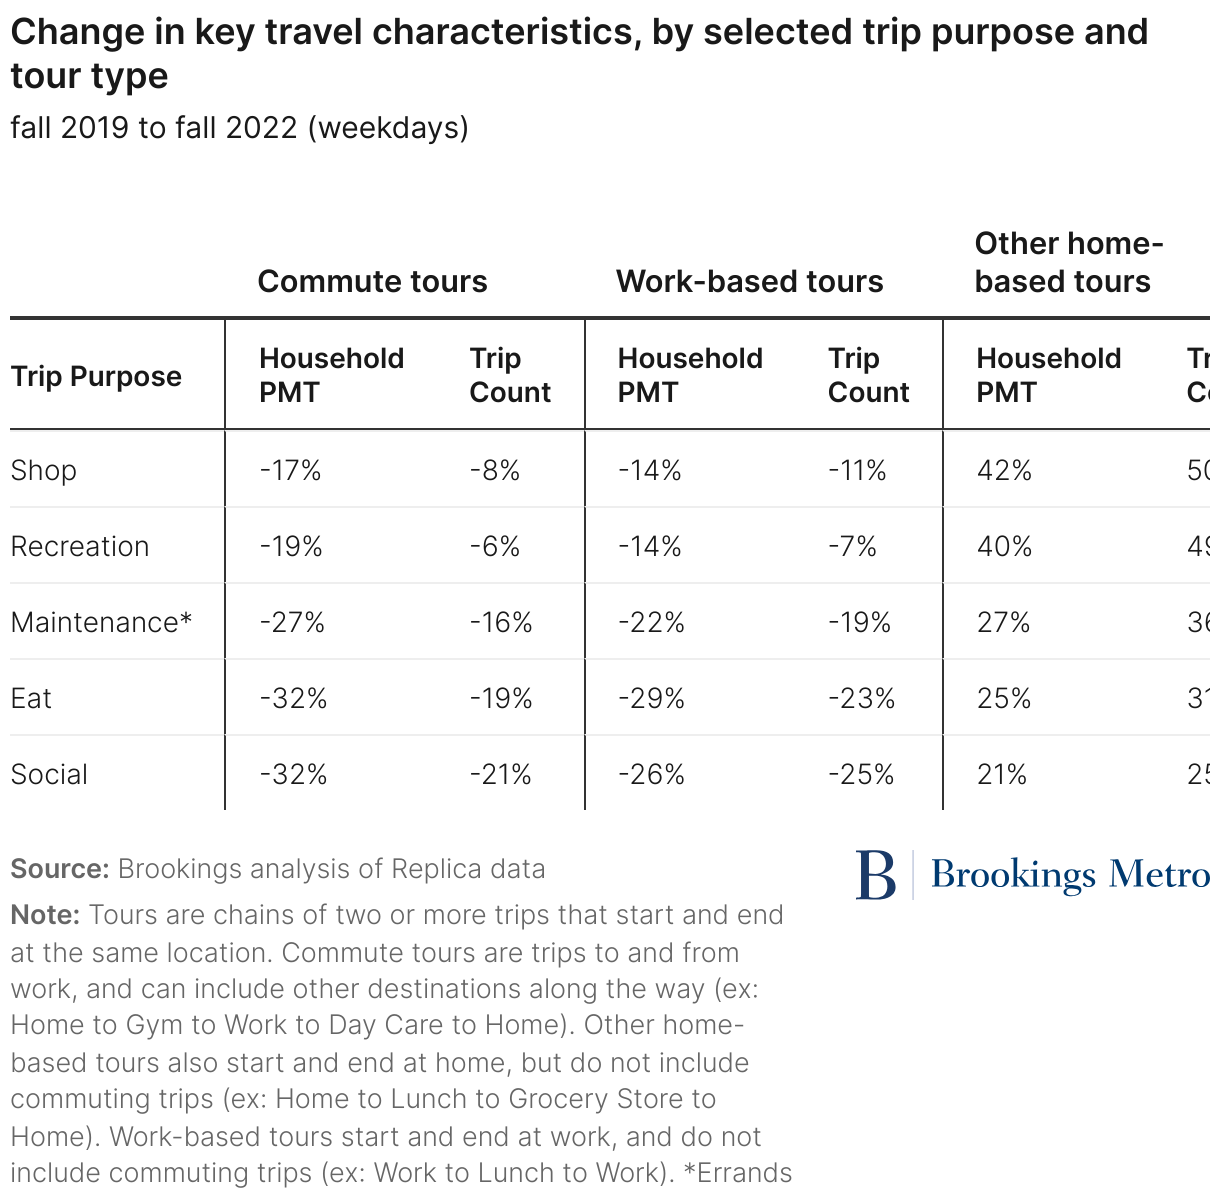
Work-based eating trips—like heading to the fast-casual salad shop near the office—decreased 23% between 2019 and 2022; eating trips between home and work also decreased (19%). Instead, eating trips increasingly occurred during non-work trip chains: 2022 saw 31% more eating trips as part of home-based tours. Similar transitions happened for other trip purposes, including recreation, shopping, social, and maintenance (errands).
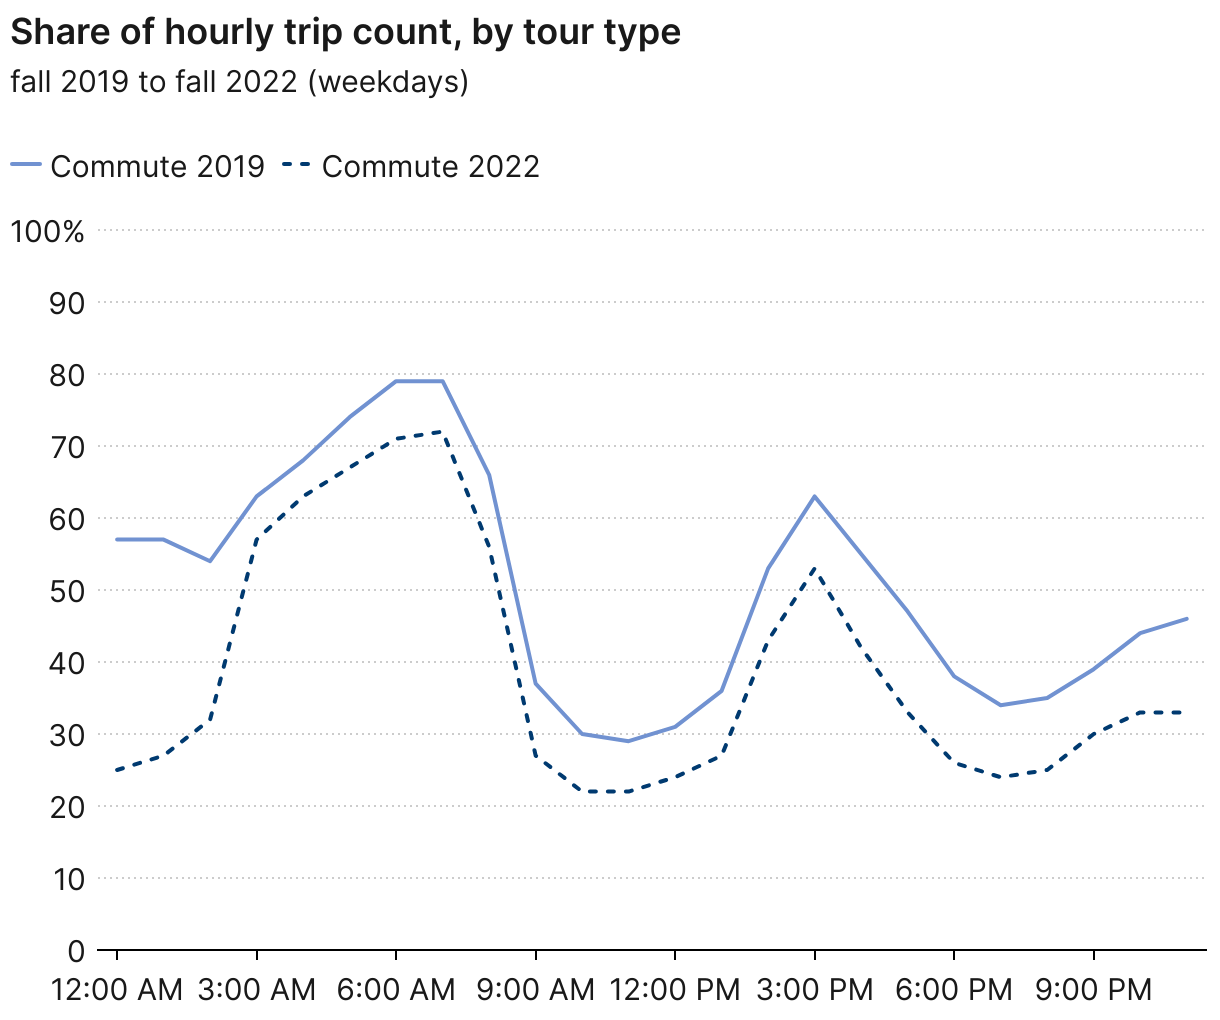
The reduction in total commuting has knock-on effects for the timing and location of daily travel. Fewer commuters traveling to and from work means less demand for road space and transit during conventional rush hours. Instead, people are more likely to leave their homes starting around lunchtime to eat, exercise, or run errands (confirming what other studies are finding).
Just as importantly, the general pattern of “commute less, errand more” holds in all of the country’s 109 largest metro areas. This isn’t surprising—every metro area has a sizable advanced services economy (business and professional services, finance and insurance, etc.), meaning there is a significant tranche of workers who could have suddenly switched to working from home over the past three years. And because everyone still needs to eat or run other errands, those non-commuters can no longer trip chain on their way to or from the office. The net result is a geographically consistent effect, at least when it comes to commuting.
Total miles traveled are shifting in wildly different ways across the country
The rapid rise in telecommuting, lower roadway congestion, and emptier transit vehicles all could suggest that Americans aren’t traveling as much as they used to. But when diving into individual metro areas, that story fractures. In fact, in most of the 109 metro areas we studied, personal miles traveled (PMT) increased between 2019 and 2022.
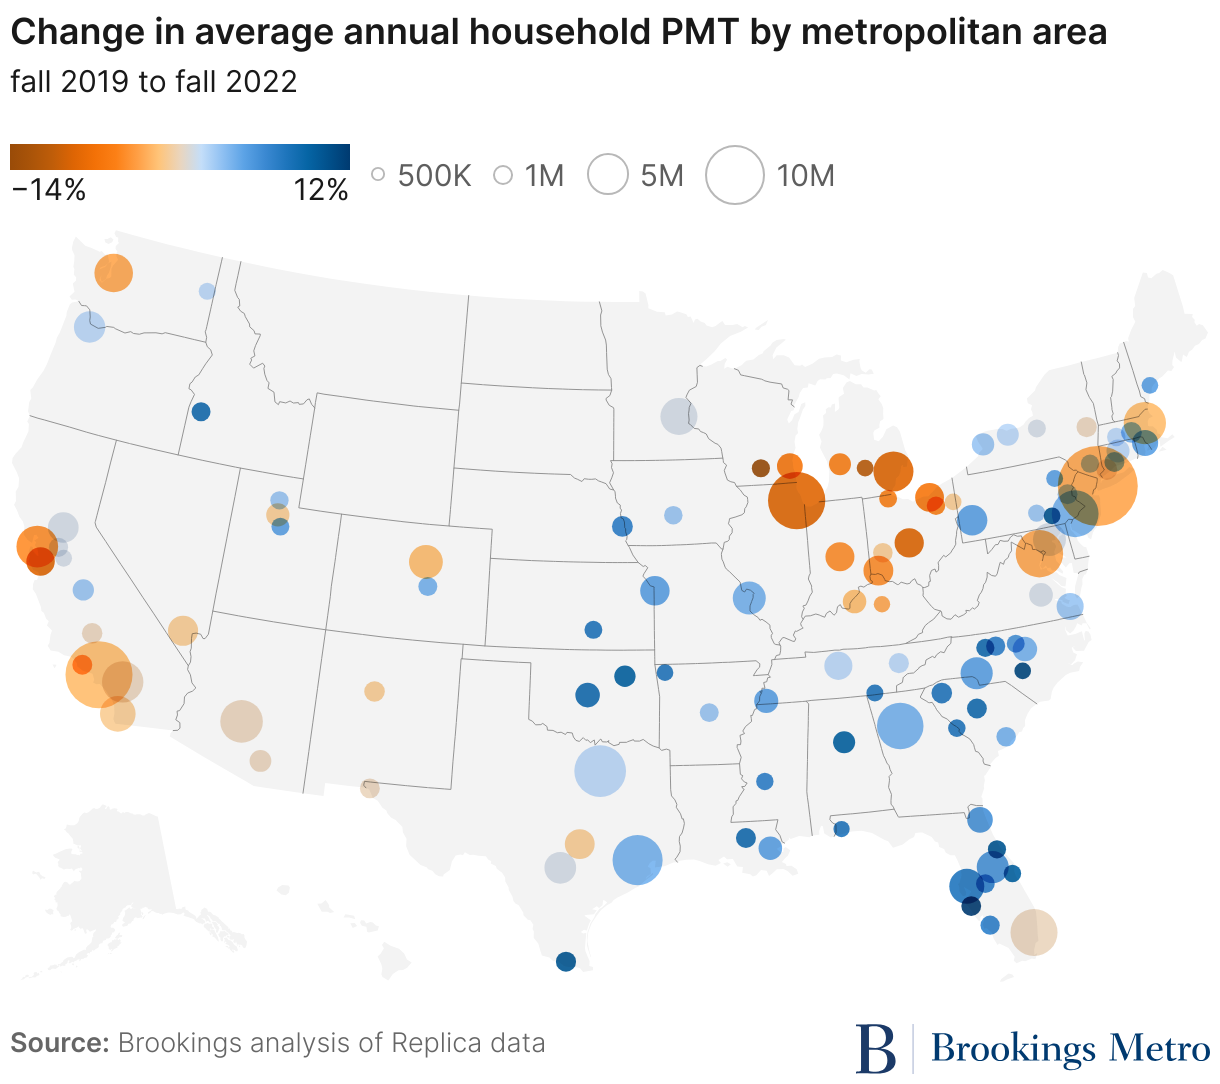
Many of these increases are relatively minor: 30 metro areas saw their household PMT rise, but by less than 3%. But there are also metro areas where household PMT rose over 10%, including North Port-Sarasota-Bradenton, Fla. and Fayetteville, N.C. As Figure 3 shows, metro areas with the largest PMT increases are clustered from the southern Great Plains to the southern Atlantic coast. And overwhelmingly, the largest PMT increases occurred in some of the smaller metro areas we studied; although large metro areas such as Tampa, Fla. (6.8%), Houston (2.7%), and Philadelphia (2.5%) all saw their household PMT rise as well.
Still, many metro areas did see sustained drops in total travel distances over the three-year period. All but two California metro areas (Stockton and Fresno) had lower PMT levels, with both Bay Area metro areas (San Jose-Sunnyvale-Santa Clara and San Francisco-Oakland-Berkely) continuing to see the largest declines. Some of the Great Lakes’ oldest and largest metro areas (including Chicago-Naperville-Elgin, Ill.-Ind.-Wis. and Detroit-Warren-Dearborn, Mich.) experienced the country’s largest declines, which aligns with reporting about their major drops in downtown workers. Madison, Wis. and Lansing, Mich.—both state capitals with large public universities—saw major PMT drops too.
Unfortunately, there’s no easy way to explain the different patterns across the country.3 Certain variables do show a generally consistent impact on PMT, but there are always enough exceptions to question any kind of universal outcome.
The most logical guess is that metro areas with relatively more people working in industries with the highest telecommuting rates would register the largest drops in PMT. That’s certainly the case in some high-tech, advanced service, and educational hubs such as San Jose, Calif., Boston, and Madison, Wis. Yet metro areas Atlanta and Des Moines, Iowa have some of the highest location quotients in these industries, and they both saw household PMT rise by 3% and 2%, respectively.
Change in total metropolitan population doesn’t do a great job explaining PMT changes either. We know that starting in 2020, many people migrated away from the country’s more expensive metro areas, with many moving to more sprawling Southeast and Mountain West locations—which could mean the average household PMT in those places would rise. But while there was a positive relationship between the two variables, there were plenty of exceptions, including Las Vegas, Salt Lake City, and San Antonio.
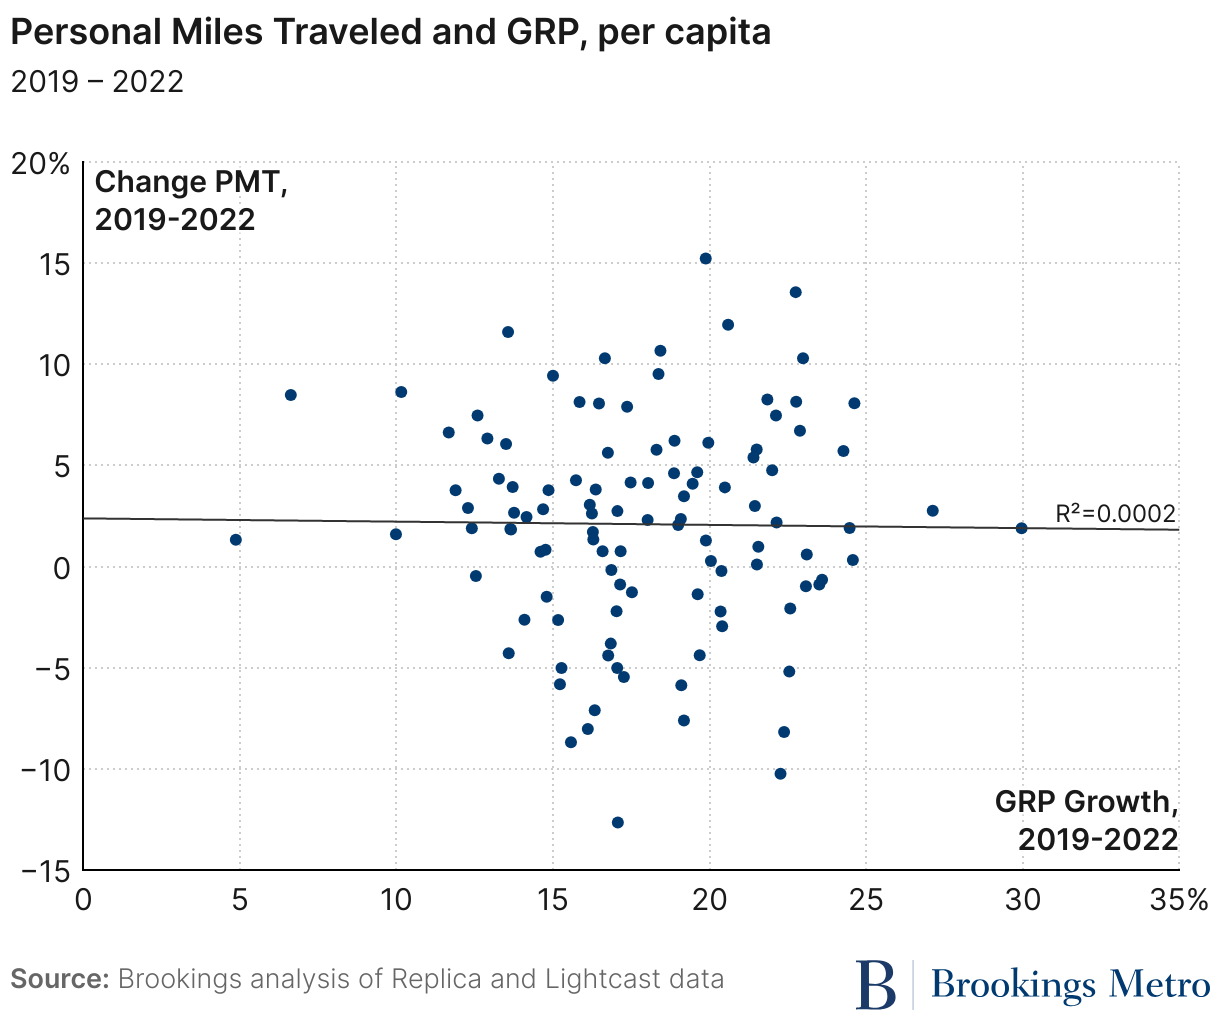
Per-capita economic growth—measured by gross regional product (GRP)—also did not correlate with household PMT change. In fact, there was essentially no relationship between economic growth and overall travel behavior (Figure 4). As other researchers have found, vehicle miles traveled (VMT, a subset of PMT) and gross domestic product (GDP) began to decouple in the 1990s after decades of parallel growth. This most recent three-year period only reinforces that a healthy metropolitan economy is unrelated to travel distances.
We looked at a sweeping set of variables—including housing costs, population density, presence of a state capital, even change in average household size—and couldn’t find either a single variable or a controlled set of multiple variables that consistently explained changes in household PMT at the metropolitan scale. This doesn’t mean those individual metrics don’t matter, or that a better explanatory model can’t be built. Instead, our takeaway is that summarizing data up to the metropolitan area may not be enough for this economic and cultural moment. We need to get more granular.
Transportation’s future may be decided at the neighborhood scale
It’s clear that the record-breaking air quality and traffic-free roads of early 2020 have long passed. Now, we can confirm more durable travel changes have taken hold: the drop in work-based and commuting travel, the rise of other home-based trips, and shifts in trip volume by time of day. However, changes in overall household PMT are deeply uneven across the country’s large and midsized metro areas. Put them together and a core implication takes hold: Practitioners in each metro area should be closely studying how emerging travel patterns offer opportunities to adapt preexisting transportation infrastructure and future regional planning for new economic demands.
For example, the data validates a disconnect between relatively healthy metropolitan economic indicators and the near-universal challenges facing downtowns and other office-centric neighborhoods. Generally speaking, output grew in all of the metro areas we studied. But with downtowns and office parks shedding so many daily workers who now stay home, local-serving businesses in neighborhoods closer to where people live are experiencing increased demand. It’s a geographic substitution effect on a relatively grand scale. It’s also a clear signal that state and local practitioners should reconsider any expensive transportation projects primarily focused on funneling commuters in and out of office-centric neighborhoods, and instead focus on improving the accessibility and safety performance in and around those neighborhoods.
Overall, we believe the findings in this report affirm a more neighborhood-centric approach to regional infrastructure planning. Where highways and hub-and-spoke mass transit once dominated our thinking about how to build competitive, 20th century metro areas, there are growing signs that neighborhood-scaled transportation will define competitive regions for this young century. We know shorter-distance trips contribute to reduced environmental emissions, fewer road-related injuries, and lower household transportation expenses. It’s going to require neighborhood-centric planning to help even more short-distance trips become the norm.
A neighborhood-centric approach will require a new generation of data and analysis that looks well beyond the commute. Many of the country’s most trusted transportation data sources—particularly, the census and the American Community Survey—exclusively measure commute-related travel. With work-related trips a shrinking minority of American metropolitan travel, it is increasingly important to understand the complex relationship between everyday household transportation decisions and broader regional travel dynamics. Other trusted public data sources—such as the National Household Travel Survey—do provide the necessary detail and breadth, but lack frequent releases and local details. And while private data such as that offered by Replica (analyzed in this piece) and other companies will continue to be important, planners and other practitioners would also benefit from public data sets with more frequent issuances, multiple trip purposes, and greater geographic specificity.
Switching away from the 20th century transportation model will also demand more flexible interventions, as infrastructure and land-use decisions should vary according to the diverse needs of each region and its neighborhoods. For many downtowns, this will likely implicate a need for more housing and social and cultural attractions to balance out single-use office buildings. And while some neighborhoods already feature safe streets, short blocks, and the last-mile transportation connections that make local travel accessible and safer, others are built nearly exclusively for cars. It’s up to local, regional, and state practitioners to work together to deploy the neighborhood-scale investments—both in terms of transportation assets and real estate—that will work best in each place.
The last three years proved that decades-long American travel patterns were not nearly as rigid as often thought. Instead of a temporary blip, the average household is looking for new ways to get around. It’s up to planners and practitioners to respond.
Authors


-
Footnotes
- This report uses a national model to study travel patterns between every block group in the 109 largest metro areas in the United States (those with populations of 500,000 or more, excluding San Juan, Puerto Rico and urban Honolulu). The data provider, Replica, uses a mix of cell phone geolocation data, credit card transactions, and underlying demographic information to create a simulated, agent-based model of all U.S. trips (not just commutes to work) on an average Thursday and Saturday in fall 2019 and 2022. The Replica data set also enables analysts to relate each individual trip and the trip purpose (commuting, shopping, or socializing) back to the traveler’s home block group. For this analysis, we aggregate Replica’s simulated trips up to the census block group level and extrapolate annual distance traveled by weighting Thursday and Saturday travel distances according to 2017 National Household Travel Survey findings.
- Due to data limitations, Honolulu is not included in this study.
- We ran correlations for all of the following variables against both annual household PMT and household PMT for the average Thursday. We also ran regression models to control for multiple independent variables at once.
The Brookings Institution is committed to quality, independence, and impact.
We are supported by a diverse array of funders. In line with our values and policies, each Brookings publication represents the sole views of its author(s).