
This analysis accompanies Metro Monitor 2024, a data interactive that provides decisionmakers in the nation’s 194 largest metro areas with a roadmap to understand how their individual places performed during this period.
Anyone who has tuned into the economic news cycle with any regularity over the past three years has heard repeatedly that the U.S. economy is breaking records and beating expectations. Traditional measurements of success—such as gross domestic product (GDP), employment, and consumer spending—have been soaring in the wake of the COVID-19 recession.
Yet these discussions have remained a largely national debate, overlooking the local and regional economic conditions that significantly influence how Americans participate in and benefit from economic growth.
Providing this bottom-up lens—and supporting regional efforts to grow a more inclusive economy—is the core purpose of the Brookings Metro Monitor. In this update, we assess inclusive economic growth among the nation’s 194 metropolitan areas with at least 250,000 residents, and whether strong domestic performance has translated into meaningful change at the local level. These metro areas are the core building blocks of the national economy, representing distinct labor markets that together account for 78% of U.S. population and 84% of U.S. GDP.
Related Content
What is the Metro Monitor?
The Metro Monitor is Brookings Metro’s comprehensive tracker of economic growth in regional economies across the U.S. with populations greater than 250,000.1 We group metro areas into three size categories: 54 “very large” metro areas with populations above 1 million; 55 “large” metro areas with populations between 500,000 and 1 million; and 85 “midsized” metro areas with populations between 250,000 and 500,000. We also group metro areas across the four major census regions (South, West, Midwest, and Northeast) to explore geographic trends. This tool tracks economic progress across 15 indicators of growth, prosperity, and inclusion. This year’s Metro Monitor evaluates how regional economies have changed between 2012 and 2022 on the following indicators:
| Growth | Prosperity | Overall inclusion | Racial inclusion | Geographic inclusion |
| Real GDP | Average wages | Employment rate | Employment gap, white vs. POC | Neighborhood employment gap |
| Total employment | Productivity | Median earnings | Earnings gap, white vs. POC | Neighborhood earnings gap |
| Jobs at young firms | Standard of living | Relative poverty | Poverty gap, white vs. POC | Neighborhood poverty gap |
For a detailed description of each indicator, please see our metrics glossary.
While growth has been widespread, prosperity gains have been uneven
The 2012-2022 decade marked a notable series of highs and lows for the U.S. economy. It included the bulk of the longest national economic expansion on record (2012 to 2020), a short but extraordinarily deep contraction during the pandemic (2020), and a recovery period fueled by unprecedented levels of federal stimulus (2020 to 2022). Throughout this volatility, metro areas experienced widespread growth between 2012 and 2022, with 145 (75%) posting gains across all three of the Metro Monitor’s indicators of economic growth (GDP, total employment, and jobs at young firms).
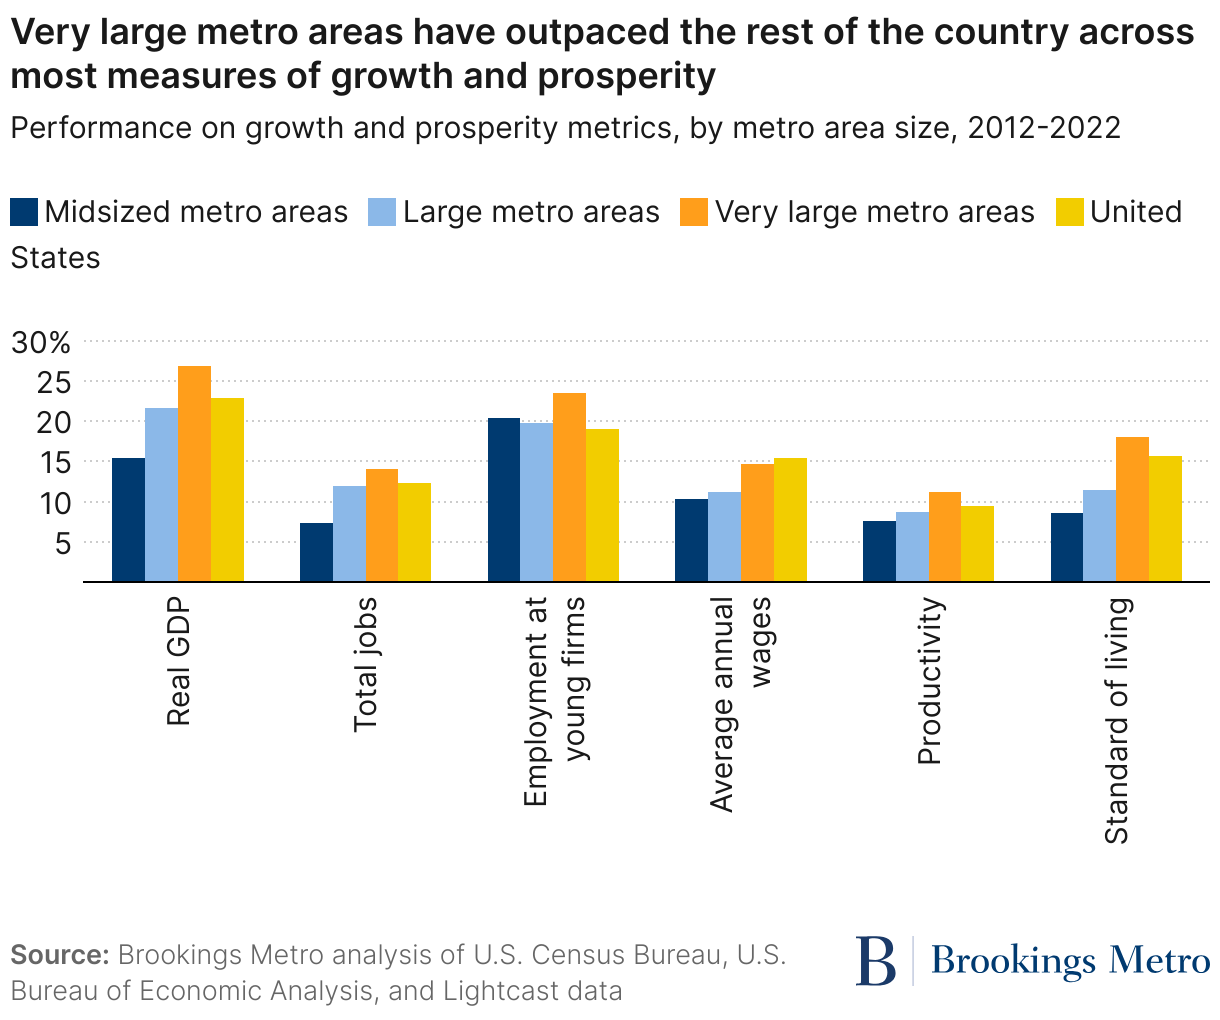
Growth was strongest and most widespread in metro areas with populations over 1 million. Of these 54 “very large” regions, 45 (83%) posted gains across all of the Metro Monitor’s three growth indicators, and outpaced the nation on these indicators overall. Very large metro areas also posted uniquely strong gains across the Metro Monitor’s measures of economic prosperity, keeping pace with the U.S. average on wage growth and outperforming the nation on gains in productivity (output per job) and standard of living (output per person).2 In total, 52 (96%) very large metro areas improved across all these three prosperity metrics—a significantly greater share than midsized metro areas (80%) and large metro areas (89%).
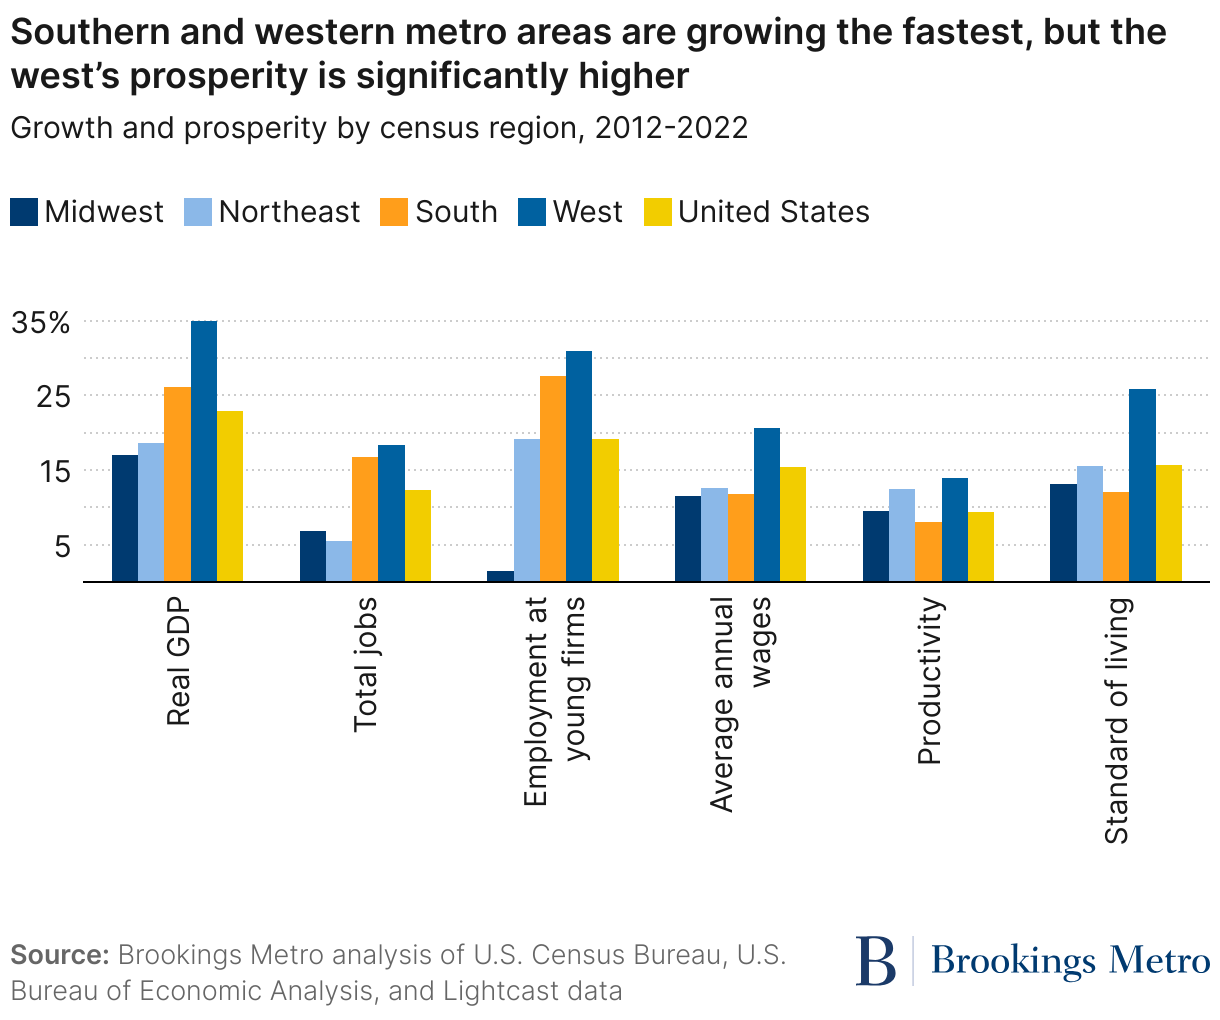
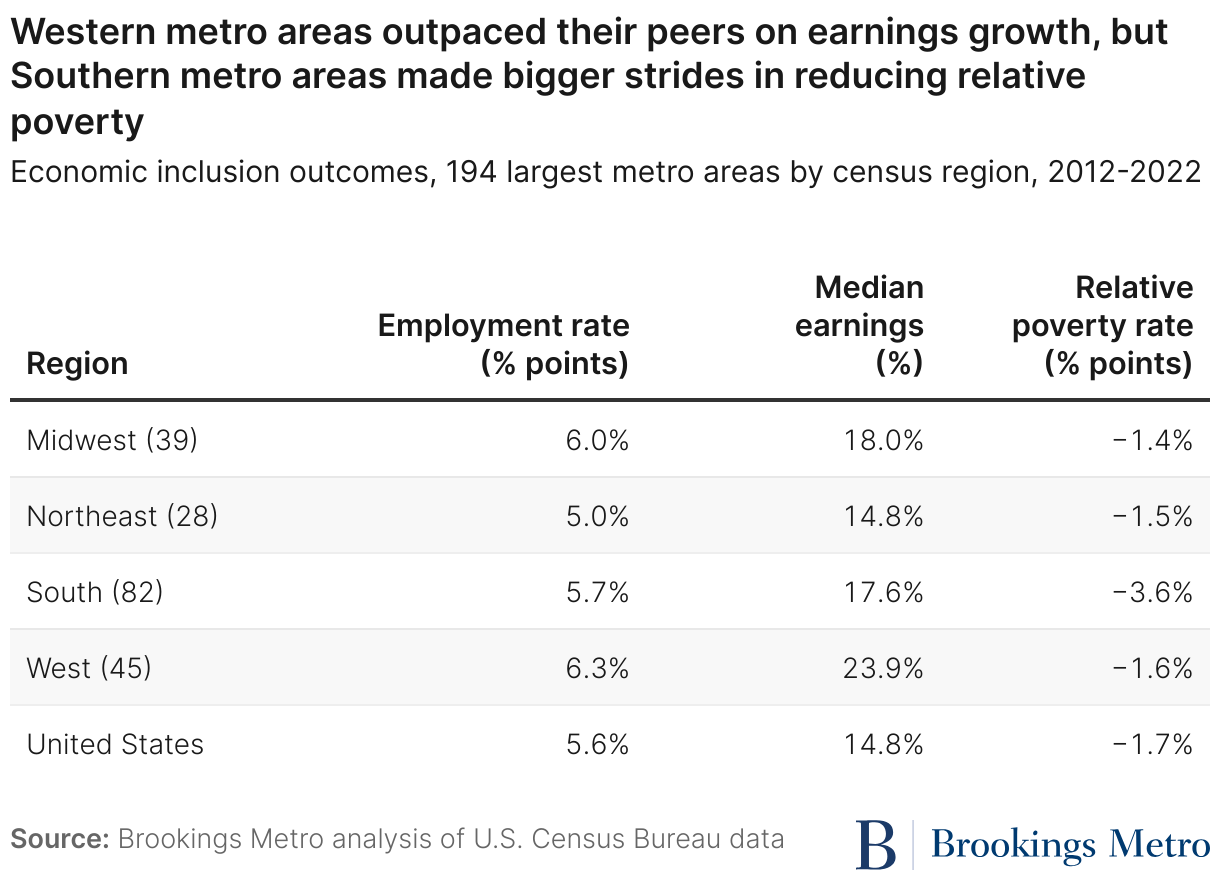
Southern and Western metro areas powered U.S. growth during this period, as seen by large gains in real GDP, jobs, and employment at young firms. But there was significant regional variation in the degree to which growth translated to prosperity. Western metro areas led those in other U.S. regions on average measures of both growth and prosperity, whereas Southern metro areas experienced much smaller increases in average wages, productivity, and standard of living. These divergent outcomes in prosperity suggest a more “population-fueled” growth pattern in the South relative to the West, with population gains fueling economic growth more than improvements in productivity.
Indeed, the types of industries powering growth matter greatly for prosperity. Prosperity gains tended to be largest in metro areas with a strong presence of high-tech, advanced manufacturing, and startup sectors, which uniquely benefited from the surge in global venture capital that followed the Great Recession and the increased ubiquity of smart phones, e-commerce, and high-speed data. This includes long-standing tech strongholds such as San Jose, Calif. and Austin, Texas, but also smaller, emerging innovation economies such as Provo-Orem, Utah, Bend, Ore., and Boise, Idaho—a possible result of tech workers and companies migrating out of increasingly unaffordable tech hubs such as San Francisco and Seattle. The challenge for these Western regions is that the pace of this tech-led growth has overwhelmed housing supply and created affordability pressures. Meanwhile, metro areas in the Midwest and Northeast demonstrate the opposite pattern of their Southern counterparts: relatively solid prosperity gains even amid slower overall economic growth during the 2012-2022 period. Metro areas such as Buffalo, N.Y., Madison, Wis., and Manchester, N.H. exemplify this trend.
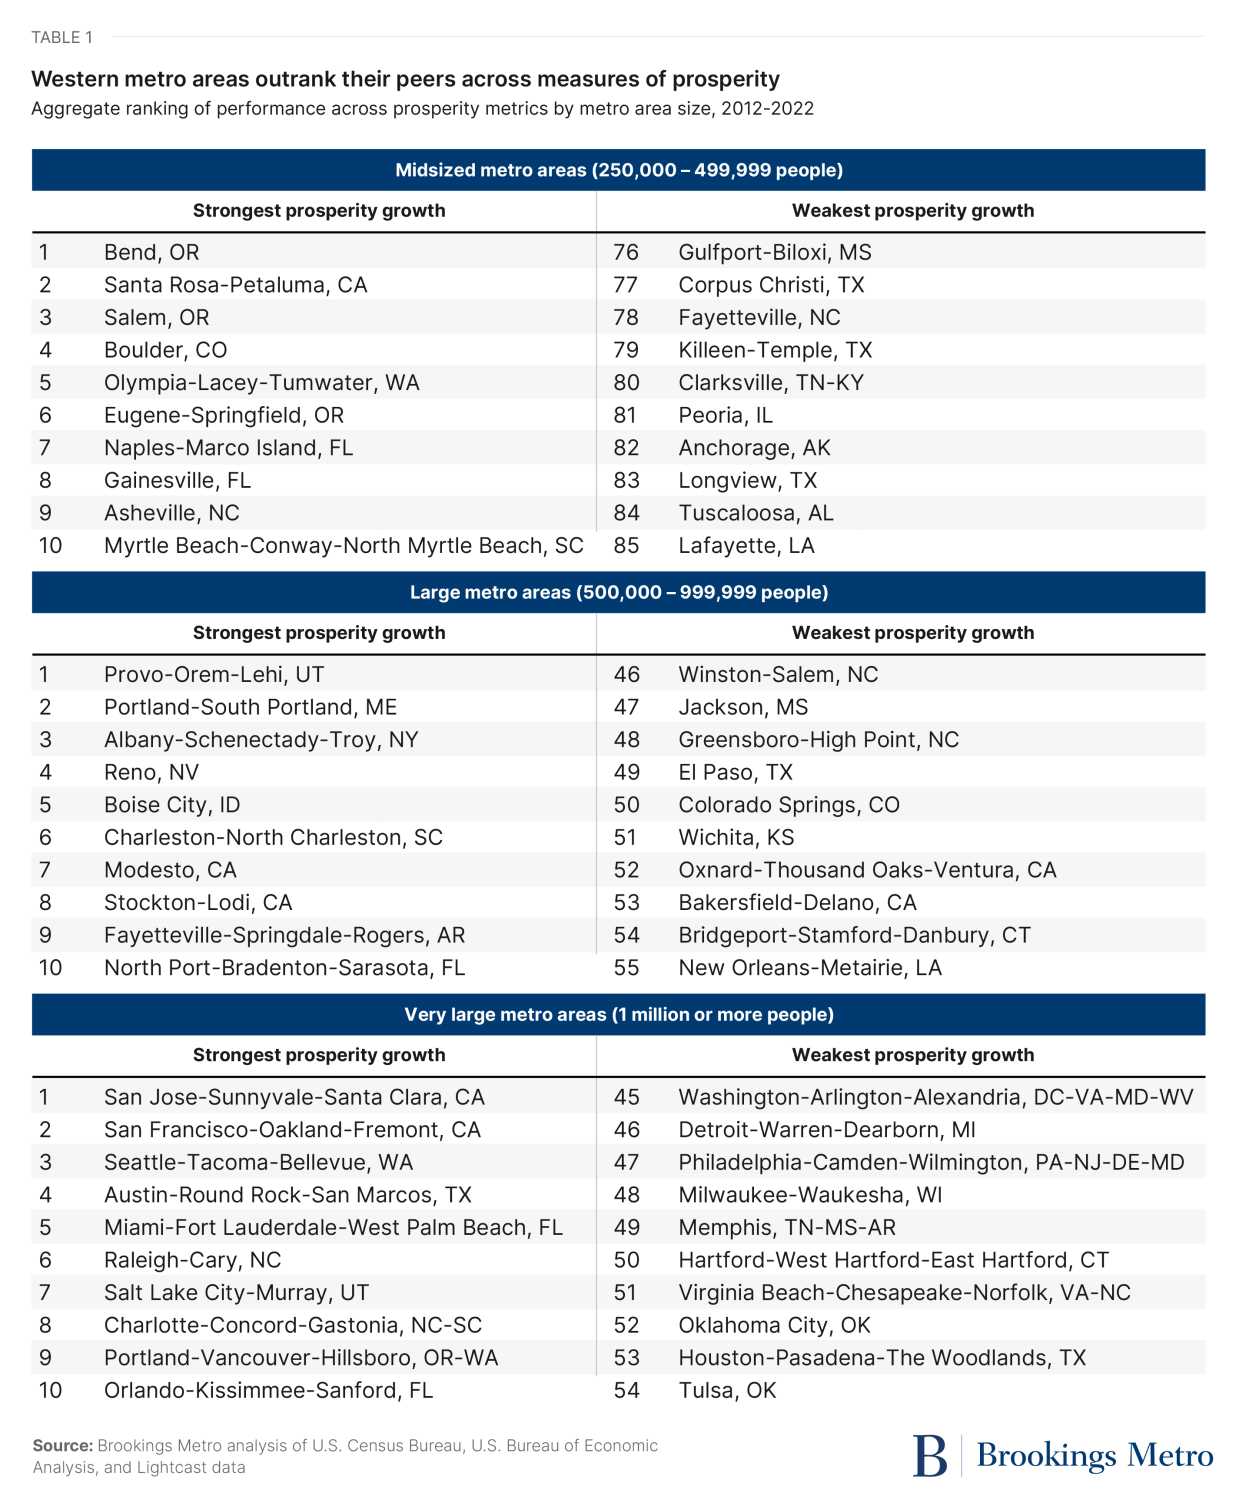
Table 1 reflects the 2012-2022 period’s reliance on technology and advanced services to drive prosperity gains. Among very large metro areas, prosperity improved most in prominent hubs of advanced technology across the West and South. Notably, many of the greatest gains among large and midsized metro areas were either proximate to very large, well-established centers of technology (e.g., Modesto, Calif., Stockton, Calif., and Olympia, Wash.) or were in areas that offered natural amenities highly desired by footloose technology workers and companies seeking to hire them (e.g., Bend, Ore., Santa Rosa, Calif., and Eugene, Ore.). Midsized and large metro areas can build on these favorable trends by investing in future sources of advanced industry growth. For example, the Biden administration recently awarded long-standing tourism hub Portland, Maine a Tech Hubs designation to support its efforts to become a global leader in forest-based biomaterial production and manufacturing.
Metro areas are growing more inclusively, but demonstrate mixed performance in extending these benefits to workers of color
Overall, growth and prosperity gains in these 194 metro areas were accompanied by improvements in economic inclusion between 2012 and 2022. Over the last decade, every metro area in the analysis posted growth in median earnings, adjusting for inflation and regional differences in cost of living.3 Similarly, all but two metro areas had a higher employment rate in 2022 than a decade prior, and 94% made progress in reducing their relative poverty rate (the share of workers in a metro area earning less than half of that metro area’s median income).
Metro areas in the West (e.g., Fort Collins-Loveland, Colo. and Fresno, Calif.) experienced the strongest growth in regionally adjusted median earnings. This includes tech-intensive Western metro areas known for their exorbitantly high costs of living, such as San Francisco (27% increase), San Jose, Calif. (29% increase), and Seattle (22% increase)—meaning that these metro areas generated real wage growth that exceeded the growth in living costs for workers in the middle of their income distribution.
Comparatively, Northeastern metro areas stagnated in terms of median earnings. Across all midsized, large, and very large metro areas with the largest increases in median earnings between 2012 and 2022, only one Northeastern metro area—Erie, Pa.—ranked in the top 50. And of the 20 metro areas that posted the largest increases in earnings, 16 were in the South or West, while the remaining four were in the Midwest (in Michigan and Ohio). However, despite these regional differences in earnings growth, Southern metro areas (e.g., Naples-Marco Island, Fla. and Wilmington, N.C.) were more successful than their peers in other regions at reducing their relative income poverty rate.
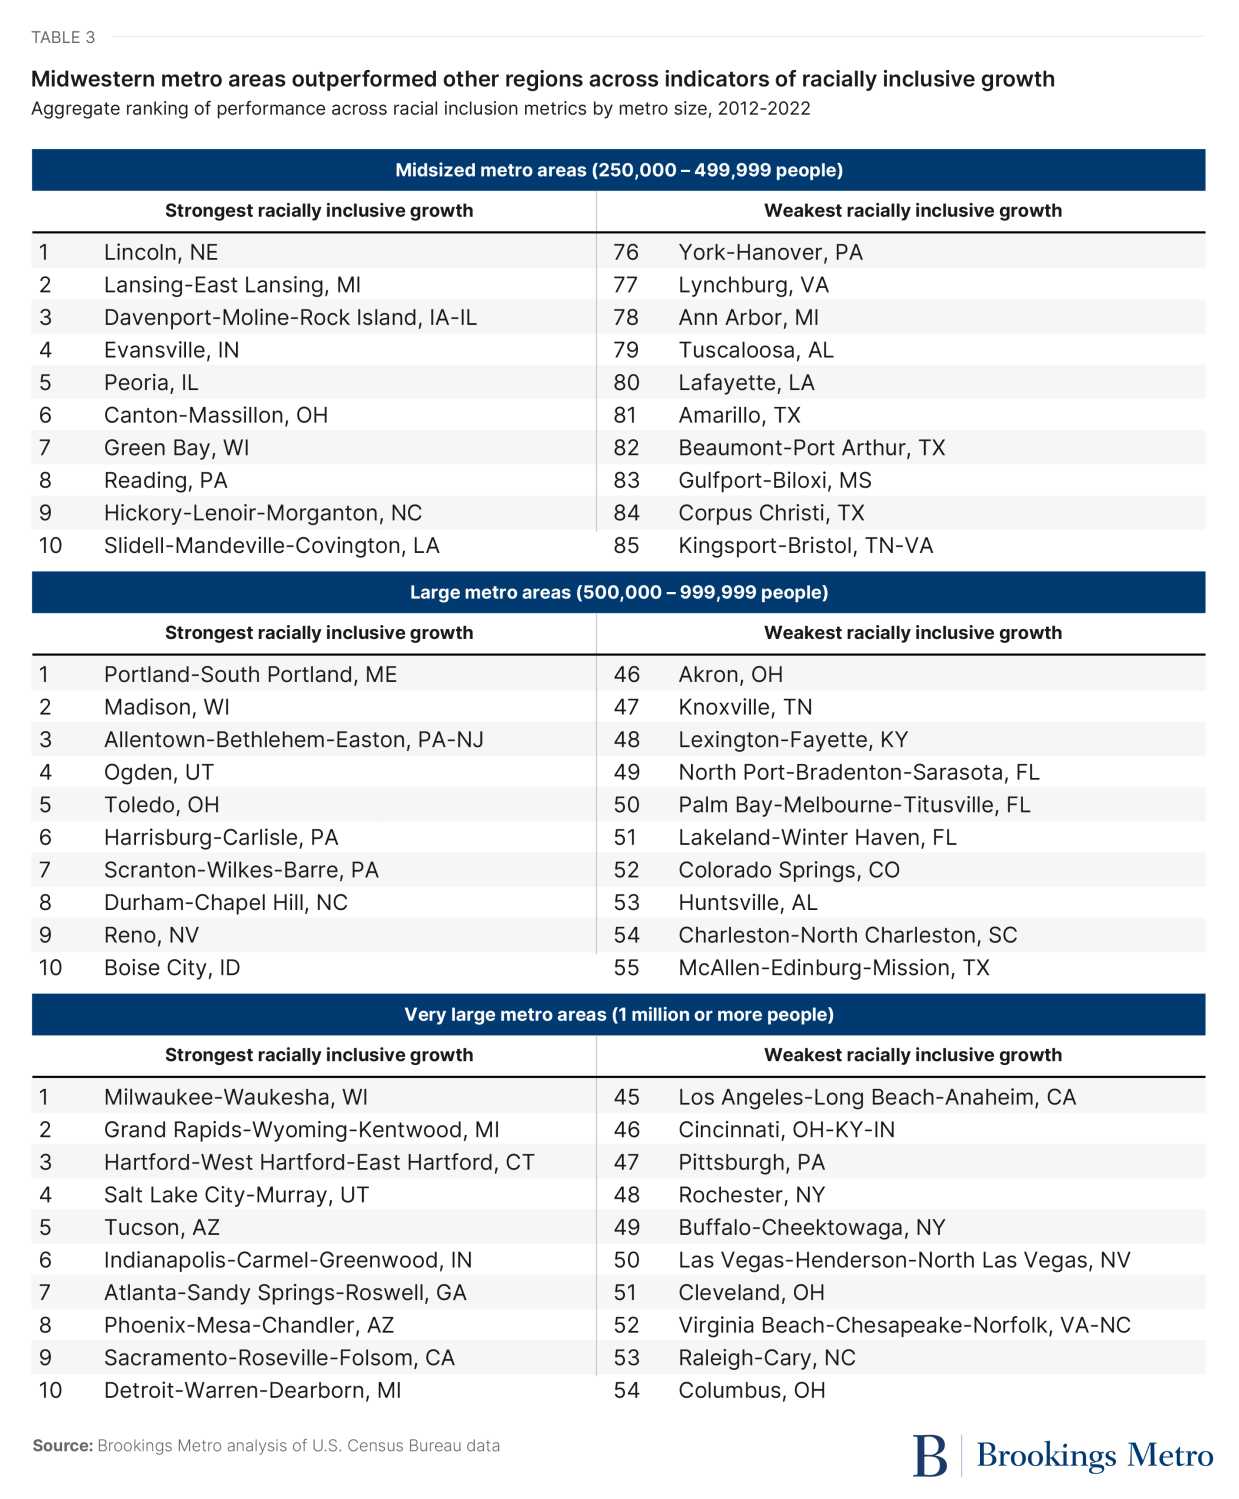
However, improvements in overall economic inclusion did not always close long-standing disparities between white workers and workers of color. While 182 (94%) metro areas posted gains on all three of the Metro Monitor’s indicators of overall economic inclusion, only 77 (40%) made gains on all three indicators of racial inclusion (measured as the employment, earnings, and relative poverty gaps between white workers and workers of color). Performance on racial inclusion also varied substantially by region, with Midwestern metro areas accounting for 43% of all top 10 metro areas in each size class across indicators of racial inclusion, and just 17% of the bottom 10 metro areas. In contrast, Southern metro areas accounted for just 13% of the top 10 metro areas across these racial inclusion indicators, but 60% of bottom 10 metro areas.
Strong and shared wage growth has nonetheless failed to close stubborn racial and geographic earnings disparities
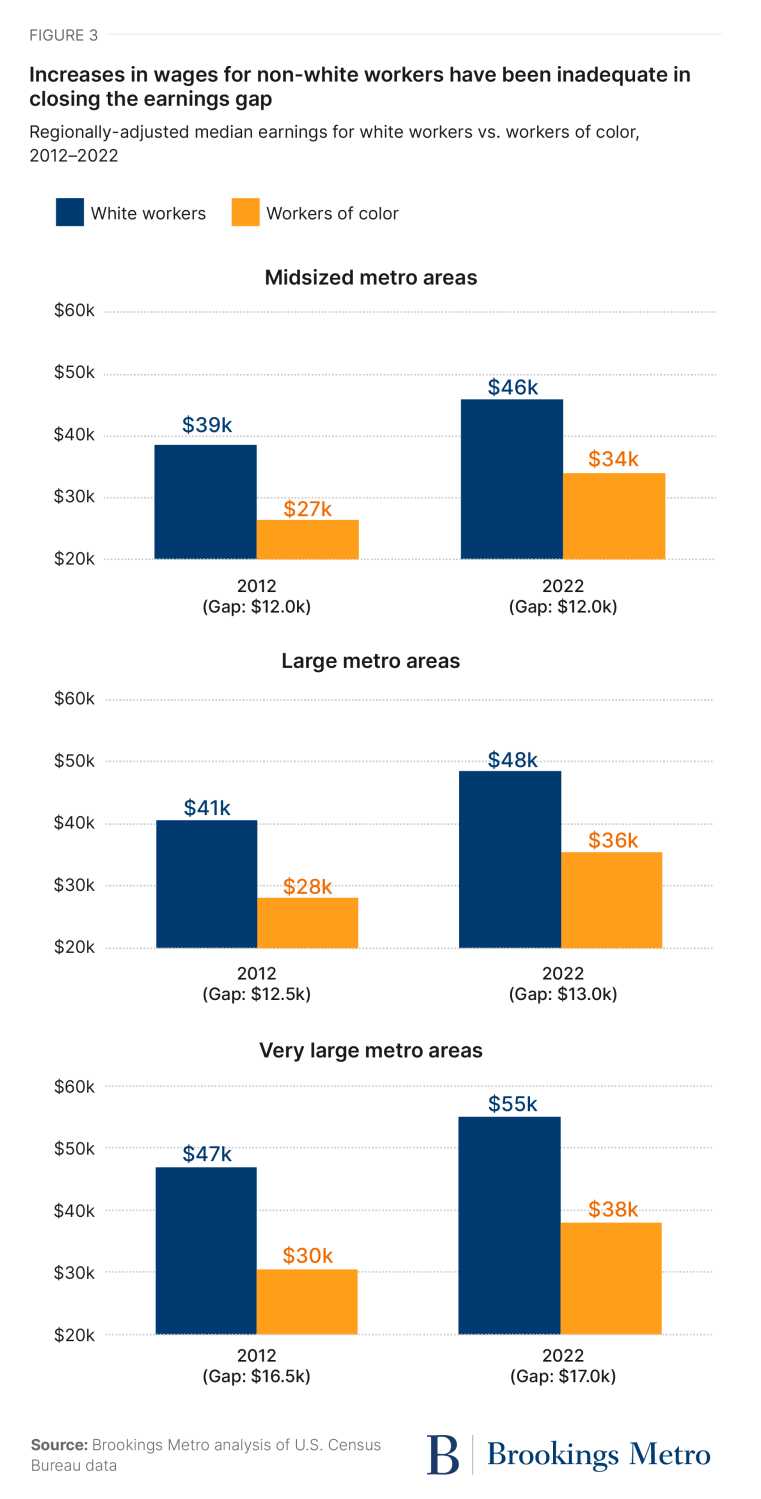
Between 2012 and 2022, the rate of earnings growth among workers of color substantially outpaced that of white workers in metro areas of all sizes. For instance, in very large metro areas, median earnings for workers of color grew 25% (from roughly $30,500 to $38,000), while median earnings for white workers grew 17% (from roughly $47,000 to $55,000). Yet even with this faster pace of earnings growth among workers of color, the absolute earnings gap between white workers and workers of color did not change during this period; in the case of very large metro areas, that gap actually grew slightly (by $500). The widening of the racial earnings gap—even as earnings by workers of color increased significantly—is illustrative of how systemic inequality compounds over time.
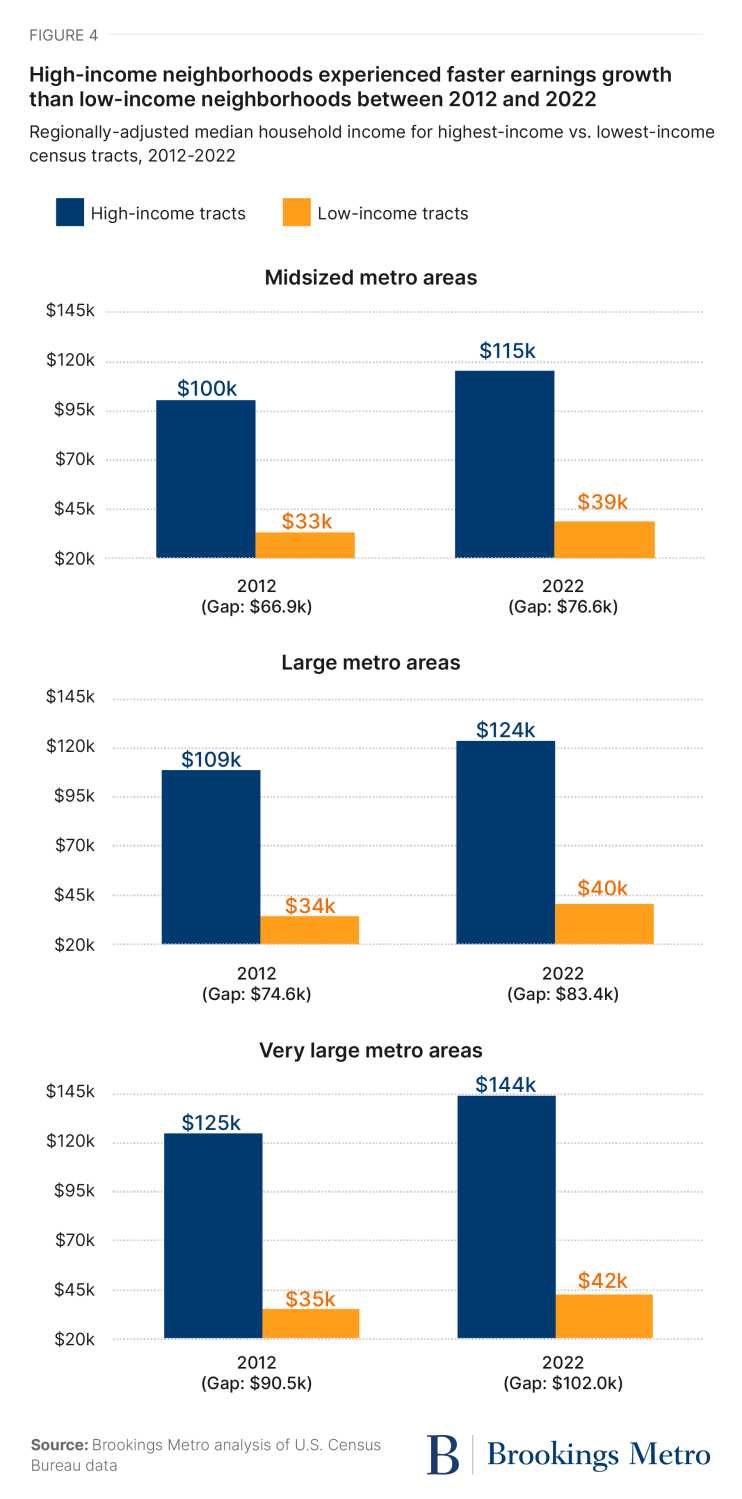
Stubborn earnings inequality—in which strong wage growth is insufficient in reducing overall disparities between groups—was evident in our analyses of metro-area-level geographic inclusion as well (measured as the level of disparity between census tracts in the top fifth and bottom fifth of a region’s employment, income, or poverty rate distribution). Though household income went up in the bottom 20% of census tracts between 2012 and 2022 in all but four metro areas, 96% of these metro areas had a larger earnings gap between their lowest- and highest- income neighborhoods in 2022 than in 2012. In 119 (61%) of all 194 metro areas, the 2022 earnings gap between the richest and poorest metropolitan neighborhoods was greater than $74,600—as much as the total income of a typical U.S. household. This growing geographic segregation is being powered by outsized gains in earnings among households in high-income neighborhoods (particularly those located in very large metro areas), while lower-income neighborhoods experience much slower earnings growth. This pattern suggests that the benefits of growth have disproportionately landed in communities that were already thriving, in contrast to earnings trends by race (Figure 6), in which benefits accrued relatively equitably to white workers and workers of color.
Measuring current status, past trajectories, and future opportunities matter for setting inclusive growth strategies
It is important to note that with all indicators tracked in the Metro Monitor, measuring change over time may not fully capture a metro area’s current economic condition—only its progress and trajectory. High rankings in the Metro Monitor should be understood as a “most improved” designation, not a “best” designation. Indeed, it is reasonable to expect that the best places will rarely also be the most improved, because it is harder to make incremental gains toward top performance than it is to quickly move toward average performance, particularly across racial and geographic indicators in regions with more diverse populations. Take, for example, the racial inclusion-median earnings gap indicator, for which metro areas could fall into one of four categories:
- Weak performance, weak trajectory metro areas include regions that were less inclusive than their peers in 2022 as a result of worsening economic inclusion over the prior decade. This includes regions such as McAllen-Edinburg-Mission, Texas, which had one of the highest earnings gaps between white workers and workers of color in 2022 and posted a higher increase in its earnings gap between 2012 and 2022 than all other metro areas.
- Strong performance, strong trajectory metro areas include regions that were more economically inclusive than many of their peer regions in 2022 as a result of significant improvement on these indicators over the prior decade. This includes regions such as Slidell-Mandeville-Covington, La., which was significantly less economically inclusive than other metro areas in 2012, but has since undergone a trajectory shift and now has one of the smallest racial earnings gaps of any of its peers.
- Weak performance, strong trajectory metro areas include regions that improved their relative performance on indicators of economic inclusion between 2012 and 2022 in comparison to their peers, but this trajectory has not actually led to that metro area becoming more economically inclusive than those other regions. For example, Brownsville, Texas posted one of the largest reductions in its racial earnings gap of any metro area over the last decade (thus boosting its relative racial inclusion score), but continued to rank in the top 10 metro areas for largest absolute racial earnings gaps as of 2022.
- Strong performance, weak trajectory metro areas include regions that were more economically inclusive than their peers in 2022, but posted relatively low improvement rates in these indicators over the prior decade. For example, Olympia-Lacey-Tumwater, Wash. had the fourth-smallest racial earnings gap of any other metro area in 2022, but this gap was virtually unchanged from its 2012 level.
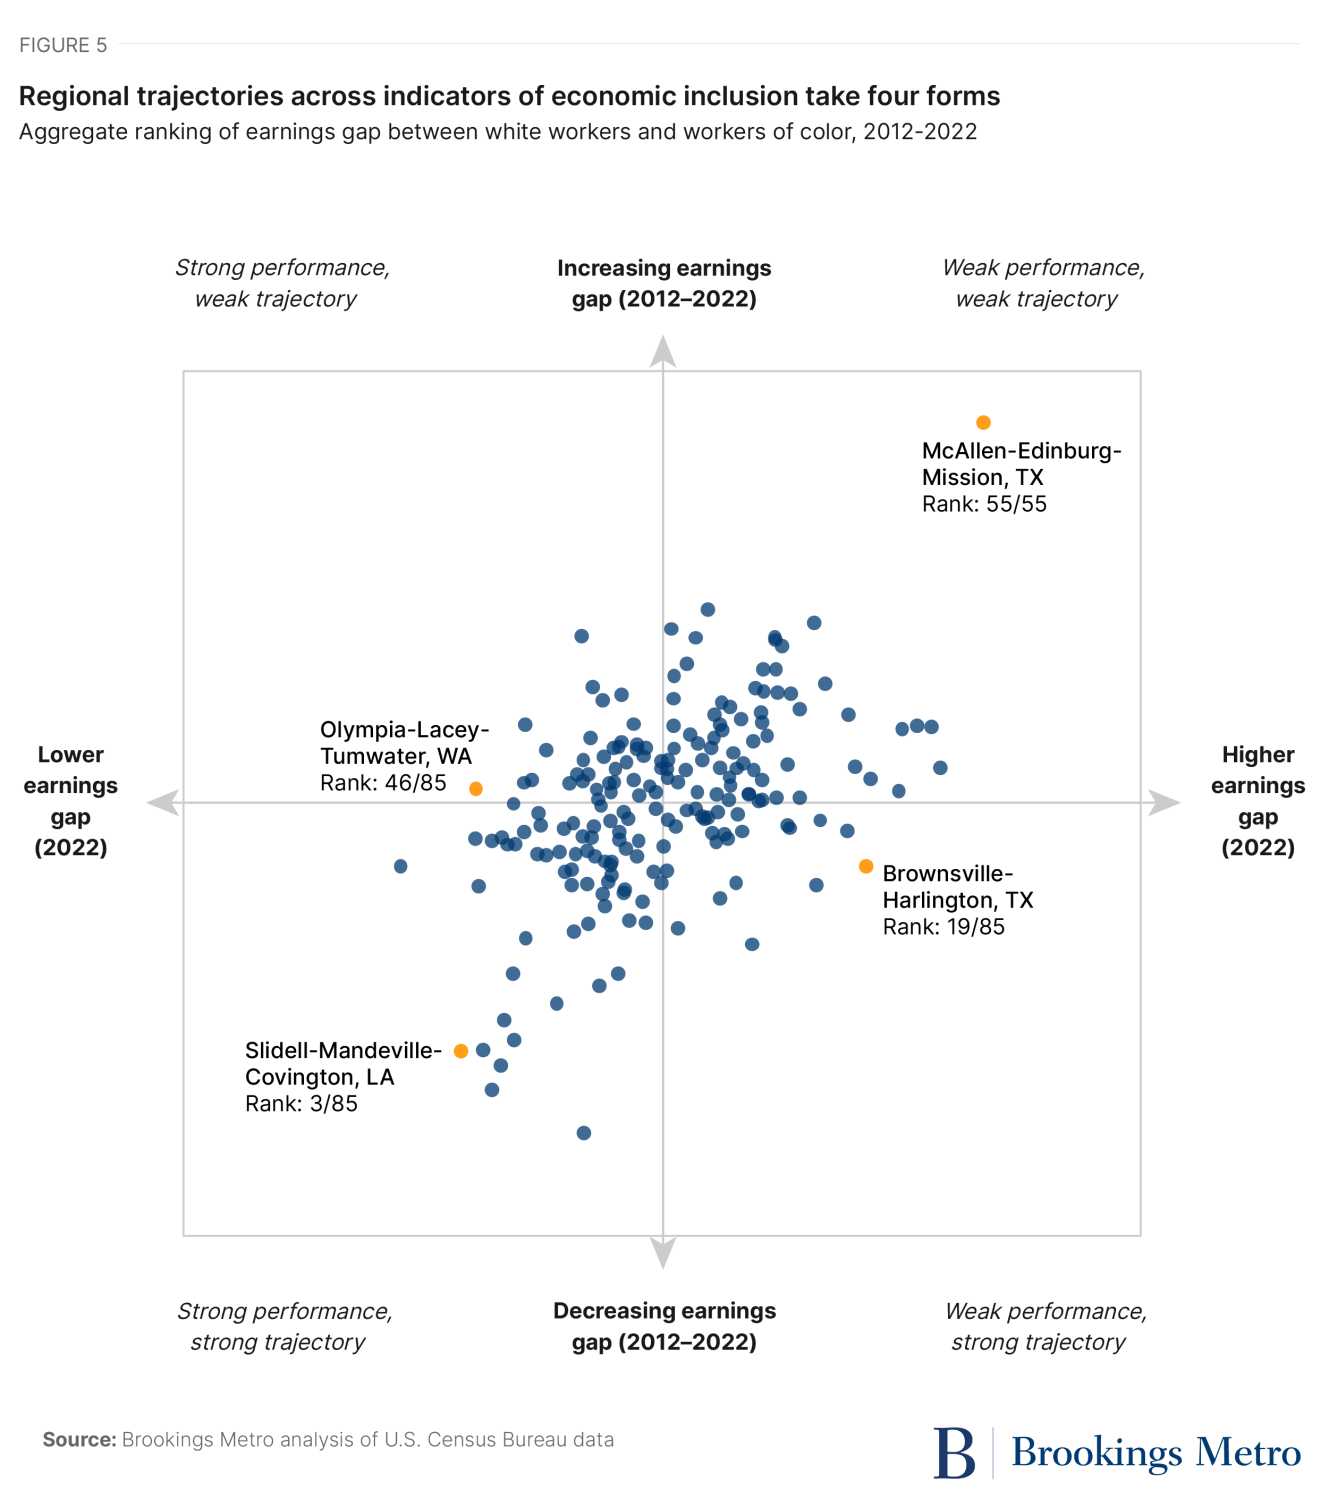
Metro areas that fall in the last two categories (the upper-left and bottom-right quadrants in Figure 5) are particularly important for regional leaders to understand, as weak performance, strong trajectory regions will rank more favorably on longitudinal analyses (such as the Metro Monitor), while strong performance, weak trajectory metro areas will rank lower. This has two key implications for regional leaders. First, regions with high scores should exercise caution before seeing these rankings as a clear validation of their strategic orientation. Second, when local leaders seek to identify other regions whose practices and policies they should replicate, they should consider regions that are both high-performing and improving. A 360-degree view of inclusive growth should be driven by an understanding of:
- Performance status. How inclusive is a regional economy at a set point in time? How does this performance compare against regions with similar populations and demographic compositions?
- Trajectory. How has this status changed over the past 10 years? How did relative improvements translate, if at all, to absolute improvements? Given that, what are ambitious but attainable goals for performance improvement and growth going forward?
- Opportunity. What obstacles are preventing a regional economy from extending economic opportunity to more people and places? Where can local leaders intervene in talent development ecosystems, supply chains, and community awareness strategies to mitigate these obstacles?
With performance status, trajectory, and opportunity in mind, regional economic leaders can chart informed, ambitious, and actionable strategies that improve economic outcomes for workers, families, and communities that have historically been left behind. And, hopefully, create a national economy that feels as good as it looks on paper.
Metro Glossary
GROWTH is the Metro Monitor’s comprehensive measure of a regional economy’s size and activity level, based on that region’s gross domestic product, total employment, and number of jobs at firms zero to five years old.
- GROSS DOMESTIC PRODUCT (GDP) is the value of final goods and services produced in the U.S. each year. This measure of economic output is also referred to as “gross regional product” in subnational geographies (e.g., counties and metropolitan areas). The Metro Monitor adjusts all GDP values for inflation using the GDP implicit price deflator provided by the Bureau of Economic Analysis (BEA).
- EMPLOYMENT is the total number of full-time and part-time jobs in a region each year.
- JOBS AT YOUNG FIRMS are the total number of full-time and part-time jobs in a region held at firms that are less than five years old (inclusive).
PROSPERITY is the Metro Monitor’s comprehensive measure of the strength of regional economy’s growth respective to its total employment base and population level, based on that region’s average annual wages, productivity level, and standard of living index.
- AVERAGE WAGES are the total wages paid in a region over a given year, divided by that region’s number of full-time and part-time workers.
- PRODUCTIVITY is a region’s annual inflation-adjusted gross domestic product, divided by that region’s number of full-time and part-time workers.
- STANDARD OF LIVING is a region’s annual inflation-adjusted gross domestic product, divided by that region’s total population.
INCLUSION is the Metro Monitor’s comprehensive measure of how a regional economy’s economic benefits are distributed across its workers and households, based on that region’s employment rate, median earnings, and relative income poverty rate.
- EMPLOYMENT RATE is the number of people in a region that are employed either full time or part time, divided by that region’s total population (measured among the region’s 18- to 64-year-old population).
- MEDIAN EARNINGS is the amount that the person in the center-most point of a region’s income distribution earned in wages, supplements, and benefits over a given year (measured among the region’s 16 years or older population that earned income that year). The Metro Monitor adjusted all earnings values for inflation using the personal consumption expenditures price index provided by the Bureau of Economic Analysis (BEA), and further adjusted these values for regional cost-of-living differences using the BEA’s regional price parity indices.
- RELATIVE INCOME POVERTY RATE is the number of people in a region earning less than 50% of that region’s inflation-adjusted median earnings (measured among the region’s 16 years or older population that earned income that year). Because this method of assessing regional poverty accounts for regional differences in earnings and cost of living by default, the Metro Monitor does not adjust earnings values by regional price parity to estimate that region’s relative income poverty rate.
RACIAL INCLUSION is the Metro Monitor’s comprehensive measure of whether a region’s economic benefits and inclusive outcomes are being equitably shared between white workers and workers of color.
- EMPLOYMENT GAP, WHITE VS. POC is the difference (in percentage points) in a region’s employment rate between its white, non-Hispanic workers and its workers of color.
- EARNINGS GAP, WHITE VS. POC is the difference (in inflation-adjusted and regionally adjusted dollars) in a region’s median earnings for its white, non-Hispanic workers and its workers of color.
- POVERTY GAP, WHITE VS. POC is the difference (in percentage points) in a region’s relative income poverty rate between its white, non-Hispanic workers and its workers of color.
GEOGRAPHIC INCLUSION is the Metro Monitor’s comprehensive measure of whether a region’s economic benefits are being equitably shared between workers and households living at the top and bottom of that region’s employment rate, median household income, and relative income poverty rate distributions.
- NEIGHBORHOOD EMPLOYMENT GAP is the difference (in percentage points) in a region’s employment rate between workers living in census tracts in the top fifth and bottom fifth of a region’s employment rate distribution.
- NEIGHBORHOOD EARNINGS GAP is the difference (in inflation-adjusted and regionally adjusted dollars) in a region’s median household income between households living in census tracts in the top fifth and bottom fifth of a region’s household income distribution.
- NEIGHBORHOOD POVERTY GAP is the difference (in percentage points) in a region’s relative income poverty rate between workers living in census tracts in the top fifth and bottom fifth of a region’s relative income poverty rate distribution.
Authors


-
Footnotes
- Metro Monitor 2024 tracks economic growth for 193 metropolitan statistical areas and one micropolitan statistical area. While the Office of Management and Budget does not define micropolitan statistical areas as “urban,”we include micropolitan statistical areas in the Metro Monitor if their populations exceed 250,000—in recognition that they share many of the same labor market characteristics as other metropolitan areas.
- While per capita GDP is a widely recognized measure of a region’s standard of living, it should be interpreted strictly as an indicator of the average level of wages (and therefore, employment) available to a person living and/or working within that region. This metric does not reflect other factors influencing regional quality of life, or provide any indication of whether wages and employment opportunities are distributed equitably across a regional economy.
- This edition of the Metro Monitor adjusts all median income values by inflation and regional price parity using indices provided by the Bureau of Economic Analysis. Regional adjustments are not factored into analyses of relative poverty, since this metric explicitly compares an individual’s income to their home region’s income level.
The Brookings Institution is committed to quality, independence, and impact.
We are supported by a diverse array of funders. In line with our values and policies, each Brookings publication represents the sole views of its author(s).

