When the COVID-19 pandemic began in March 2020, no one was sure what congregate activities were safe. In order to protect themselves and stop the spread, many people who had flexibility in when and how they get around avoided using mass transit systems. Three long years later, transit ridership still has not recovered in major U.S. transit systems, creating a fiscal cliff for systems that are reliant on fare revenue to fund operations and leading to questions about how to structure a viable future for American transit.
This report seeks to help readers understand how the pandemic’s long-term effects on the types of trips Americans make have produced both challenges and opportunities for U.S. transit systems. Public transit remains essential in large metro areas—not just as a social service or transport of last resort, but as a necessary part of safe, productive, climate-friendly regions. Rather than focusing solely on getting remote workers to return to taking the bus or train to downtown offices, U.S. transit agencies should focus on building public transportation networks that can serve all trips—not just commutes—in the areas where features such as density, mixtures of uses, walkable and well-connected street grids, and low automobile ownership make these transportation modes most viable.
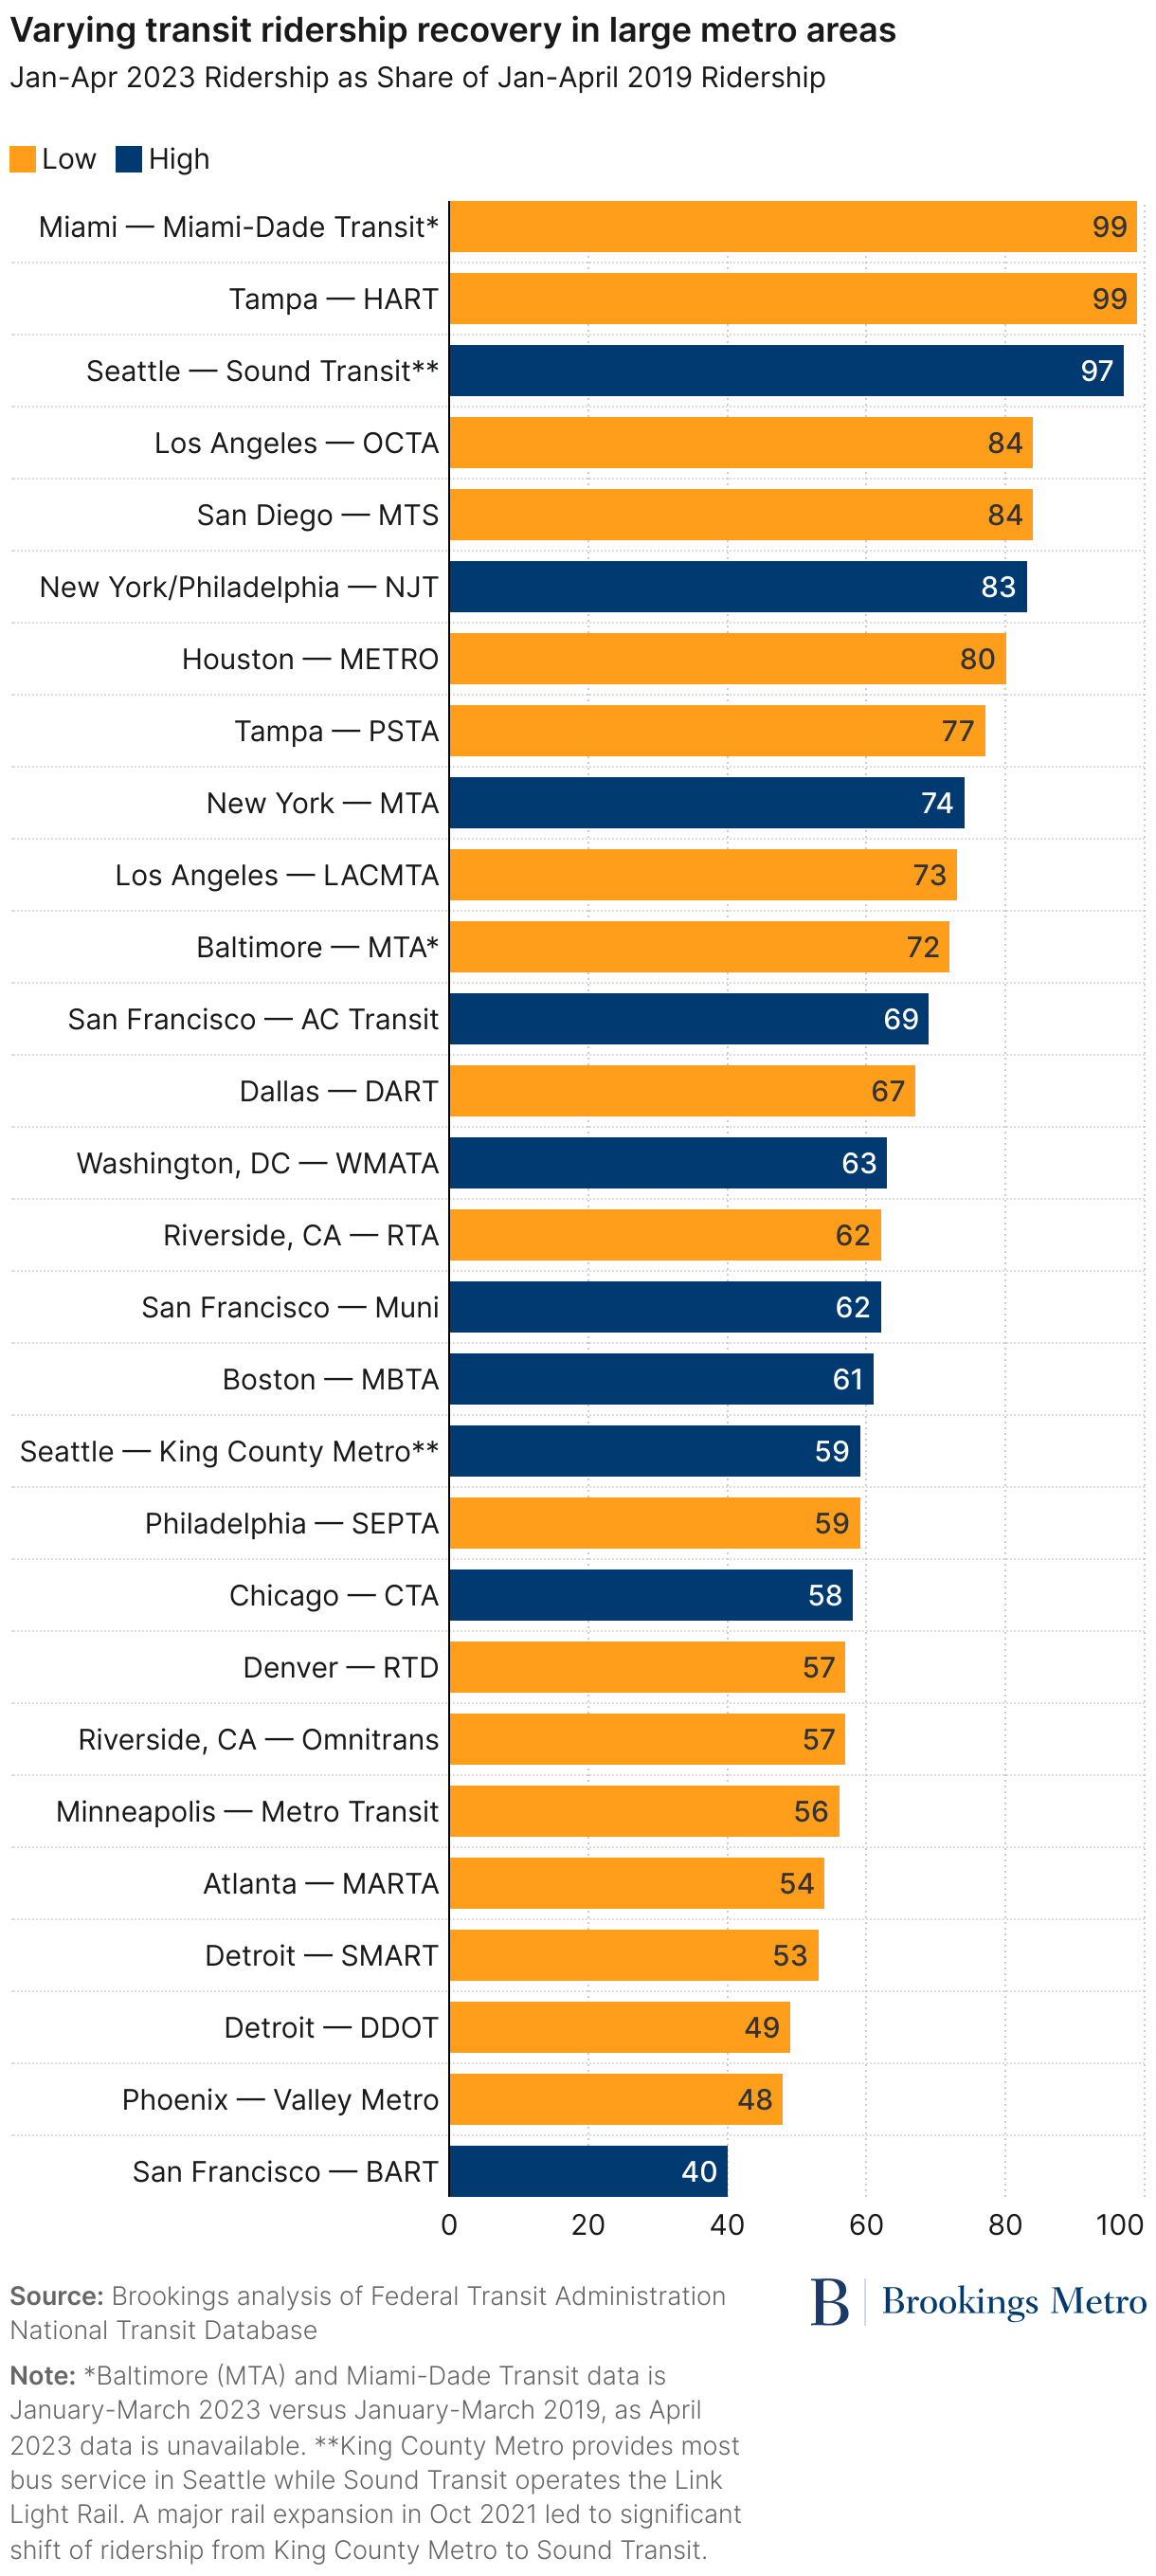
The report focuses on the six large metro areas where the 2017 National Household Travel Survey (NHTS) found that more than 5% of all trips were made by public transportation: Boston, Chicago, New York, San Francisco, Seattle, and Washington, D.C. Between them, these metro areas were home to 56% of all U.S. public transit trips in 2017, despite housing only 15% of the country’s population. These “high-ridership metro areas” range from the nation’s largest (New York) to its 15th-largest (Seattle); we will compare them to the remainder of the 20 largest metro areas, which had 2017 transit mode shares ranging from 3.8% (Baltimore) to 0.4% (Tampa, Fla.).
Our choice to focus on the 20 largest U.S. metro areas does not mean that these are the only metro areas where public transportation can flourish. (In fact, transit ridership has recovered more rapidly outside of the very largest metro areas. For example, according to the Federal Transit Administration’s National Transit Database, ridership on the Richmond, Va. bus system in the first four months of 2023 was 105% of its total in the same months of 2019.) Rather, we were limited to studying large metro areas by the sample size of the 2017 NHTS.1
Commutes represent a minority share of travel, but transit ridership hasn’t reflected that
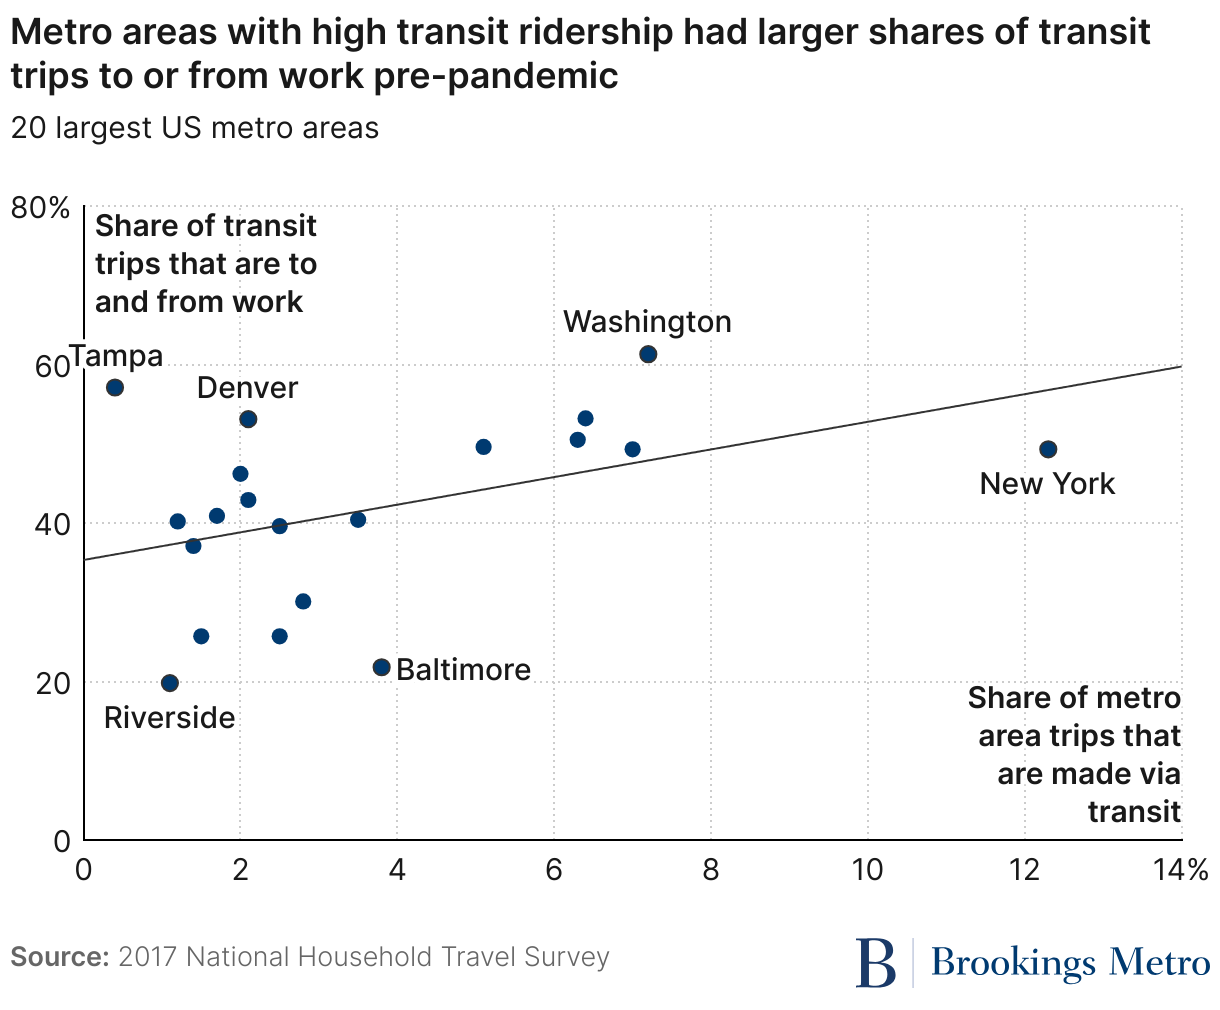
The vast majority of travel in the U.S. is not related to getting to or from work. The 2017 NHTS found that only 23% of trips were commutes. Yet before the pandemic, the highest-ridership American transit systems received a disproportionate share of their ridership from commutes. In the six metro areas with the highest transit mode shares, between 49% and 61% of public transit trips were to or from work (see Figure 2).
There was substantially more variation among large metro areas with lower transit mode share. Between 50% and 60% of transit trips in Tampa, Fla. and Denver were to or from work, compared to only between 20% and 25% in Baltimore and Riverside, Calif. The large share of public transit trips in high-mode-share metro areas that were to or from work before the pandemic made the rise of remote work and decrease in commuting a particular challenge for these metro areas’ transit networks, which stood to lose an especially large share of their ridership.
Remote work remains high in metro areas where pre-pandemic transit ridership was high
The COVID-19 pandemic led to a spike in remote work that has not returned to pre-pandemic levels. The American Time Use Survey shows that from 2019 to 2022, the number of Americans working from home increased by 40%. In 2019, 24% of employed persons did some or all of their work at home; this rose to 38% in 2021, and declined only slightly to 34% in 2022.2
Remote workers are not evenly distributed. While 34% of all workers did some or all work at home in 2022, the share was 54% for workers with bachelor’s degrees. Meanwhile, jobs in industries such as manufacturing, logistics, health care, retail, and hospitality largely cannot be performed remotely.
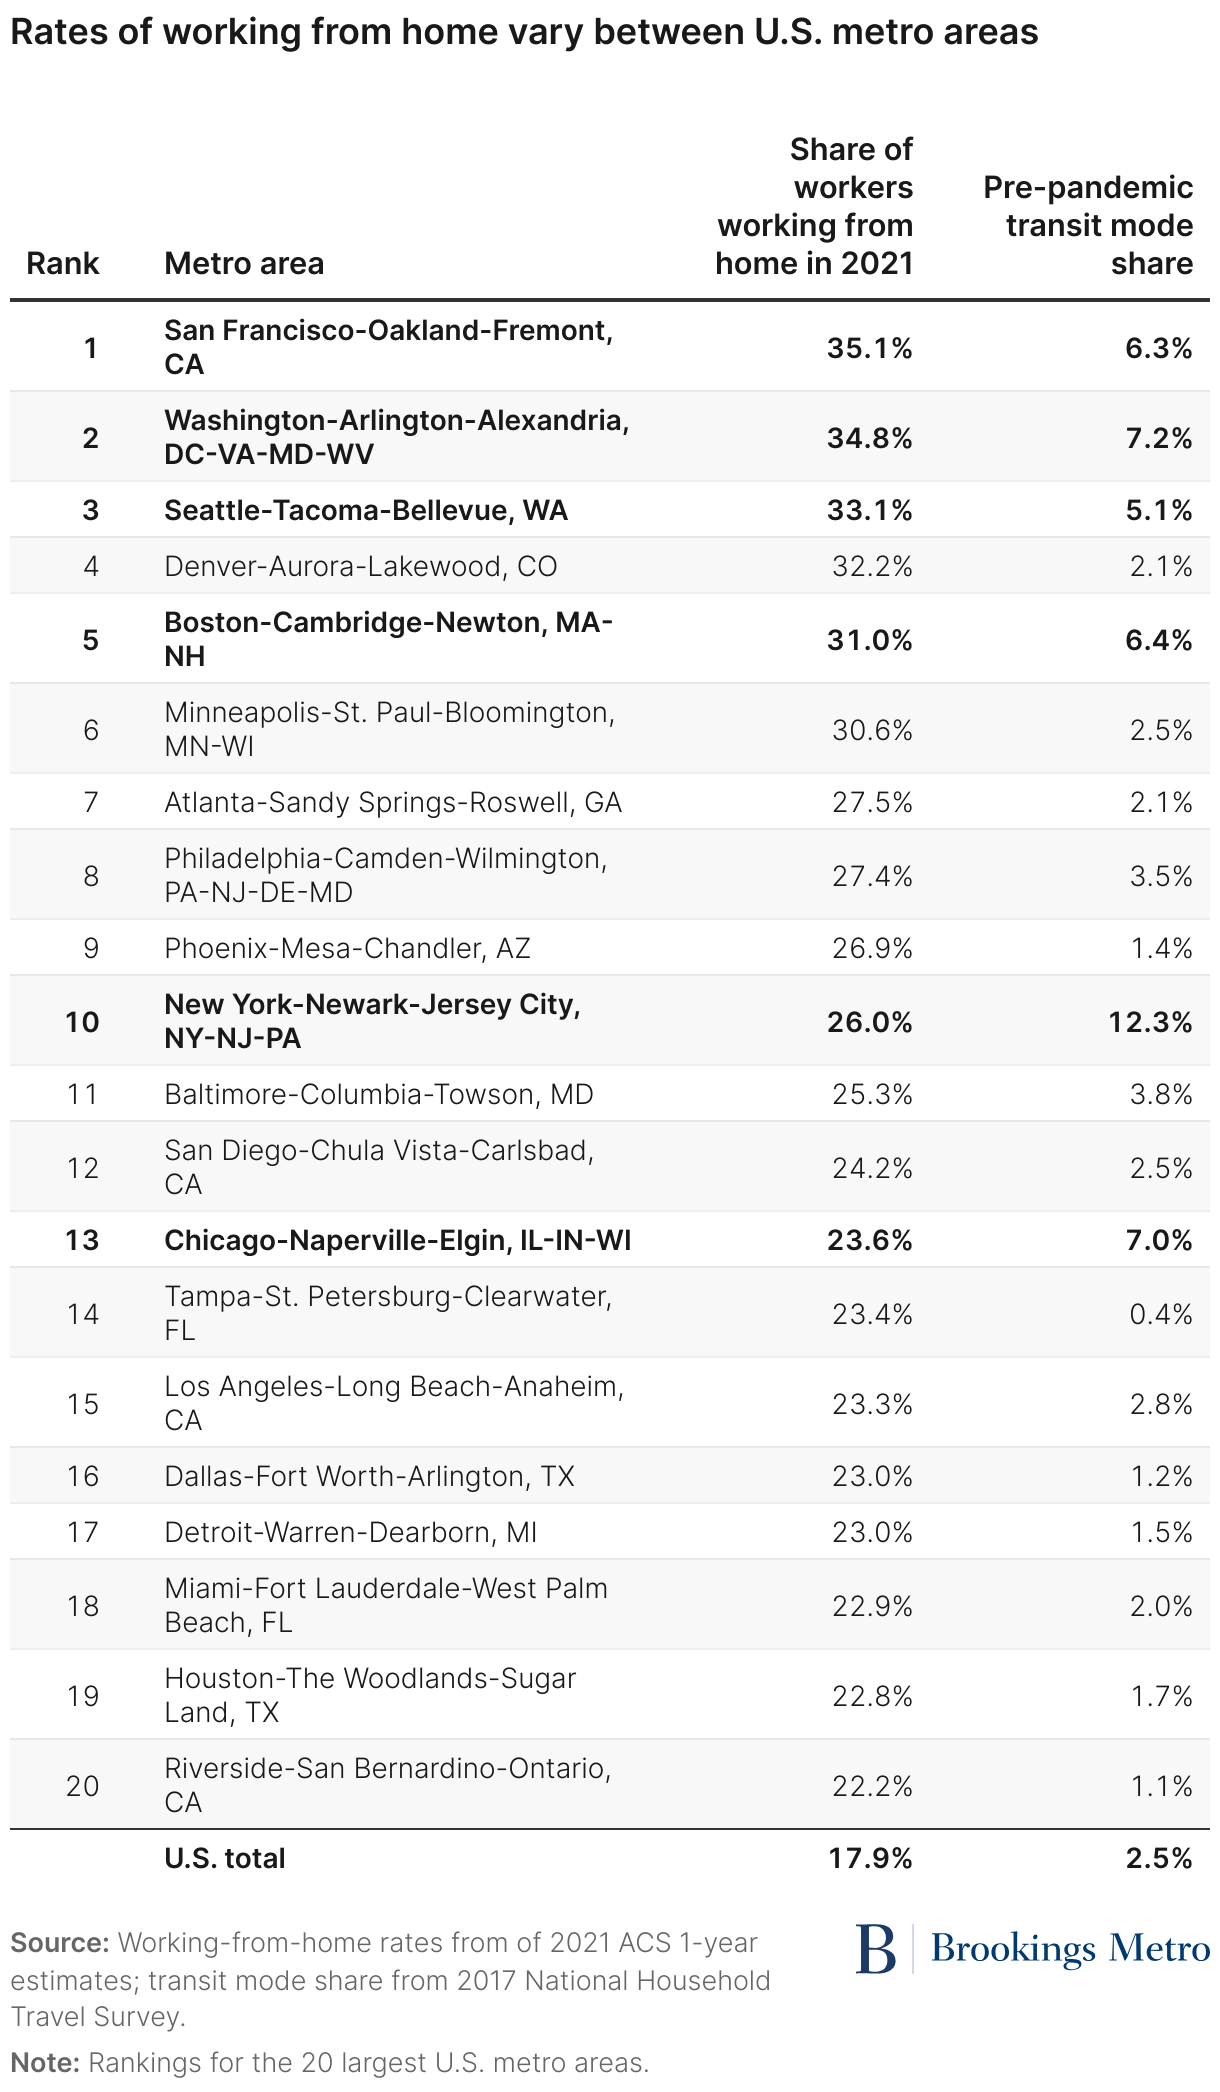
While the American Time Use Survey is not available by metro area, one-year estimates from the American Community Survey (ACS) can give us a sense of the geographic differences in remote work. In 2019, 6% of ACS respondents said that they “usually” worked from home; by 2021 (the most recent data available), this number had tripled, to 18%. Table 1 illustrates regional variation in rates of working from home for the top 20 U.S. metro areas by population. The top U.S. metro area for remote work—San Francisco—has a work-from-home rate of 35%, compared to the national rate of 18%. In other words, the San Francisco metro area’s telework level is almost double the national level. Of these 20 largest U.S. metro areas, both the highest and lowest telework levels are California metro areas: San Francisco and Riverside.
The metro areas with higher rates of working from home overlap with the metro areas with the highest pre-pandemic transit mode share (also shown in Table 1, emphasized in bold). However, this is not necessarily because there is a significant relationship between transit commutes and working from home.3 Another common factor between these metro areas is tech jobs: Five of the six high-ridership metro areas (all except Chicago) are tech industry “superstars,” and four of those five superstars also have some of the highest shares of remote workers in the country. This is consistent with other survey research finding that working from home is more prevalent in the information sector (which includes part of tech) than in any other sector.
The pandemic made demand for transit more continuous across the service day and week
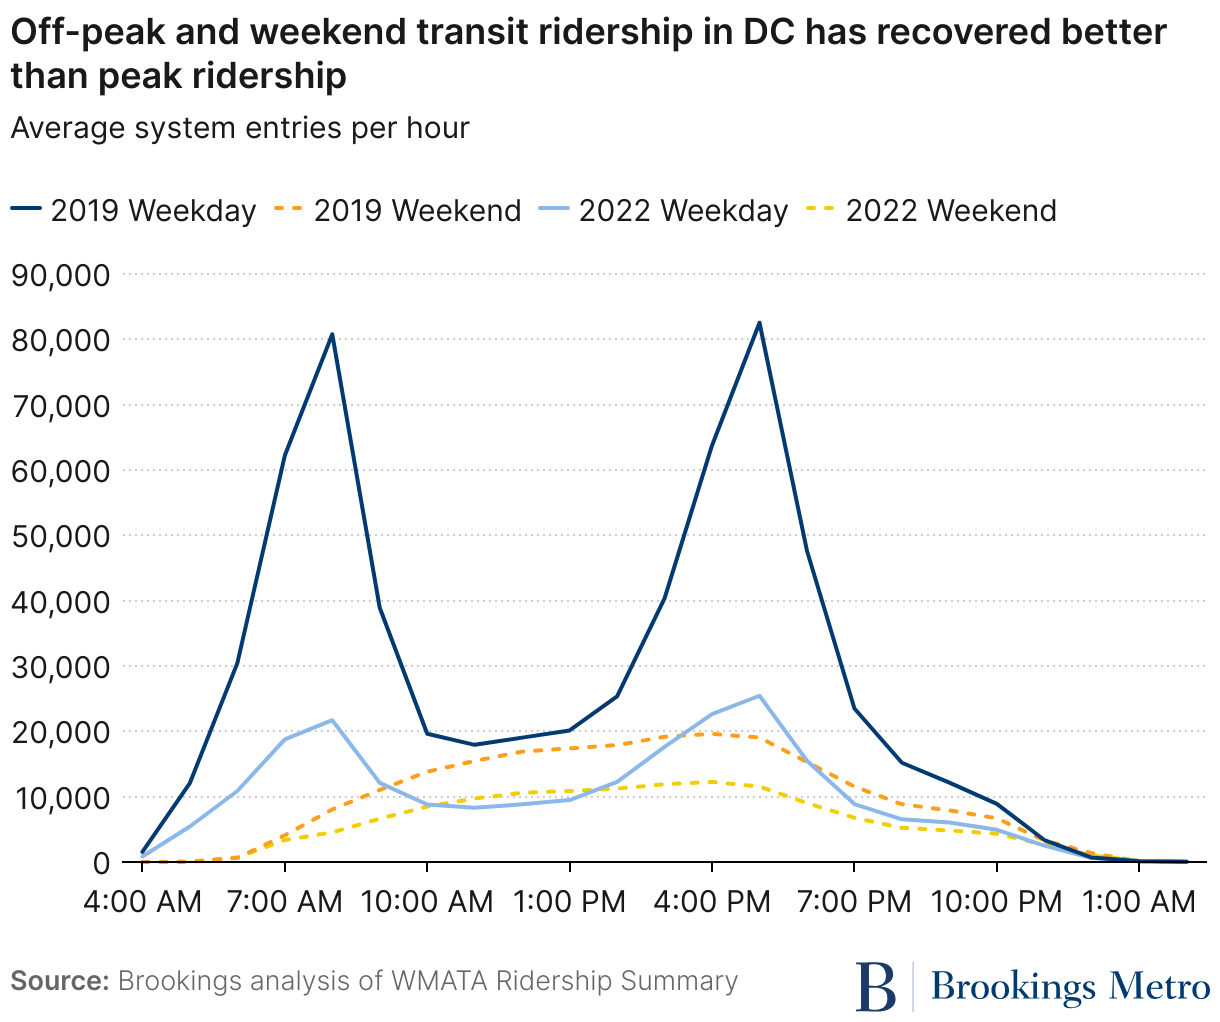
The rise of telework and reduction of workers commuting to downtown offices caused substantial decreases in transit ridership across U.S. transit systems. For example, before the pandemic, 80% of riders on the Washington, D.C. Metrorail system were commuting to or from work, compared to only 65% in spring 2022. When combined with the 47% drop in Metrorail ridership since 2019, this suggests that non-commute ridership has reached over 90% of pre-pandemic levels, while commute ridership is roughly 43% of pre-pandemic levels.4
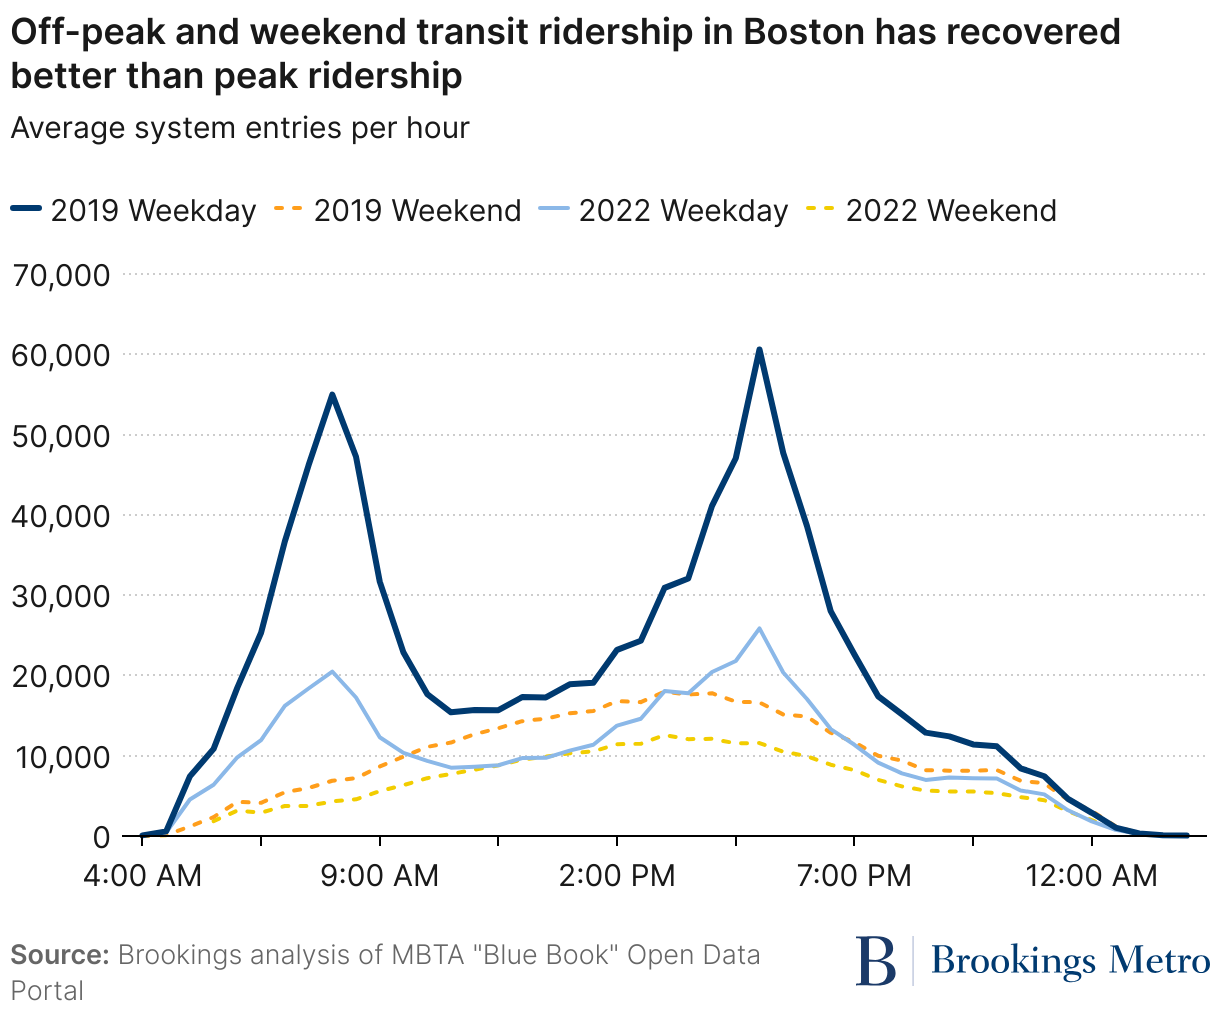
Consistent with this inference, ridership data reveals that the drop in ridership is not uniform across the service day and week. Rather, ridership during weekday peak commuting times has dropped much more substantially than ridership at mid-day, in evenings, and on weekends. The case of Boston’s subway, shown in Figure 3a, is representative: Ridership during the morning and evening commute peaks in 2022 was roughly 40% of its 2019 level, while ridership at noon on weekdays was 56%, ridership at 10 p.m. was 64%, and weekend ridership was 68% of 2019 levels. Likewise, in Washington, D.C. (Figure 3b), Metrorail ridership during the morning and evening commute peaks in 2022 was roughly 30% of its 2019 level, while ridership at noon on weekdays was 46%, ridership at 10 p.m. was 55%, and weekend ridership was 62% of 2019 levels.
Transit ridership has become less “peaky” outside the U.S. as well. A number of European and Australian cities are still experiencing substantial reductions in peak ridership relative to midday and weekend ridership, despite overall ridership recoveries better than what most U.S. metro areas have seen.
Today’s much less peaky time distribution of transit ridership has potential benefits for transit agencies. The extra service that transit agencies run during peak ridership periods is extremely inefficient compared to all-day base service, due to both capital and operations costs. A substantial share of transit vehicles—41% in the case of BART railcars in pre-pandemic San Francisco—are only needed for peak service. Furthermore, providing peak service requires split shifts, in which bus and train operators are assigned morning and evening hours, with a large gap in the afternoon. Labor laws in some states require extra pay for split shifts, and these shifts can increase on-the-job sleepiness as well as general worker stress and fatigue. In addition, since peak travel tends to be unidirectional—either to or from downtown, but not both at the same time—only half of the vehicles in operation during peak hours are carrying most of the riders.
Downtowns and transit still represent a mutually beneficial relationship
Even with more workers working remotely some or all of the time, offices are not “over.” Major downtowns—being the densest job clusters in their metro areas—will continue to provide the proximity between workers and firms that helps increase economic productivity and innovation. Furthermore, downtowns are not solely for office workers; they are often also home to concentrations of bars, restaurants, hotels, museums, specialty retail, and housing—uses that will have room to expand if the need for downtown office space declines.
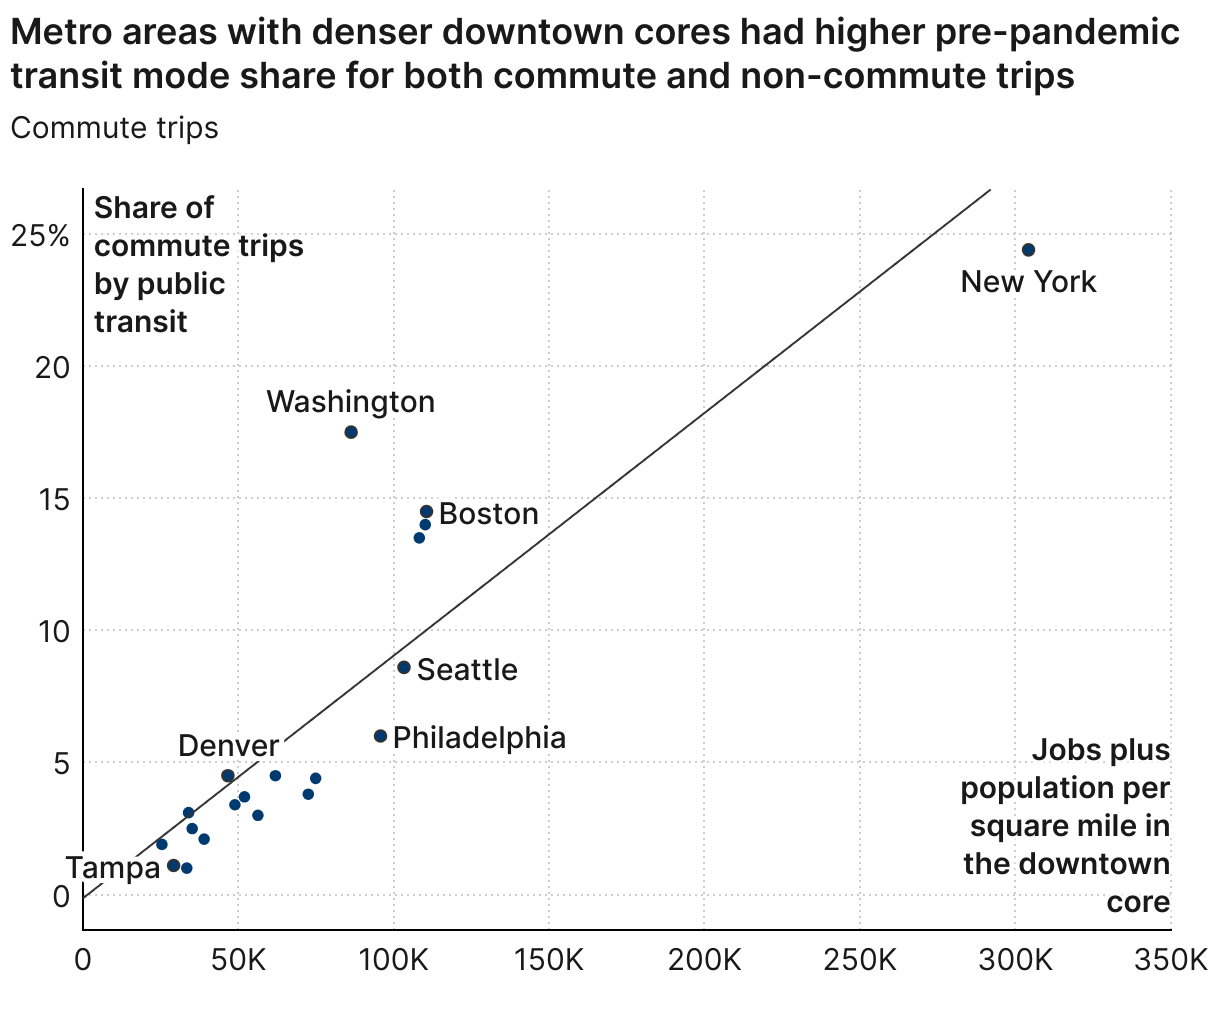
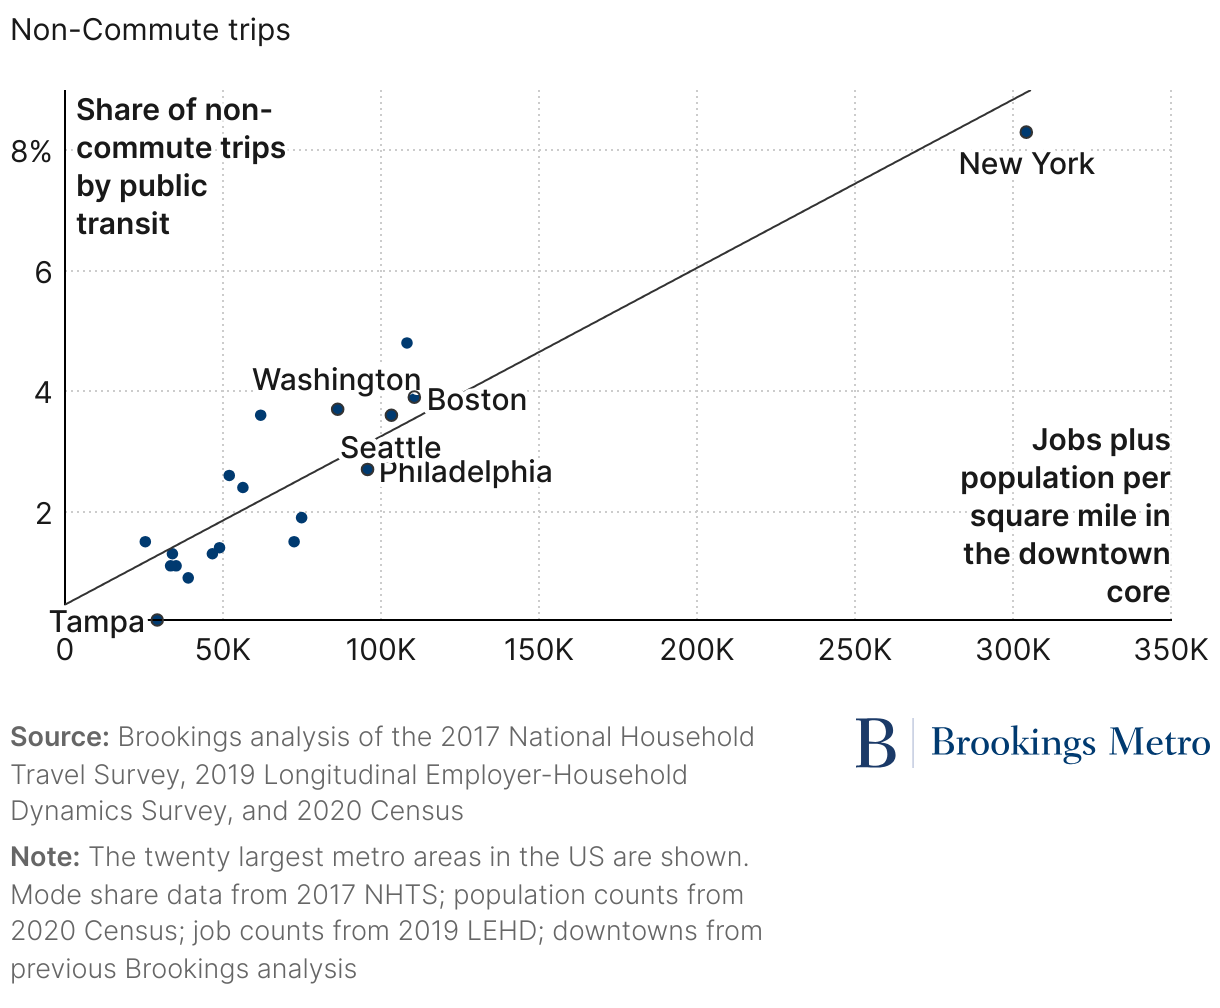
Dense, multi-use downtowns anchor transit ridership at a metro area level by generating a large number of trips (both commutes and non-commutes) to a small area—the sort of demand that fixed-route transit serves best. As seen in Figure 4, among the 20 largest U.S. metro areas, downtown density correlates with the metro area share of pre-pandemic commute and non-commute public transit trips. While downtown density is clearly not the only factor driving transit ridership in high-mode-share metro areas, it seems evident that it plays a role, especially since these metro areas’ transit networks—and especially rail lines—are generally optimized for trips to downtown.
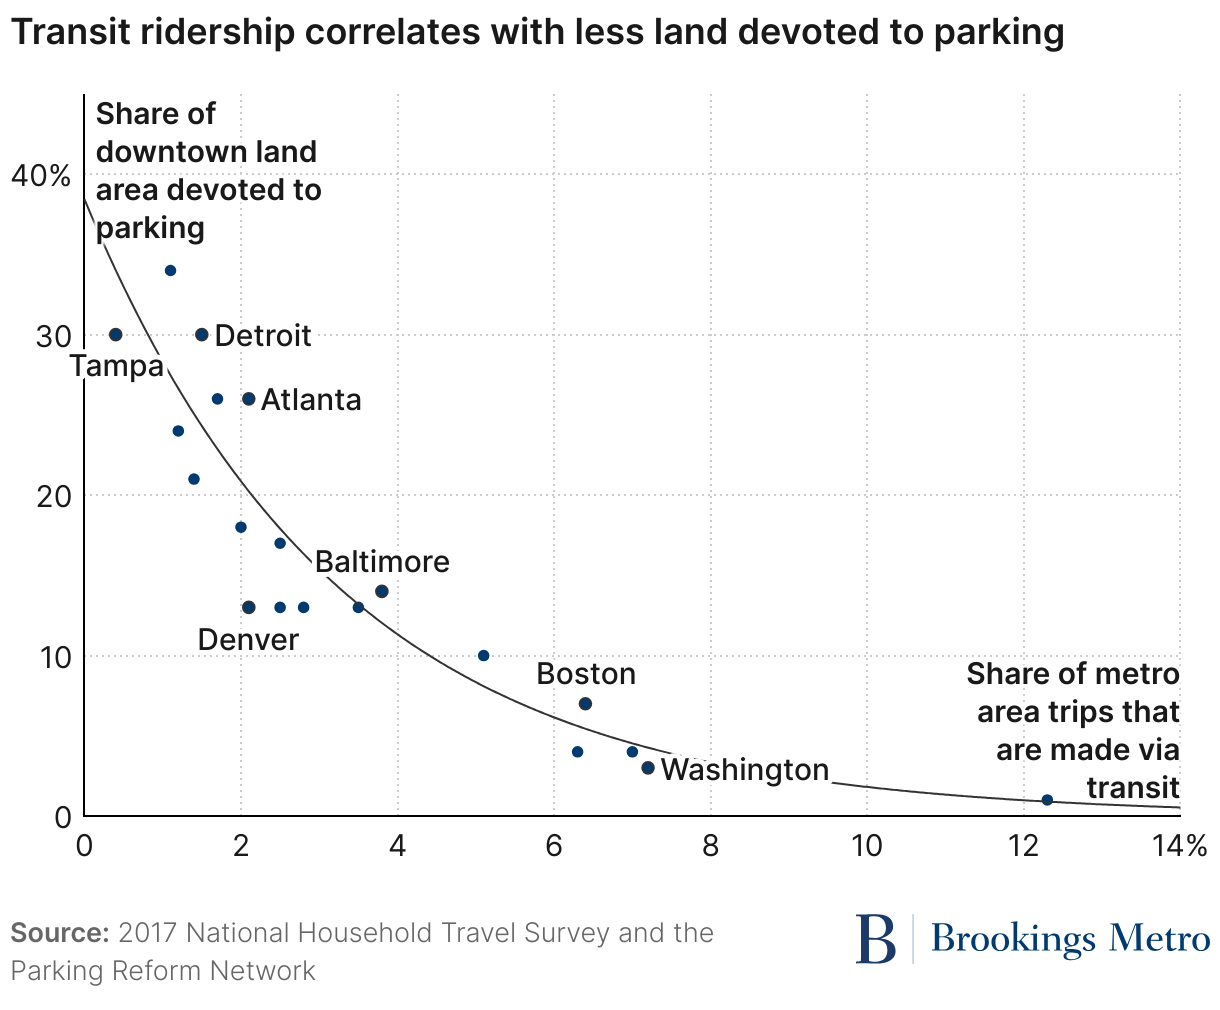
Nor is the causation necessarily one-way. Dense downtowns are not only good for transit, they need transit, because providing enough road space and parking for everyone to arrive by car cannot scale the density that makes downtowns flourish. As the Parking Reform Network recently showed, on average, 20% of land area in U.S. downtowns is dedicated to parking. Using a large share of what is usually the most expensive real estate in a metro area for car storage isn’t ideal, but without a functional regional transit network, it is essentially unavoidable. When public transportation provides a viable alternative to driving, the market devotes much less space to parking, and more space to higher-value land uses. The six major downtowns the Parking Reform Network identified as devoting 10% or less of their land area to parking (New York, Washington, D.C., Chicago, San Francisco, Boston, and Seattle) are the primary downtowns of the same six major metro areas that had an overall transit mode share greater than 5% according to the 2017 NHTS.
Dense downtowns concentrate and create tremendous real estate and economic value through agglomeration, but we believe that they cannot reach their full potential without a reliable and effective public transportation network to keep them from being choked by parking and traffic. Downtowns will continue to be important destinations for transit even as they transition from being dominated by offices to having a more diverse mix of uses. However, effective public transportation networks cannot be designed around downtown trips alone if they are to compete in metro areas where no single destination is completely dominant.
Bus ridership has recovered faster than urban rail, because of who uses it
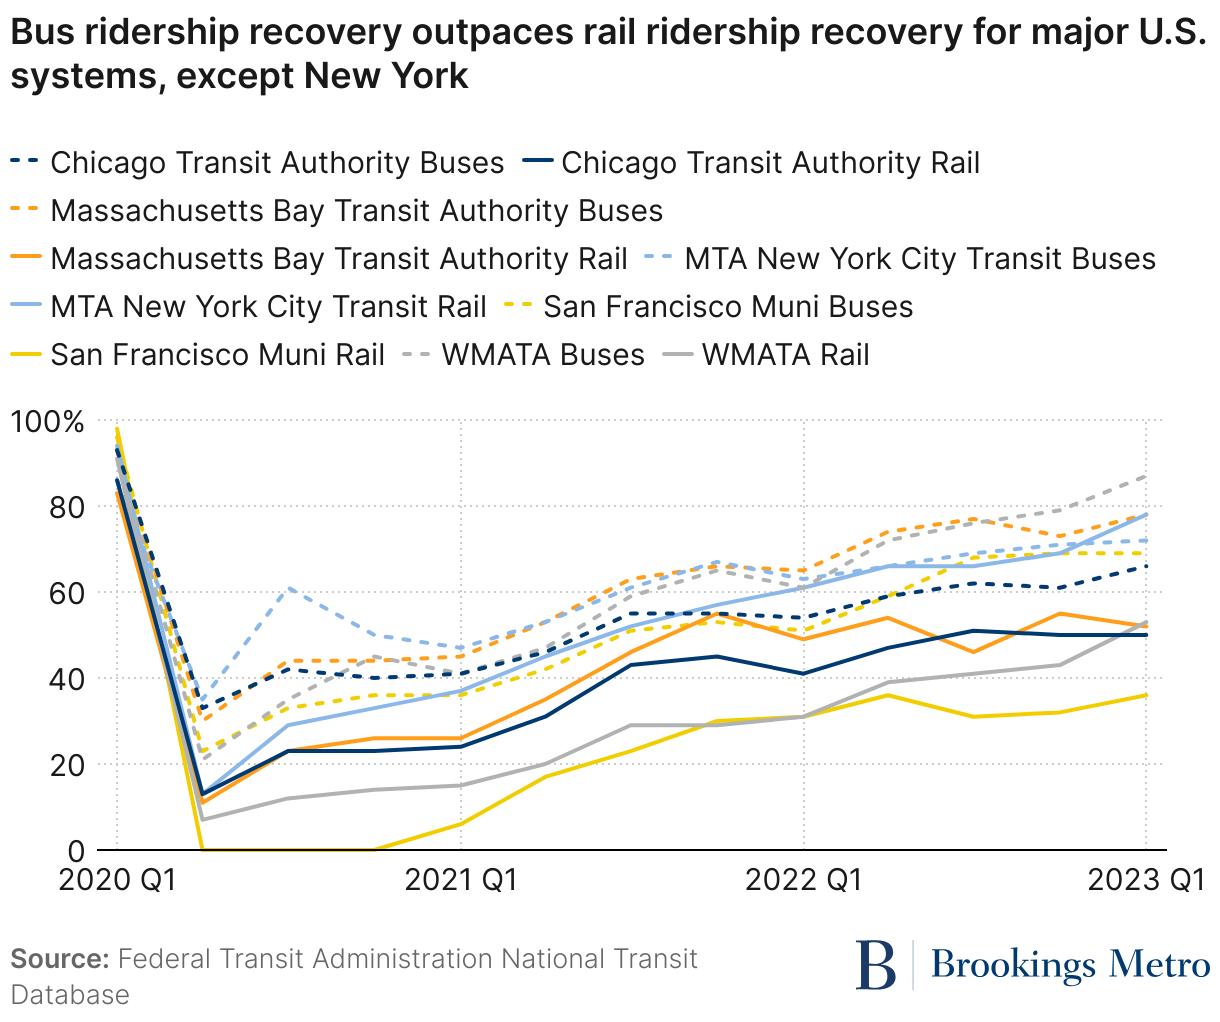
While transit ridership in high-ridership metro areas has not yet recovered to its pre-pandemic peaks, bus ridership has generally recovered faster than subway and light rail ridership. As seen in Figure 6, ridership on urban core bus networks in four of the five highest-mode-share metro areas (Boston, Chicago, San Francisco, and Washington, D.C.) was 20 to 30 percentage points higher as a share of 2019 levels than ridership on rail systems serving those cores. Only in New York, with its extensive subway system, has rail ridership recovered to the same level as bus ridership.
The situation in Seattle, the metro area with the sixth-highest transit mode share, is more complicated due to a significant expansion of the Link light rail in the urban core during the pandemic. Before the extension opened, Seattle was showing the same pattern of bus ridership recovering faster than rail, but the extension and associated changes to bus routes led to a substantial shift of bus passengers to rail.
Bus ridership has generally recovered better than rail in high-ridership metro areas because of who—and what sort of trips—buses serve. Buses serve both downtown and crosstown circumferential trips between areas outside of downtown, as well as connecting rail stations to areas beyond station walksheds. This means they play an essential role for non-commute trips as well as for the commutes of service workers and others whose jobs are both less likely to be located downtown and less amenable to remote work. In addition, bus riders tend to have lower incomes than rail riders, and ridership has dropped substantially less for low-income groups and populations of color. Several cities have ceased fare collection on buses either temporarily or permanently as well.
Subway and light rail systems in the U.S. are almost invariably designed around trips to downtown cores, with radial lines that often extend to suburban park-and-ride stations converging in the main central business district of a metro area. These rail lines effectively serve trips to downtown, but are less useful for circumferential trips between non-downtown locations, so their ridership is particularly dependent on commute trips by downtown workers, who are more likely to use remote work options.
Activity centers and post-pandemic travel data can guide transit investment
As mass transit adapts to a world of widespread remote work, this report’s analysis has thus far illustrated the significant new trends in how ridership is distributed across times of day, days of week, and modes, with implications for service planning and operations. However, there have also been significant geographic shifts in travel demand within regions, which are more complex to understand and adapt to. Convincing leaders and the public of the potential benefits of investing in reorganizing major transit systems to better serve post-pandemic demand will require both up-to-date travel data and a new understanding of what sorts of trips to serve—and where.
In our previous work on activity centers, we found a clear positive association between demand for non-car commute trips and residential proximity to activity centers. However, activity centers are not just job hubs—they are clusters of economic, consumption, community, institutional, and tourism assets, and contain a high concentration of regional assets and activity. A holistic look at total travel demand—not just work trips—shows that even with the rise of remote work, people still want to go to places that are servable by transit.
Using 2022 data from digital tracking technologies, we explored how demand for travel has shifted within regions since 2019 in the top six U.S. metro areas for transit mode share (see Table 2). Examining the case of the Washington, D.C. metro area in detail, we found that overall, demand for regional mobility is greater than ever: Total trips increased 11% between 2019 and 2022. Yet two aspects of this growth are challenging from a transit perspective. First, the vast majority of this growth (91%) occurred outside of activity centers. Second, 27% of activity centers experienced a net decline in trips. However, it is also the case that a clear majority (73%) of activity centers had stable or increasing trips. In the latter case, just 4% of the region’s block groups concentrated 9% of the increase in trips.
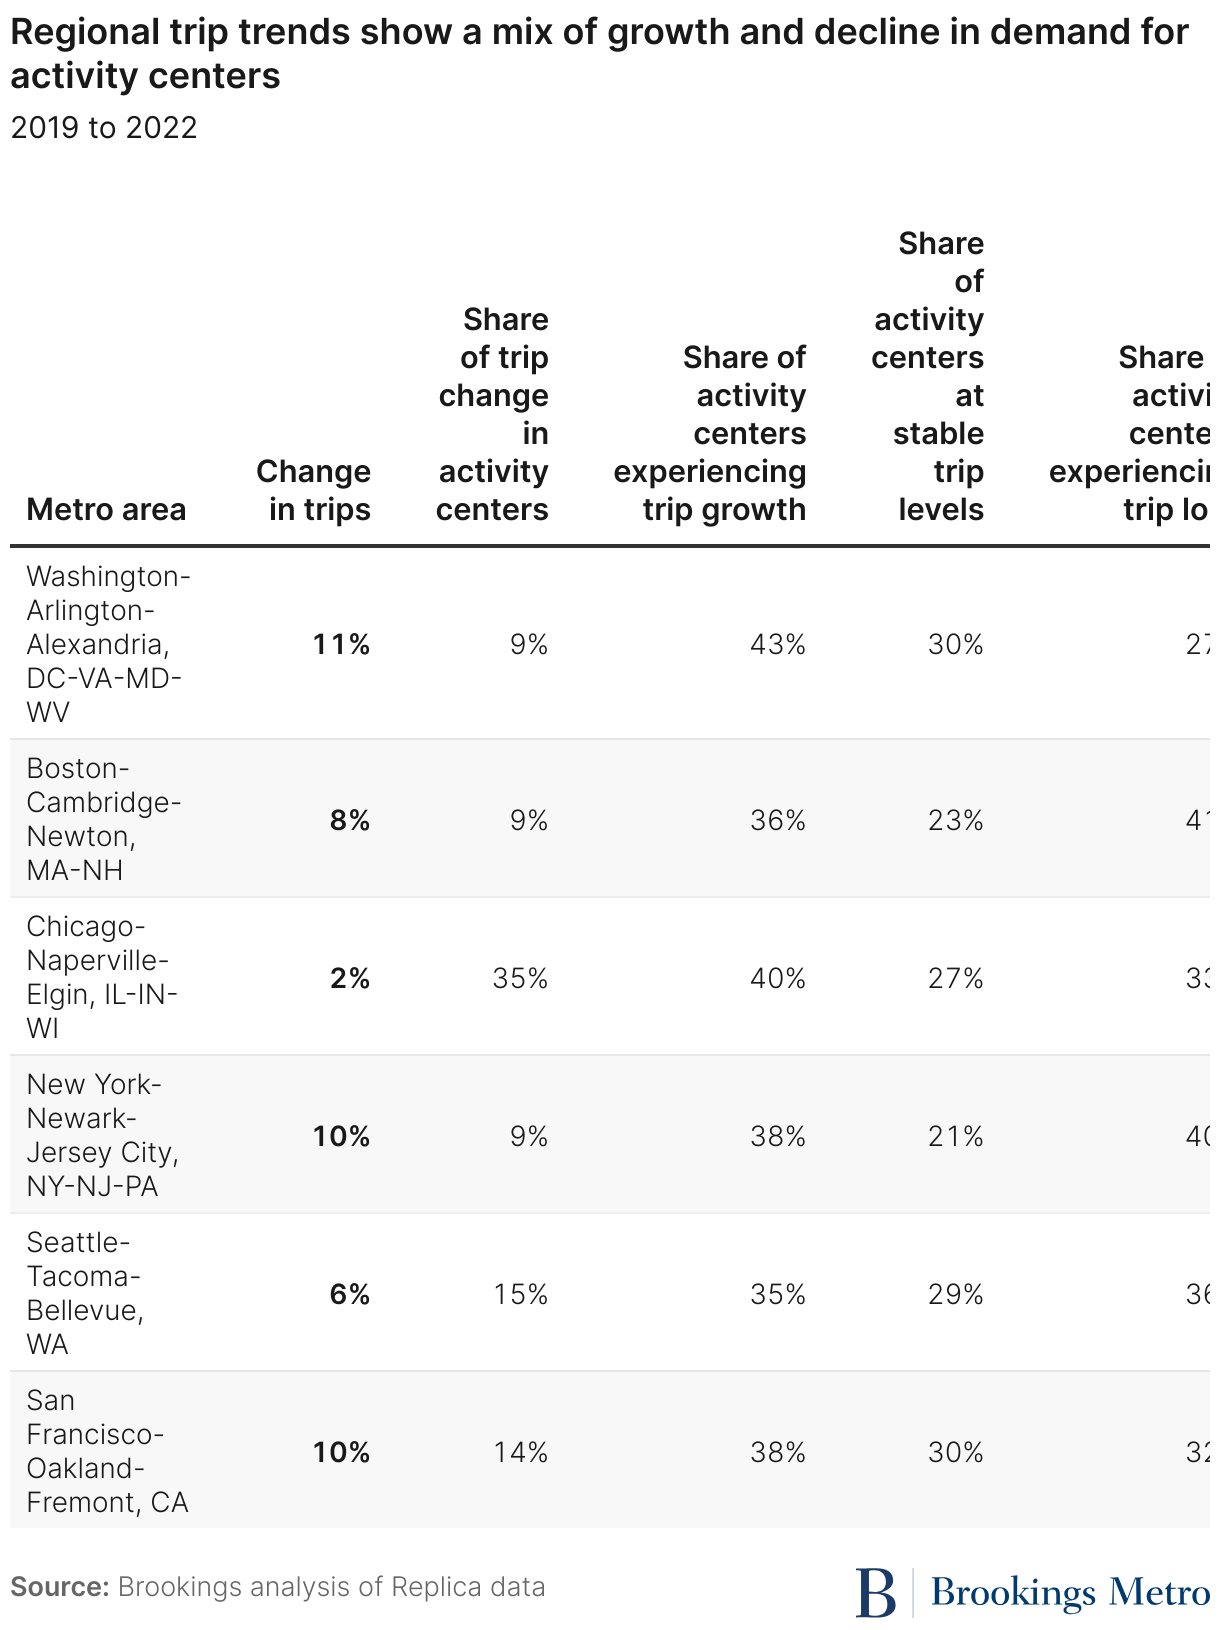
While many downtowns have seen a major decline in trips, people are still making trips to other activity centers. These activity centers are found in both the urban core and suburban jurisdictions. In fact, in the Washington, D.C. metro area, most (66%) of the activity centers experiencing trip growth are in the suburbs that surround the District of Columbia, such as Largo in Prince George’s County, Md.; the Clarendon area in Arlington County, Va.; and the city of Falls Church, Va. The shifts and disruptions of the COVID-19 pandemic and beyond mean that today, the dense, mixed-use areas most amenable to transit service are found in both cities and suburbs. The future of transit is no longer a strictly urban issue.
Recommendations
There is a future for mass transit. Much like airline travel, transit ridership numbers across regions have not plateaued, and continue to grow. Statements that reductions in ridership are “permanent” are hyperbolic and unsupported by evidence. In fact, while some major transit destinations (such as downtowns) have seen a decrease in trips, others have seen a concentrated increase—which is a recipe for traffic absent a mass transit solution.
Adapting to the sticky changes that COVID-19 has made to American commuting patterns—and to the broader changes to U.S. economic geography over the past several decades—is a challenge for transit agencies, but not an insurmountable one. Higher-quality and better-integrated transit service connecting activity centers throughout major metro areas has the potential to produce high ridership not tied to office commutes. Developing networks of frequent, all-day bus routes that connect communities beyond downtown is not a new idea; such networks have long been present in Canadian metro areas as well as in Europe, and play a role in the significantly higher transit mode share in Canadian metro areas than in comparable U.S. metro areas.
However, creating such networks in U.S. metro areas will require political will and stable sources of funding. Transit agencies are currently facing fiscal cliffs due to inflation, underfunding, and reduced ridership as pandemic-era federal subsidies run out. State and local governments need to work with transit providers to find funding for restructured, high-quality service rather than allowing funding shortfalls to lead to service cuts that endanger the ridership recovery that has already occurred. Furthermore, funding must be used efficiently to provide service when, where, and of a type that will be most useful to riders. What follows are our recommendations for doing so:
Establish dedicated, long-term funding mechanisms tied to the economic and environmental value that transit systems help create. An open-ended federal bailout for regional transit operations is politically unlikely. And the size of regional transit deficits is staggering—they range from hundreds of millions to billions of dollars annually. It will not be possible for transit agencies to fix these deficits on their own through service cuts or fare hikes without triggering a “death spiral,” in which low ridership leads to service cuts that further reduce ridership, as more and more riders abandon the system due to cost or poor quality. Cities and regions must raise new revenue in order to sustain transit. However, given the size of the dollar amounts involved (and the basic fact that the average American takes zero transit trips in a given year), the political challenge is profound. The emergence of activity centers in the suburbs of U.S. metro areas is both an economic reality and a political boon for transit systems, which can now create value for suburban jurisdictions beyond providing a connection to the regional center. Creative revenue tools such as special tax districts, congestion pricing, dynamic parking pricing, carbon pricing, and parking taxes can help price car use in metropolitan areas accurately and support transit operations.
Continue to measure and plan for the importance of transit access to jobs as a matter of economic equity. While this report has emphasized the importance of non-work travel to the future of transit, commute trips are uniquely transit-friendly for several reasons, including frequency, schedule, and because employment—especially office employment—is a very dense land use. Transit access to jobs is particularly important for lower-income workers, who are less likely to own cars but whose jobs are paradoxically less likely to be well served by transit. Transit agencies can’t solve this paradox on their own, but they can measure it and optimize service for transit-dependent communities.
Promote transit-oriented development. State and local jurisdictions can recover some of the capital and operating costs of transit through property tax revenue by maximizing the development potential of land near transit facilities and/or in transit-ready areas. California’s recent Affordable Housing and High Road Jobs Act addresses both surplus commercial real estate and the need for affordable housing near transit in a single stroke. Chicago’s Connected Communities Ordinance advances equitable transit-oriented development by reducing parking requirements, incentivizing affordable housing, and investing in traffic safety. Montgomery County, Md.’s More Housing at Metrorail Stations Act solves for the higher upfront cost of truly dense development. There is a robust evidence base that such planning and zoning practices reduce automobile dependency through the use of higher densities with mixed land uses, well-connected street networks, and the concentration of jobs and retail in activity centers.
Transit service should be designed to connect activity centers to each other. Transit systems need to provide viable options for trips throughout the transit-ready area of their metro areas, rather than focusing solely on trips to downtown. While rail routes are largely fixed, bus services should be restructured to provide connectivity between major activity centers outside of downtown. Circumferential routes that connect locations outside of downtown are essential to reflect modern American economic geography.
Reliability and frequency are essential for attracting riders. Buses run on existing roads that can get paralyzed by traffic. Instead of paying for operators and vehicles to get stuck, jurisdictions should invest in “bus priority” infrastructure such as dedicated lanes and signals, which improves reliability and, ultimately, ridership. In addition, service headways should be chosen to make riding convenient, not solely to avoid overcrowding. Unlike the “coverage” routes that many transit agencies use to provide minimal service to a broad area, service needs to be frequent enough (ideally with headways of 10 minutes or less) that riders can count on a short wait for their return trip. This also makes transit much more practical for “trip-chaining,” in which multiple destinations are combined into one journey—something particularly important for non-commute trips, such as the care trips that are mostly made by women.
If a service is worth running, it is worth running all day, every day. As the commute peak becomes less important, resources should be shifted from expensive peak-only service to service over the whole operating day, including weekends. While cutting peak-only routes will have costs for communities outside transit-ready areas, limited resources will provide a greater benefit in transit-ready areas where residents can make most of their daily trips by transit, instead of only using it for commutes.
Clockface scheduling can improve the usability of moderate-frequency routes. While high-frequency, all-day service is the gold standard for convenient transit service, it isn’t possible everywhere. Outlying routes that provide essential service to low-income populations outside transit-ready areas and commuter rail lines—even when they connect to transit-ready areas—often have more limited headways. When this is necessary, clockface schedules—with service every hour, half-hour, or 20 minutes throughout the service day—make the system more reliable and convenient, while also allowing for timed transfers.
Fare disparities between buses and rail are inequitable and should be eliminated. Some metro areas, including Boston and Chicago, charge more for urban rail than local buses; in others, such as San Francisco and New York, local rail and bus trips cost the same. While rail usually provides higher-quality service, it also has lower marginal costs per rider, and charging more for it perpetuates a two-tier transit system in which downtown commuters are more valued while lower-income riders are encouraged to avoid rail. In metro areas where commuter rail or bus lines connect outlying transit-ready areas to urban cores, these routes should also be priced competitively with local transit, rather than being treated as exclusive luxury services for well-heeled commuters.
Transfers should be free, ideally even between agencies. Serving all travel within the transit-ready area rather than just focusing on trips downtown means that transfers between vehicles—and sometimes between transit agencies—will be essential for users of post-Covid transit networks. However, transfers are fundamentally for the benefit of the transit agency—which cannot run high-frequency routes between every possible pair of destinations—not the passenger, so it is inappropriate to charge for them. In metro areas with multiple agencies providing urban bus service and where bus and rail are provided by different agencies (such as San Francisco, Seattle, and Washington, D.C.), interagency agreements to allow free transfers will increase the overall effectiveness of the system.
Conclusion
Local leaders should keep in mind that higher initial subsidies for transit and supportive land uses are an investment in changing the lived environment. Ensuring a vibrant future for transit will initially require higher subsidies, but it can change how residents travel, providing higher ridership in the future. Mass transit is a critical, irreplaceable solution to the looming threat of climate change and the ever-present torture of traffic.
Authors

-
Acknowledgements and disclosures
The authors thank Adie Tomer and Yonah Freemark for their insightful reviews of earlier drafts of this report. Any errors that remain are solely those of the authors.
Tracy Hadden Loh currently serves as a principal director on the board of the Washington Metropolitan Area Transit Authority, a voluntary position in which she represents Washington, D.C. via appointment by the Council of the District of Columbia. The recommendations of this report are solely those of the authors written in their capacity as employees of the Brookings Institution, and do not represent policy or opinions of the WMATA board of directors or staff.
-
Footnotes
- While data is provided in the National Household Travel Survey for all metro areas with at least 1 million residents in 2017, only the largest metro areas had enough transit trips to break them down into commute and non-commute trips for this analysis.
- Data from 2019, 2021, and 2022 American Time Use Survey summaries.
- Preliminary research from Chapple et. al. suggests that total commute length in terms of time is a better explanatory variable.
- Pre-pandemic Metrorail ridership was 80% commute and 20% non-commute. Current ridership is at 53% of pre-pandemic levels, and is 65% commute and 35% non-commute. Total Metrorail ridership is 53% of its pre-pandemic level. We can calculate the commute and non-commute ridership recovery as follows: If R is the total 2019 Metrorail ridership, then commute ridership in 2019 was 0.8R and non-commute ridership was 0.2R. Total current ridership is 0.53R. Current commute ridership is (0.65)(0.53)R and current non-commute ridership is (0.35)(0.53)R. This means that commute ridership recovery is (0.65)(0.53)R / (0.8R) = 43%, and non-commute ridership recovery is (0.35)(0.53)R / (0.2R) = 93%.
The Brookings Institution is committed to quality, independence, and impact.
We are supported by a diverse array of funders. In line with our values and policies, each Brookings publication represents the sole views of its author(s).