
Abstract
The opportunities and challenges facing young adults in the “decisive decade” — between the ages of 14 and 24 — shape their long-term health, family, education, and work outcomes. Young adults face a myriad of firsts and opportunities: making independent decisions; landing a job; navigating adult relationships; having children; and attending school. These factors set the stage for their future opportunities. At the same time, this period is also marked by widening opportunity gaps by race, class, and gender as young people face varying levels of support and access to resources that can enable or impede their progress. This report provides a snapshot of how young adults are faring in the decisive decade and highlights the need for continued attention and investment in this critical period of life. By identifying key indicators of success and disparities, we hope to inform policy efforts aiming to improve young adults’ opportunity.
What is the decisive decade?
The opportunities and challenges facing young adults between the ages of 14 and 24 shape their long-term health, family, education, and work outcomes. Young adults face a myriad of firsts and opportunities: making independent decisions; landing a job; navigating adult relationships; having children; and attending school. These factors set the stage for their future opportunities. At the same time, this period is also marked by widening opportunity gaps by race, class, and gender as young people face varying levels of support and access to resources that can enable or impede their progress.
At the start of the decade, academic outcomes start to really matter. For example, 9th grade GPA is related to high school graduation and college enrollment, according to a study by the University of Chicago Consortium on School Research. (This study, like many others, also finds that GPA is a stronger predictor of later outcomes than test scores).
But there is also some evidence that the trajectories of children and young adults up to around the age of 24 are crucial for subsequent outcomes. For example, studies of children and young adults who move to a higher-opportunity community find a positive impact on later upward mobility and other outcomes if the move takes place before the age of 24. Similarly, the relationship between the incomes of parents and the incomes of their children (on becoming adults) stabilizes from the mid-20s onwards.
This means ages 14 to 24 are crucial; for long-run outcomes, this is the decisive decade. For instance, young adults who are neither working nor in school have worse outcomes when they reach midlife. Even a temporary disadvantage in the labor market during young adulthood is associated with lower earnings, worse health, and reduced likelihood of forming a family later in life. Similarly, when and with whom a young adult decides to form a family affects their well-being; mothers who give birth at a young age tend to have worse economic and psychological well-being later in life.
By examining young adults’ educational, work, and family trajectories, we can gain insight into the opportunities and obstacles in the transition. This report lays the groundwork for policymakers interested in supporting young adults as they navigate a critical period and provides additional context for how and when young adults are underserved.
In this paper, we focus on four key indicators of being “on track” for 14-24-year-olds:
- enrolled in 9th grade (for the first time) with an academic GPA of 2.0 or higher
- graduating high school on time with a 2.0 or higher
- enrolled in college or working full time about three years after expected high school graduation
- working full time, enrolled full time, or both at least part time at age 24.
These indicators are not intended to be comprehensive measures of success or essential markers of being “on track,” but they do provide a starting point for understanding key aspects of young adult life. We analyze young adults’ trajectories longitudinally when possible, and discuss many outcomes related to young adults’ educational attainment, work engagement, and family formation.
This period of life has long been seen as a turbulent one. As the Old Shepherd in Shakespeare’s The Winter’s Tale laments:
“I would there were no age between ten and three-and-twenty, or that youth would sleep out the rest; for there is nothing in the between but getting wenches with child, wronging the ancientry, stealing, fighting…”
But these years are not only potential times of trouble, but of extraordinary growth and opportunity, the years in which we literally “come of age.” How we navigate these ten years — the opportunities we are offered and the obstacles we face — will shape the rest of our life. These are years that really count: nothing less than the decisive decade.
What do we already know?
There is, of course, a large literature examining trends and outcomes during the decisive decade, across a wide range of domains including education, employment, family formation, income and earnings, and housing. Some of this work focuses on specific time periods, for example the high school years, or early adulthood (18-24). Other work examines key transitions, for example high school graduation, college enrollment, college completion, or starting a family. Here we aim sketch some of this very broad terrain across education, work, and living arrangements/family formation.
Education
The high school years
A large body of research focuses on trajectories through high school including the importance of GPA at various stages, differential risk of expulsion or suspension, rates of on-time graduation, as well as overall graduation. There is a strong emphasis, too, on the importance of school quality or type, impact of teacher quality, school funding mechanisms, school choice, and much more. There is an appropriate emphasis in the high school literature on educational disparities, by race, gender and class. The bottom line of this research is not surprising: the high school years count for a very great deal in terms not only of subsequent education and economic outcomes, but in terms of mental and physical health.
Some of the good news here includes a significant narrowing of race gaps in high school graduation and very sharp reductions in teen pregnancy. On the other hand, there remain very wide gaps especially by race and class in key outcomes including test scores and GPA. There are also wide gaps by race and by gender in on-time high school graduation (e.g., within four years of enrolling); troubling signs of worsening mental health; and evidence for a widening class gap in rates of obesity among adolescents.
College enrollment and completion
Research also shows the sizable benefits of attending, and especially graduating from, college. In addition to having better labor market prospects later in life, college graduates are healthier, less likely to be divorced or separated, and more likely to report being “happy about life overall” than their peers. Those who attend college but don’t graduate benefit from attending additional years of education (though they are more likely to be saddled with student debt they struggle to pay off).
In line with the high returns to a college education, young adults’ college enrollment rate shot up from fewer than 50% in the early 1960s to over 65% in the 2010s. First-time enrollment among young adults has declined in recent years, especially following the COVID-19 pandemic, and especially among men. In 2021, 62% of recent high school graduates enrolled in college. There were 2.5 million fewer enrolled students in 2022 than in 2010, with men accounting for half (1.2 million) of the drop.
Despite improved overall educational attainment, sizable racial and ethnic disparities in college application, enrollment, and completion rates remain. Differences in enrollment by family socioeconomic status (SES, defined by income, education, and occupation) are particularly striking: 89% of students from high-SES (top quintile) families enroll in college compared with 51% of those from low-SES (bottom quintile) families. Young women are also nine percentage points more likely to enroll than men, and white and Asian high school students are also more than nine percentage points likely to enroll than Hispanic and Black students.
While a healthy majority of high school graduates now enroll in college, a significant share never completes their degree. A quarter of college freshman do not return for their second year, including four in ten of those who started at a community college. The National Student Clearinghouse documents that men, and Black, Hispanic, and Native American students are less likely to complete their degree than women and white students. Hispanic and Black students make up 35% of all undergraduates, but 43% of students who stopped out in the last ten years.
Work engagement and financial independence
Most young adults are either working or enrolled in an educational institution. From 1989 to 2018, the share of adults ages 18 to 24 who were working or enrolled rose from 83% to 86%, according to a Pew Research Center analysis. But that still leaves 14% — about 4 million young people — disconnected for one reason or another. The number of young people who are disconnected at any one point in time is dwarfed by the share who may have a period of disconnection at some point during those crucial years. Four in ten people are “weakly attached or unattached to school and work” at some point between the ages of 16 and 24.
This group young people are often referred to as “disconnected” from work and education; they are also, and more positively, frequently labeled “opportunity youth.” What is clear is that as a group, they face a variety of challenges including increased rates of homelessness, substance abuse, teen pregnancy, disability, and involvement with the criminal justice system. Disconnection also comes at a high price later in life: a 10% increase in the share of time a young adult spends disconnected is associated with a $7,000 – $9,000 decrease in family income at age 30.
It is important to note that many of the young people who are engaged with neither education nor employment may nonetheless be engaging in valuable social activities, such as caring for children or other family member. Disconnected women between the ages of 16 to 24, for example, are four times more likely to be mothers than women who are working or enrolled. A quarter of young women who are neither enrolled nor working are mothers. The gender gap has narrowed here: the share of women aged 18-24 who were not in the labor force nor in college fell sharply from 22% in 1989 to 14% in 2018, while the share of men who were disconnected rose slightly from 11% to 13%. This shifting trend in the rate of disconnection by gender is likely driven largely by a steep decline in the teen birth rate and a simultaneous rise in the share of young mothers who are financially responsible for their children, which is related to a rise in cost of living, and a sharp increase in births to unmarried mothers. Young women are both less likely to have a child than 30 years ago, and more likely to work or go to school if they do.
The Pew analysis also shows that rates of disconnection are higher among Black and Hispanic young adults relative to their white and Asian peers. Though it’s not all bad news: While Asian, white, Black, and Hispanic young adults are all more likely to be working or enrolled in 2018 relative to 1989, the improvement was greatest among Black and Hispanic young people, and the racial/ethnic gaps in disconnection shrunk.
Young adults who are connected are also not necessarily able to make ends meet on their own. Over half of parents with children between 18 and 29 report giving them at least some financial help in the previous year. Fewer than a quarter (24%) of young adults are financially independent of their family.
Living arrangements, family formation
Compared with previous generations, young adults today are more likely to live with their parents or grandparents, alone, or with an unmarried partner, and less likely to live with a spouse. In 1970, 31% of adults between the ages of 18 and 29 years old lived with a parent. In February 2020, just before the onset of COVID-19, that rate was up to 47%. What factors do families say influence their decision to live in a multigenerational household? Two large themes emerge: financial hardship, and caregiving responsibilities.
Financial (in)dependence
Money is a major factor leading more young people to be living with their parents. Young people are in school longer (and have more student debt) and face higher housing costs relative to wages. Indeed, the most frequently listed reason for living in a multigenerational household among young adults who do so is “financial issues”; 40% report this is a “major reason” they live with adult family members. Lower-income adults are especially likely to report that this living arrangement helps them financially (50%), although financial issues are also at least a minor reason for middle-income (36%) and higher-income adults (24%).
Living with family in adulthood has clear benefits for adults’ financial well-being. Across race/ethnic groups, adults living in multigenerational households are less likely to be living in poverty than other household types.
Family formation and caregiving
Many young adults also have children of their own and rely on their extended family for support. As an Urban Institute report finds, around 43% of US children are born to parents who had their first child when they were younger than 25. Relative to parents who have their first child later in life, young parents are more likely to face financial obstacles. The authors point out that “these young parents often face greater economic challenges [and] half of them live in low-income households.”
Apart from the financial cost, the caregiving needs associated with having children alone are a major reason adults live in a multigenerational household. In 2021, more than one in ten (12%) adults living in a multigenerational household cited childcare as a major reason for their living arrangement. Adult caregiving also influences families’ living arrangements; almost a quarter of adults living with an older parent cite adult caregiving as a major motivator. Income also influences how likely adults are to depend on family members living with them for caregiving; about a third (32%) of lower-income adults cite childcare as a major reason they live with extended family, compared with 20% of middle-income and fewer than 10% of upper-income adults.
Against this backdrop of existing research, we conducted a new empirical analysis to draw out key trends in the decisive decade, with a focus on demographic differences, and identify potential areas for policy and programmatic interventions.
Data
We use data from the Current Population Survey (CPS) and the High School Longitudinal Survey of 2009 (HSLS:09) to study trajectories through the decisive decade, disaggregating the results by demographic characteristics such as sex, race, ethnicity, and parental income.
The CPS Annual Social and Economic Supplement collects data on respondents’ family, employment, earnings, education, and housing. We aggregate over years 2015-2019 to capture a representative trajectory of young adults by age, gender, and race/ethnicity prior to the pandemic, which substantially disrupted young adults’ typical trajectories. These data are especially useful for examining labor force and educational participation between the ages of 16 and 24. See Appendix for details about our sample selection and variable construction.
The HSLS is the most recent longitudinal survey conducted by the National Center for Education Statistics. The survey collects responses from over 23,000 students who were in ninth grade in 2009 across the US. Students, their parents, and school administered were surveyed several times throughout high school and early adulthood. At the time of this analysis, the HSLS survey waves up to three years after the cohort’s expected graduation (about age 21) were publicly available. The longitudinal nature of the survey allows us to connect a young adult’s trajectory to their family of origin’s socioeconomic and demographic characteristic, which makes it best suited to describing trends between the ages of 14 and 21. See Appendix for details about our sample selection and variable construction.
By using both the CPS and HSLS, we can provide a more comprehensive picture of trends during the decisive decade. But it is important to stress that we are using different datasets at various points in the following analysis, with clear identification of which data is being drawn upon at each stage.
Journeys through the decisive decade
At the start of the decisive decade, most of us are starting high school. At the end, we are adults, largely charting our own course. But the journeys vary greatly. Here we set out the paths taken through this decade, with a particular focus on differences by class, race and gender. Since almost all 14- to 16-years-olds are in school — in fact every state in the U.S. requires children to be in school full time until at least 16 — we focus in this section on the years 16 to 24.
At age 16, when young people are still typically living with their guardians and going to school, almost all (94%) are enrolled in school. As Figure 1 shows, as they age and finish compulsory schooling, more young adults begin to work, or become disconnected (i.e., neither working nor enrolled).
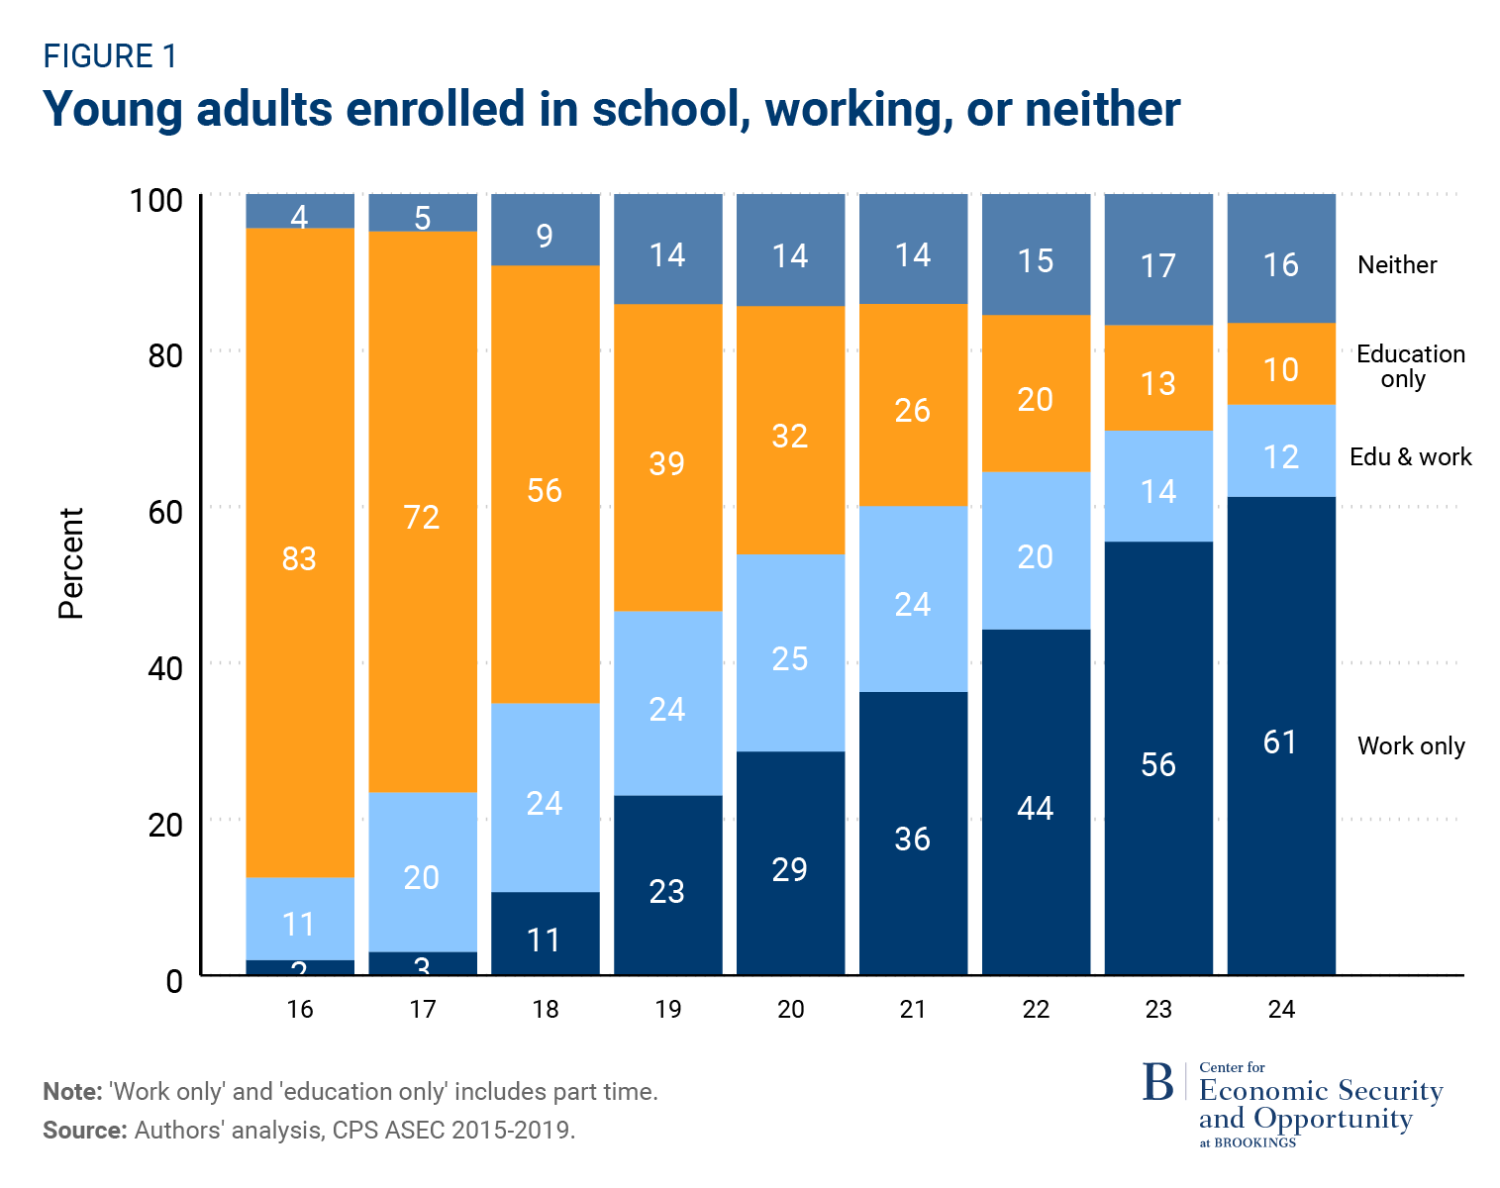
Between the ages of 18 and 21, the share of young adults both enrolled and working is the highest; during that time, around one in four are both working and attending school. The age of 21 is the first year in which the share who are only employed (36%) is greater than the share who are only in education (26%). By the time young adults reach age 24, six in ten are working only and about one in five are in school at all.
There are differences, however, in this journey by race, class and gender. Table 1 shows how employment and enrollment trajectories differ by race/ethnicity and gender. The first column of Panel A, for example, shows working and enrollment distribution of all white 16-year-olds.
Across ages 16 to 24, Asian or Pacific Islander are more likely to be enrolled in school alone than white, Black, or Hispanic young adults. Hispanic and Black young adults are also the most likely to be “disconnected” — that is, not enrolled in school nor working. However, for most of young adulthood, white young people are most likely to be both working and enrolled. By 24, disparities begin to crystalize; a fifth of Black (22%) and Hispanic (20%) 24-year-olds are neither working nor employed, compared to 14% of white and Asian 24-year-olds.
At age 16, young men and young women have similar engagement in school and work. But their trajectories diverge early in adulthood; at age 20, women are 8 percentage points more likely than men to be enrolled. Interestingly, this difference is driven by the higher share of 20-year-old women who are both enrolled and working; the share of 20-year-old men and women who are enrolled (and not working) is the same.
Public opinion on key milestones
As the previous section showed, there are many different paths through the decisive decade, reflecting not only differences in opportunities, but also in preferences and values. There’s no “correct” journey that everybody should be taking. This should not be a route march. For example, the timing of entry into paid work may vary significantly depending on an individual’s interests and aptitudes. Some may be bursting to leave home, while others very content to stay in the family nest. Preferences for when to start a family may differ. And so on.
There is then an important balance to be struck here between empirical statements and normative claims. What being “on track” looks like will vary from person to person, and community to community. For example, there are big race differences not only in the rates of living in multigenerational households, but in preferences for living in such a household.
Decisions like whether or when to get married, for example, are inescapably personal. It would not be appropriate, in our view, to specify whether people ought to get married, and especially not by when. To sharpen this point, it is noteworthy that disconnected young adults (18- to 24-year-olds who are not in work or school) are twice as likely to be married as connected young adults (14% v. 7%). If you consider marriage to be the ultimate measure of being “on track,” this group might be considered early achievers. But if you consider work and/or education to be the right indicators of being on track in these early years of adulthood, they are laggards. It is also important to recognize the difference between planned and unplanned life changes. It is important to note, for example, that while unintended pregnancy rates are falling overall, they remain much higher among younger women, with the highest rates among women aged 20-24, followed by those aged 18-19. The CDC estimates that 75% of pregnancies among teens aged 15 to 19 years are unintended.
It is important then to be cautious about imposing normative judgements. But it is also important to note that as an empirical matter, some journeys are more likely to set up a young adult for more success later in life, at least as defined in terms of economic outcomes.
In other words, there is a delicate balance between an entirely laissez-faire approach, in which each and every path is seen as equally good, and a highly prescriptive model, with a narrow set of “must dos” set out for each individual.
A good place to start is with public opinion. In this section, below, we therefore summarize the evidence on general attitudes regarding key milestones and ideal pathways. In the following section we describe our own key indicators measures for this decade. These draw both on our assessment of prevailing social attitudes, and on the empirical evidence for the connection between particular milestones and later opportunities.
So, what do Americans consider to be the key steppingstones through the decisive decade?
The 2012 General Social Survey (GSS) asks respondents to rate the importance of various experiences to “becoming an adult.” Most Americans consider educational and economic accomplishments to be the most important milestones. Over 60% consider “completing formal schooling” as extremely important to becoming an adult. Having a full-time job (52%) and being able to financially support a family (50%) follow closely behind. In a 2019 Pew survey, most Americans (64%) also agree that young adults should be financially independent by age 22.
By contrast, fewer than half of GSS respondents believe getting married and having children are important to “becoming an adult”. In a separate survey, the National Survey of Family Growth, fewer than 10% think that people need to have children to be happy (and the share is lower for women, at 6%, than for men, at 9%).
The General Social Survey also asked respondents what they thought the “ideal age” was for achieving these milestones. While the ideal age (on average) for having completed major milestones in adulthood varied, the variation was within a fairly narrow range: from 21, for financial independence and living apart from parents, to 25, for being able to support a family, getting married, and having a child. These “ideal age” findings are difficult to interpret, however. They are likely influenced by the experience of previous generations, as well as wide range of other factors. It is worth noting, too, that only a minority of 25-year-olds have achieved any of the milestones of marriage, parenthood, or a family-supporting wage.
Views about key milestones and their ideal timings may differ, of course, across generations. Younger adults, for instance, are less likely than older adults to say it’s bad that more young adults are living with their parents. And, perhaps unsurprisingly, younger adults are also less likely to say that parents do “too much” for their young adult children. But most of them — like financial independence — have not necessarily changed over time.
Setting key milestones
We now turn to the development of specific milestones that can inform our descriptive analyses.
We first consider young adults’ financial and educational arrangements, before turning to consider their family and housing arrangements. Although American adults are less likely to believe family formation is imperative for becoming an adult, the time at which young adults choose to form a family has significant implications for their later-in-life outcomes.
To better understand how young adults are faring in this critical period, we provide a high-level representation of the share of young adults who are hitting certain milestones. Our goal here is to give an overview of how young adults progress using indicators that are associated with positive later-in-life outcomes, like financial security and well-being, and which are in tune with prevailing views of the key milestones, and emphatically not to assign the “correct” path a young adult should take. Success in life is necessarily very individual and subjective.
Nonetheless, certain paths are much more likely than others to lead to greater opportunities, at least as measured in terms of metrics like education and economics. It is therefore useful to examine variations in the journeys people take through the decisive decades against certain standard milestone metrics, not least since this may provide some insight into how young adults are faring and identifying critical disparities in access to opportunity.
Here we analyze these milestones for the whole population.
Table 2 describes the four key milestones in the decisive decade we adopt for the following analyses, as well as the relevant dataset. We also show the proportion of young adults passing each milestone at the particular age1 we specify (again, noting that this is nothing magic about these ages, they are simply broadly reasonable ones for the metric at hand).
Most people pass these milestones, which suggests they are useful measures against which to assess progress. Based on the survey evidence described briefly in the previous section, the average American adult would consider many of the measures we use in the report to be important markers for the transition to adulthood. See Appendix for additional details about variable construction and use in this report.
In the next section, we show the passing of these milestones differs by demographic group, specifically gender, race, and class; and how passing one milestone influences the chances of passing the next.
Progression through milestones
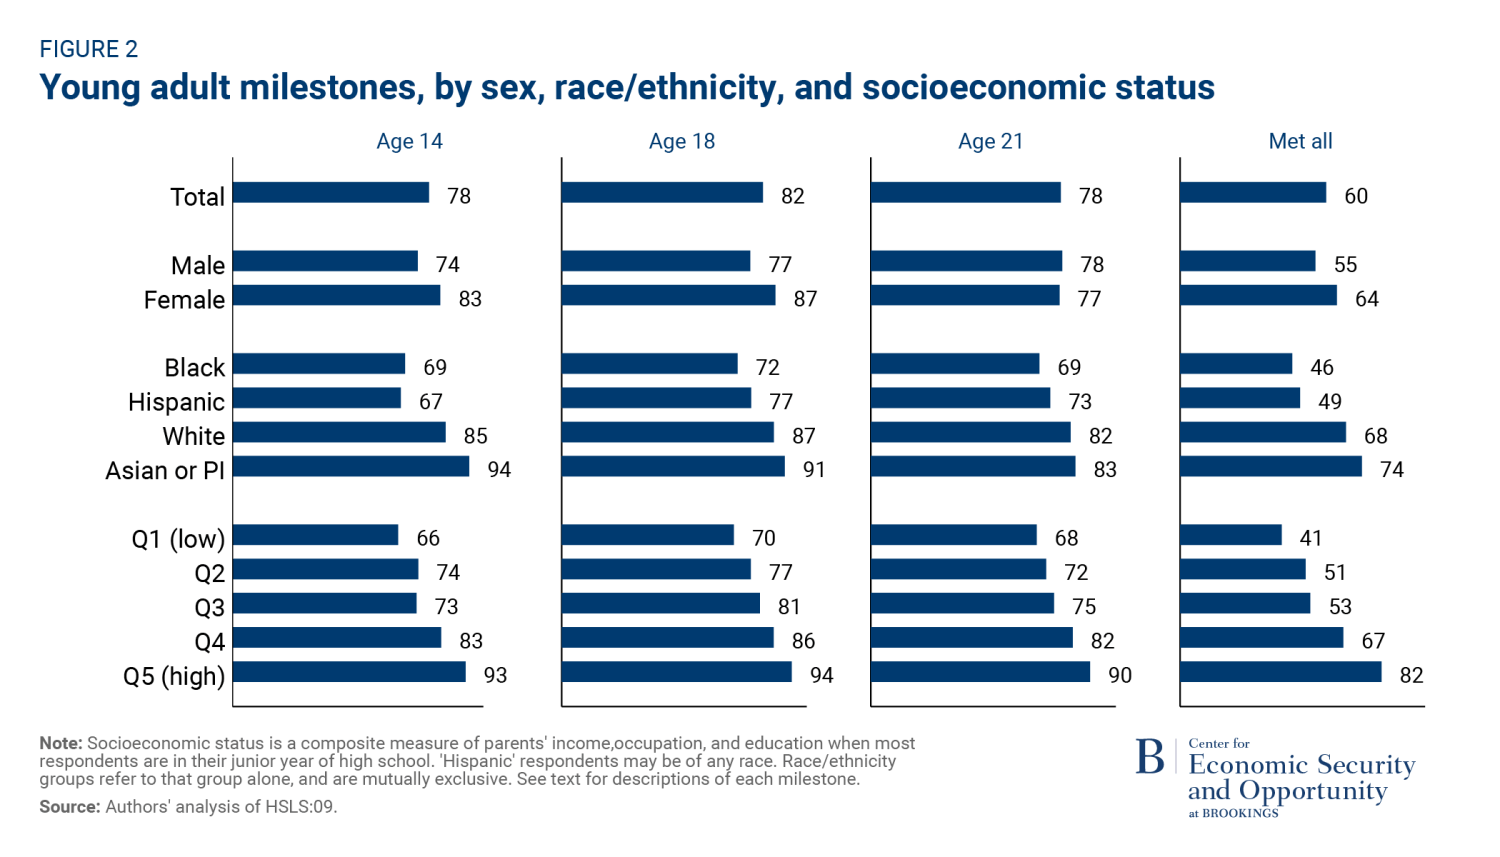
While most young adults are passing each individual milestone, only just over half – six in ten – meet every milestone between ages 14 to 21. (Note that in this section we only address the first three milestones in order to use the same dataset). And there are important disparities to note, as shown in Fig 2. At ages 14 and 18, young women are more likely to be hitting the key milestones than young men. A similar share of men and women are on track at age 21, meaning they are working full time, are enrolled in school, or both. But the difference earlier in young adulthood results in young women being nine percentage points more likely than young men to be on track at ages 14, 18, and 21.
Differences by race or ethnicity and class are especially striking; nearly three quarters of Asian 21-year-olds meet all three of the milestones, compared with two thirds of white, half of Hispanic, and about half of Black 21-year-olds. Similarly, 21-year-olds from top-quintile families are twice as likely to have met every milestone than those from bottom-quintile families.
Just because a person does not hit a particular milestone by a certain age doesn’t mean they won’t hit a later one, of course. There are diverse pathways through the decisive decade. But it is useful to see how one milestone might influence another.
In Figure 3 we show the relationship between one milestone and the next using longitudinal data from the HSLS. Owing to data constraints (see Appendix), we are only able to conduct this purely longitudinal analysis through age 21 (i.e., for the first 3 milestones).
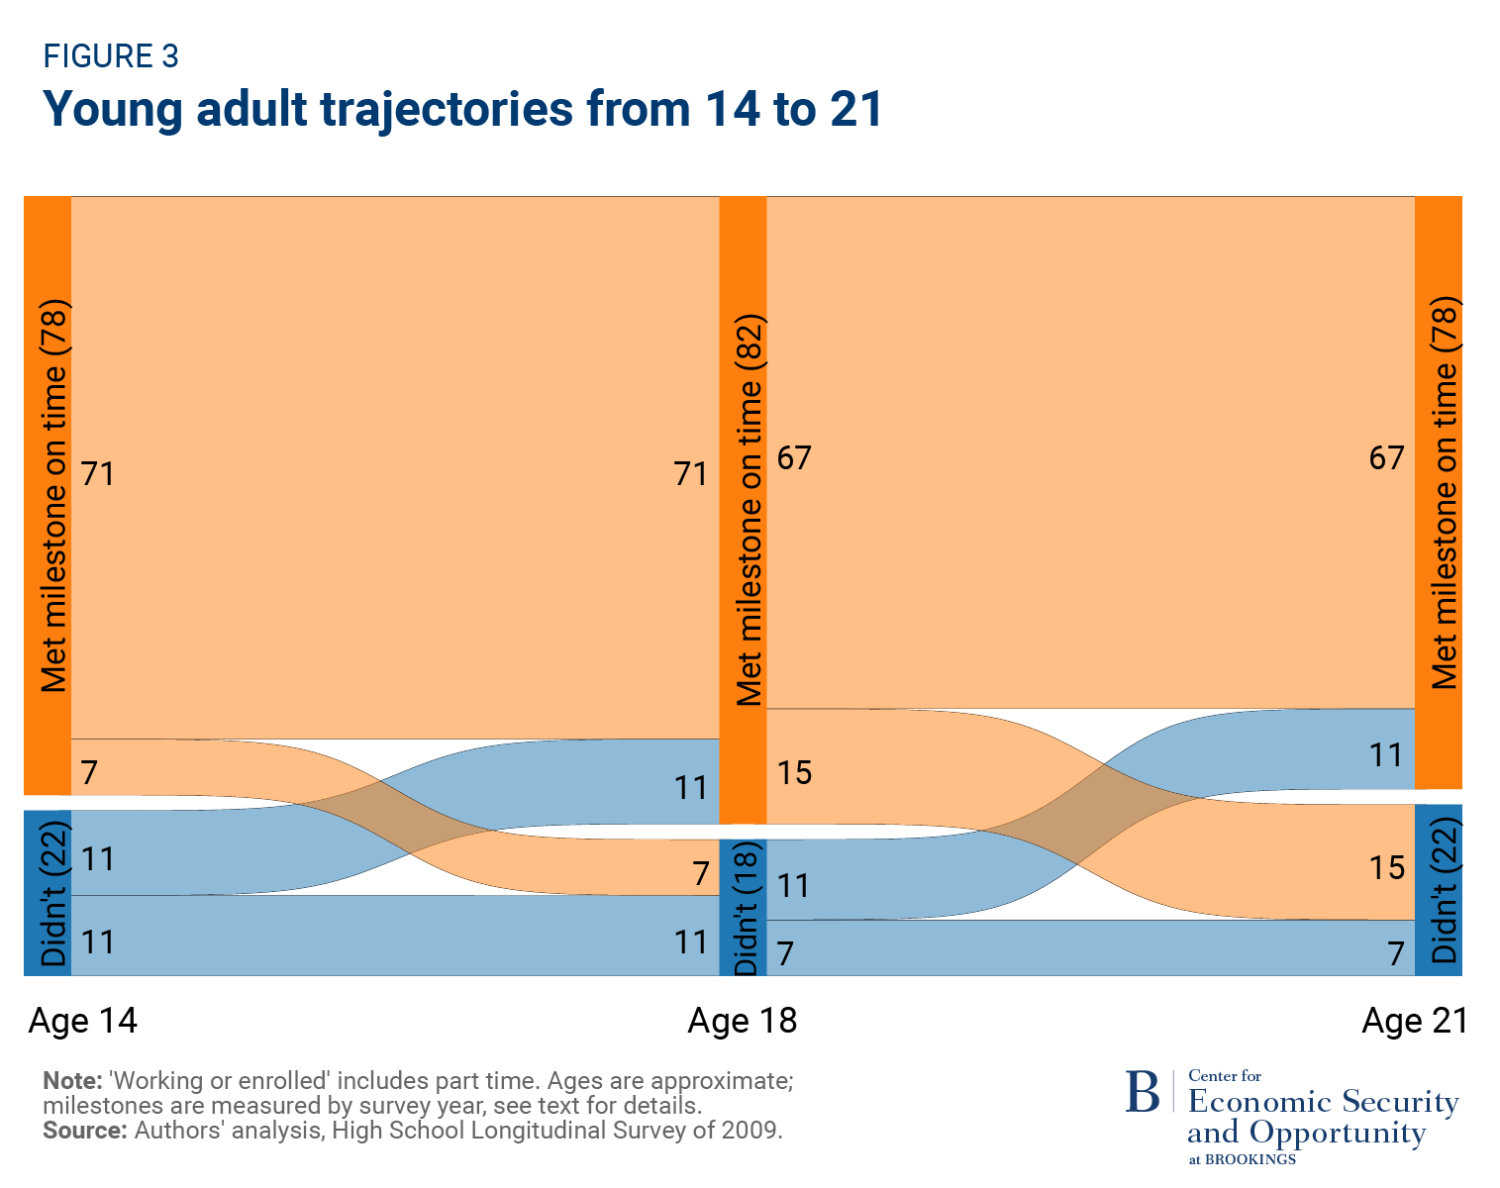
Seventy-eight percent of 9th graders (about age 14) have hit the key milestone at the start of the decade, meaning they are enrolled in the 9th grade for the first time and have an academic GPA of at least 2.0. And the students who are pass this milestone are more likely to pass later ones. Among those who hit the milestone at about age 14, over 90% go on to graduate high school on time with a GPA of 2.0 or higher (the key milestone at about age 18). By contrast, only about half of those who missed the mark at age 14 are meeting milestones at age 18.
On-time high school graduation is also predictive of enrollment and workforce participation later in life; 41% of those who do not complete high school on time with a 2.0 or higher are disconnected from school and work compared with 18% of those who completed high school on time.
While missing a milestone in adulthood does not lock in later-in-life outcomes, there is a clear relationship between passing one milestone and time and doing the same later on. This emphasizes the importance of investing in young adults early.
The age of fate: Life at 24
We have so far described the journeys through the decisive decade for different groups, differences in the passing of key milestones from 14 to 21 at particular ages, and shown the relationship between those milestones. In this section, we use the CPS to look at the situation of 24-year-olds, right at the end of the decisive decade. In some instances, we rely on the HSLS to show how outcomes vary by the socioeconomic status of young adults’ family of origin. As described in the introduction, 24 looks close to being something like an “age of fate,” a key moment in life trajectory that has a strong predictive power in terms of subsequent outcomes.
Figure 4 shows the percentage of 24-year-olds who have reached major education, work, financial, and family milestones. These include the measures from our earlier milestones, but here we add more detail, for example by distinguishing levels of students’ educational attainment (see Appendix for details). We also include other important transitions not captured by our milestone framework. In particular, we analyze characteristics related to household and family formation: leaving the family home, getting married, and becoming a parent.
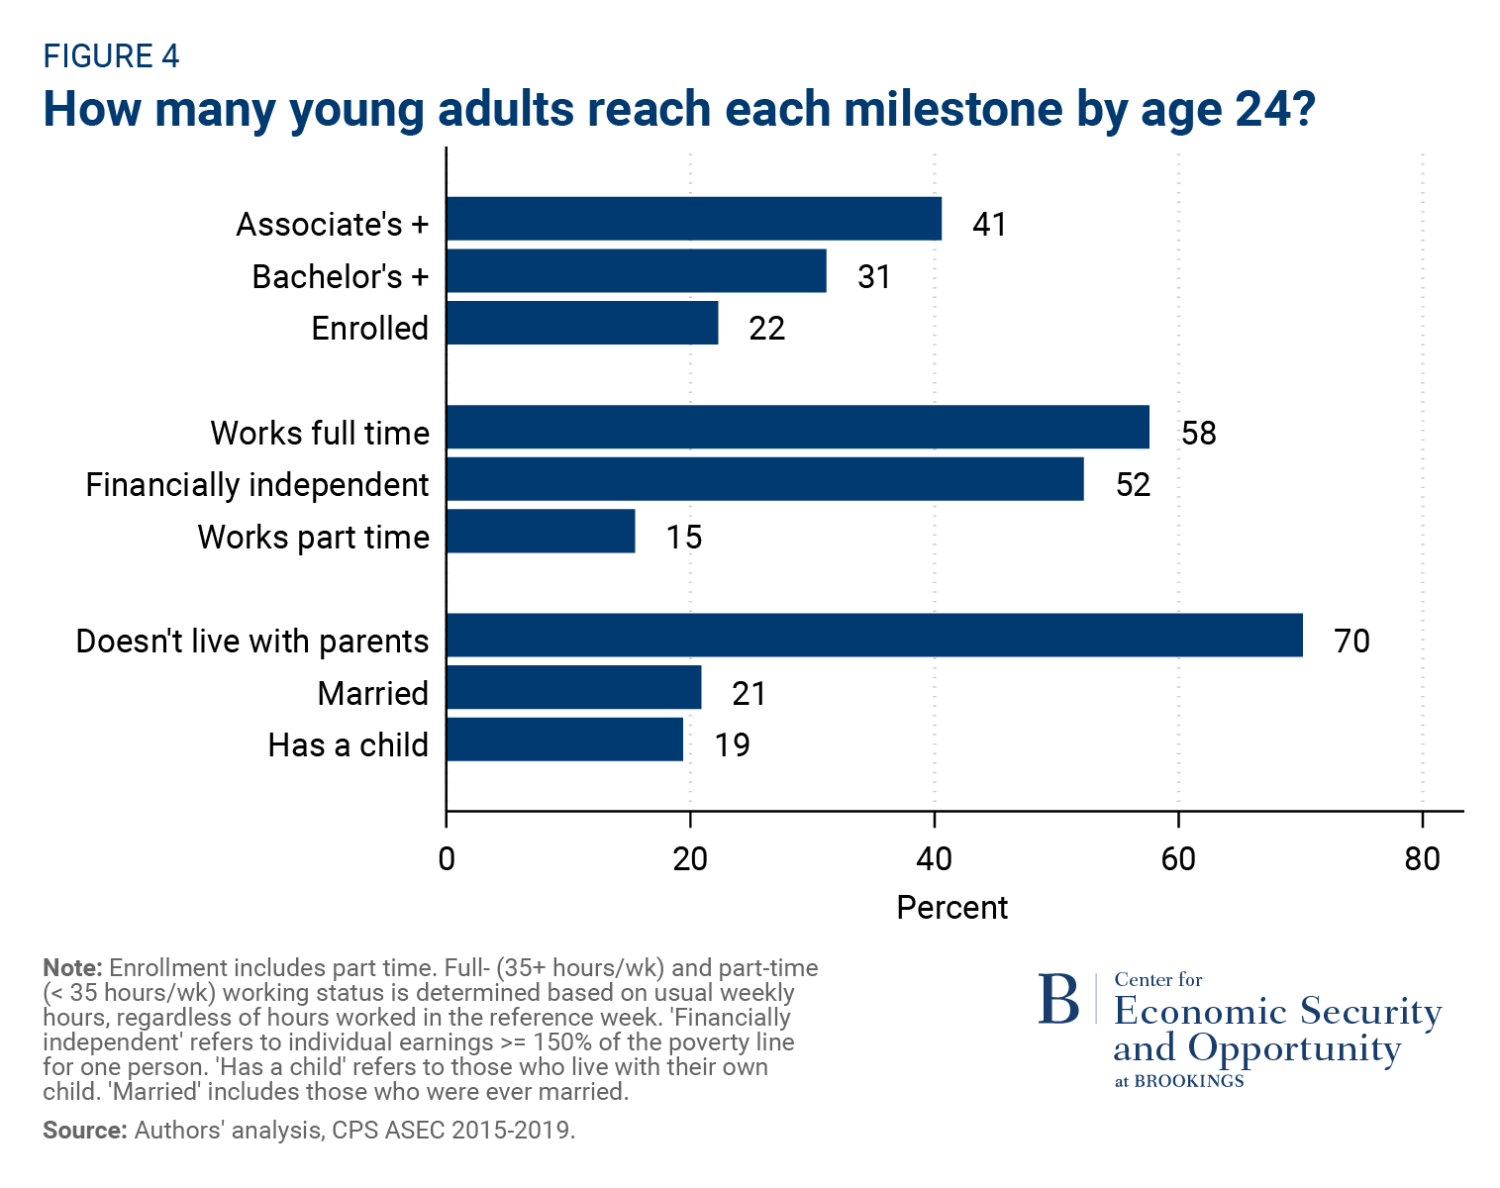
While over 40% of 24-year-olds have an associate degree or at least two years of college completed, more than a fifth are still enrolled (this includes graduate school). More than half of 24-year-olds are working full time, and a slightly smaller share (52%) earn at least 150% of the Federal Poverty Line for a family of one (around $20,000 in 2019). Sixteen percent work part time. At the same time, 24-year-olds also have begun to form families of their own. Seven in ten do not live with their parents, more than a fifth are married, and about a fifth live with a child of their own.
Next, we zoom in on gender and racial or ethnic differences for each of the main domains: education, work, and household/family formation.
Education
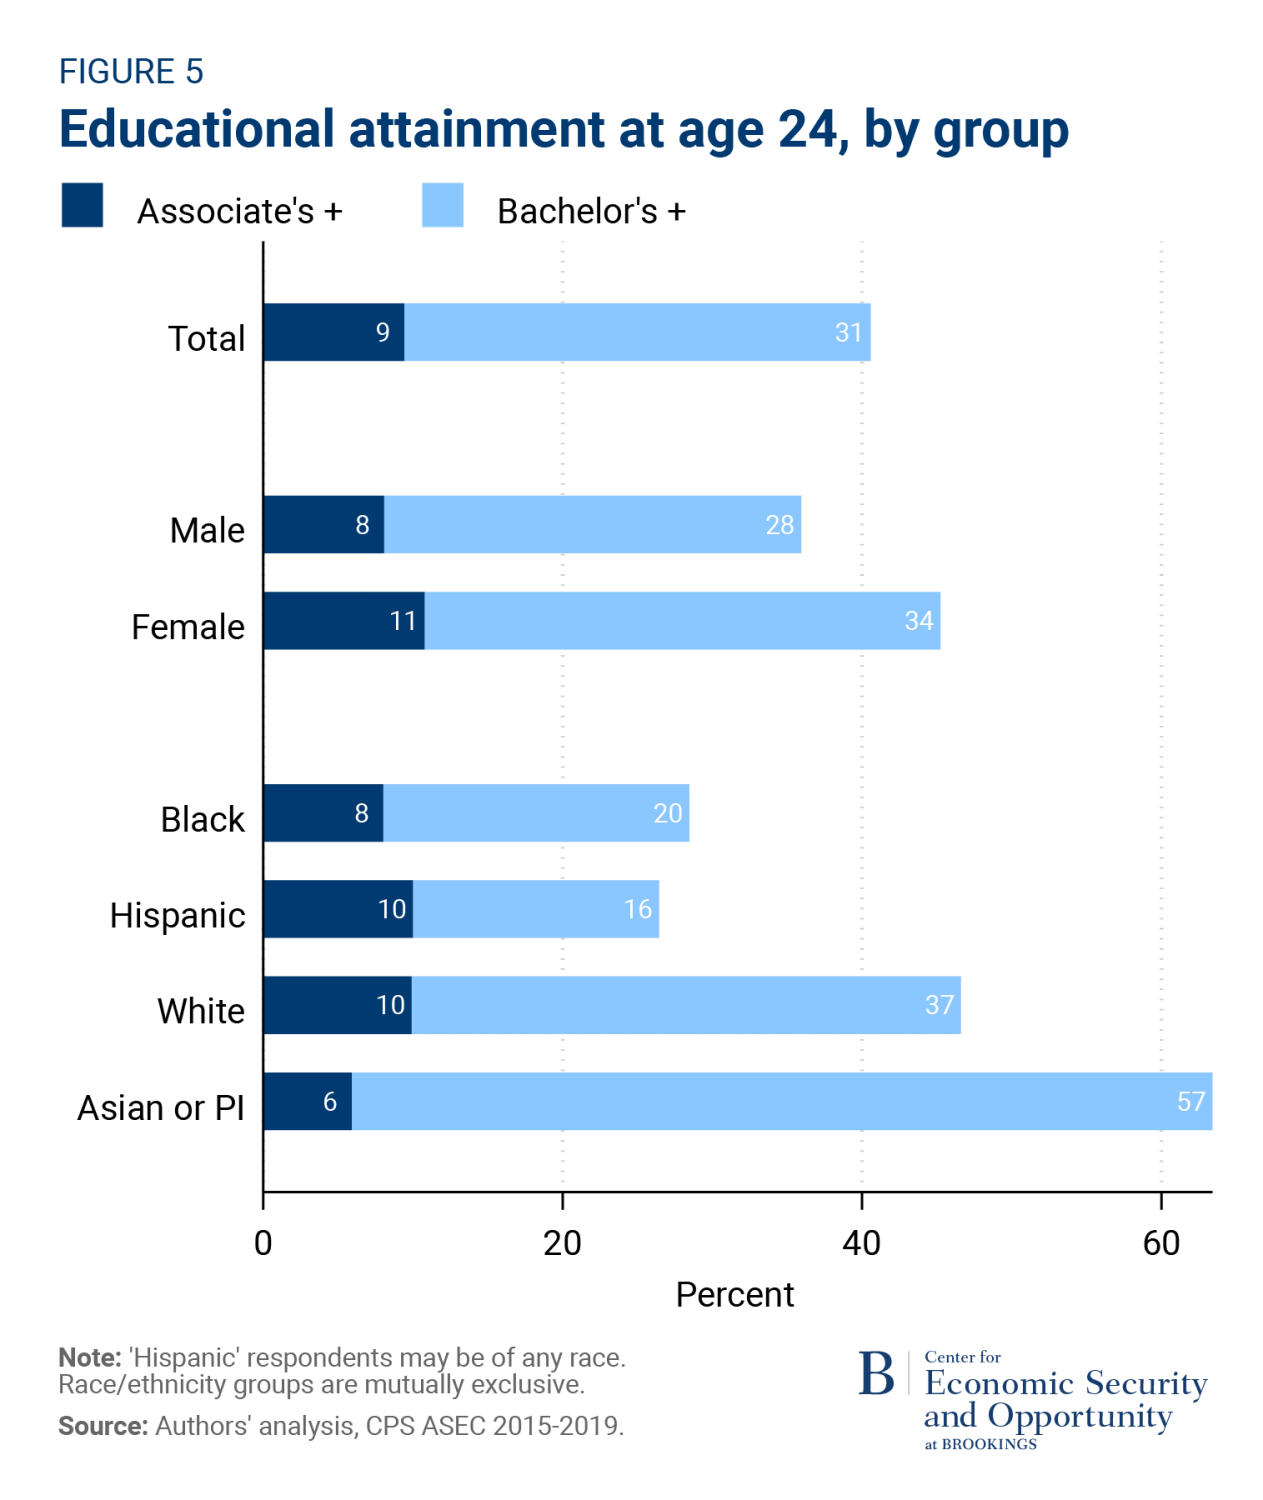
The large differences by race and gender in GPA, high school completion, and college enrollment throughout adolescence and early adulthood are clear in educational attainment at age 24. As Figure 5 shows, young women have higher levels of educational attainment than young men and are about nine percentage points more likely than men to have an associate degree or higher.
Differences by race or ethnicity also follow a similar trend to those observed earlier in the educational pipeline: Asian or Pacific Islander and white 24-year-olds have higher levels of educational attainment than their Black or Hispanic peers. Six in ten Asian or Pacific Islander 24-year-olds have completed an associate degree or higher compared to 47% of white, 28% of Black, and 26% of Hispanic 24-year-olds. The disparities in bachelor’s degree attainment are particularly clear: Asian or Pacific Islander 24-year-olds are more than twice as likely (57%) as Black (20%) and Hispanic students (16%) to have a bachelor’s degree.
Work, engagement, and financial independence
A key marker of adulthood success is managing responsibility and engaging with others, whether that be at school, work, or by caring for a loved one. In this section, we analyze disparities in school and work engagement of young adults, how parenthood affects gender differences in rates of disconnection, and differences in work at age 24.
Figure 6 shows the percentage of 24-year-olds who are working only; enrolled in school and working; enrolled only; and neither working nor in school (an expanded view of the last columns of Figure 1). Six in ten 24-year-olds are working (but not enrolled in any educational program), while 12% are working and enrolled. Another 10% are solely enrolled in educational programs. Strikingly, one in six (16%) 24-year-olds are neither earning nor learning.
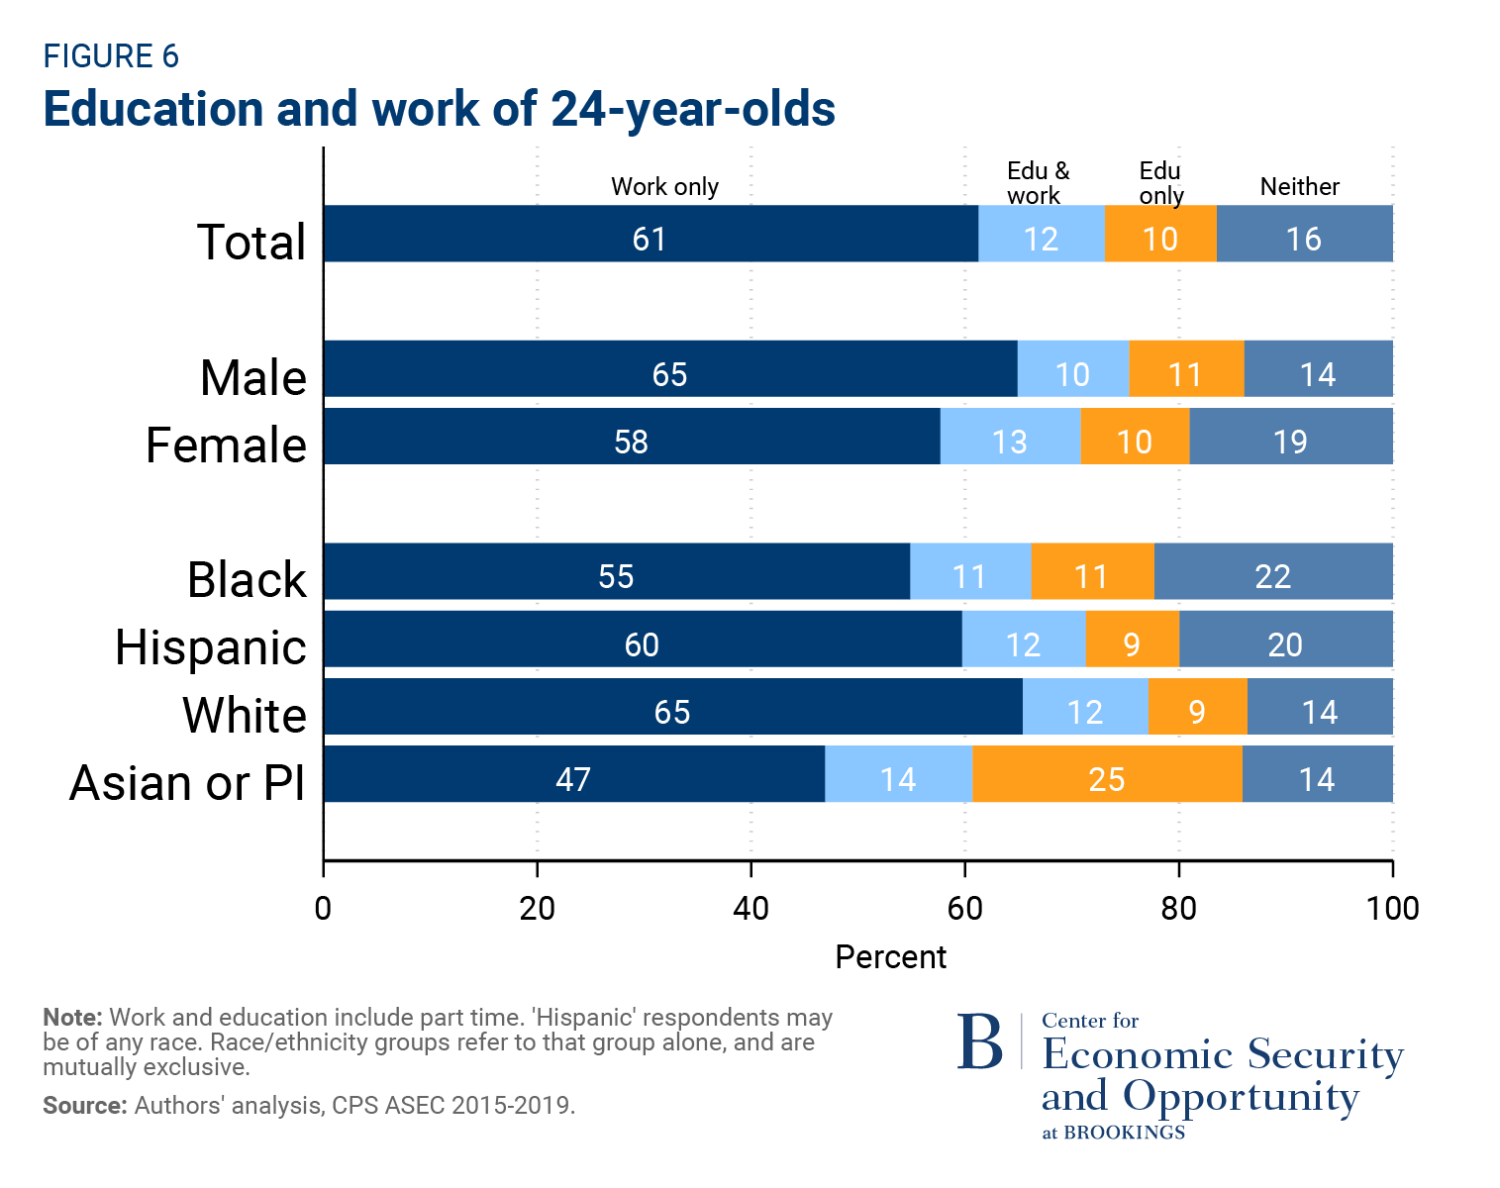
While most 24-year-olds are enrolled or working, there are notable differences in the distribution of work and education by gender and race or ethnicity. White 24-year-olds (65%) are most likely to be working (and not enrolled in school), followed by Hispanic (60%), Black (55%), and Asian or Pacific Islander (47%) 24-year-olds. Asian or Pacific Islander 24-year-olds are more than twice as likely to be enrolled in school than other racial/ethnic groups; four in ten Asian or Pacific Islander 24-year-olds are enrolled, compared to just more than two in ten white, Hispanic, and Black 24-year-olds. And while more than 80% of 24-year-olds are enrolled, employed, or both, 16% are not. Black young adults are the most likely to fall in this category; more than a fifth (22%) are neither enrolled nor employed, a rate 8 percentage higher than for Asian or Pacific Islander young adults (14%).
Relative to 24-year-old women, men are seven percentage points more likely to be working full time, and five percentage points less likely to be neither working nor enrolled (14% versus 19%). But there is a third important activity beyond work and college that young adults could be engaged in: caring. Indeed, a third of the so-called “disconnected” 24-year-olds have a child of their own.
But the differences by gender are striking. Figure 7 shows the education and workforce engagement of 24-year-olds who live with a child of their own, compared with those who do not live with a child of their own, broken by gender.
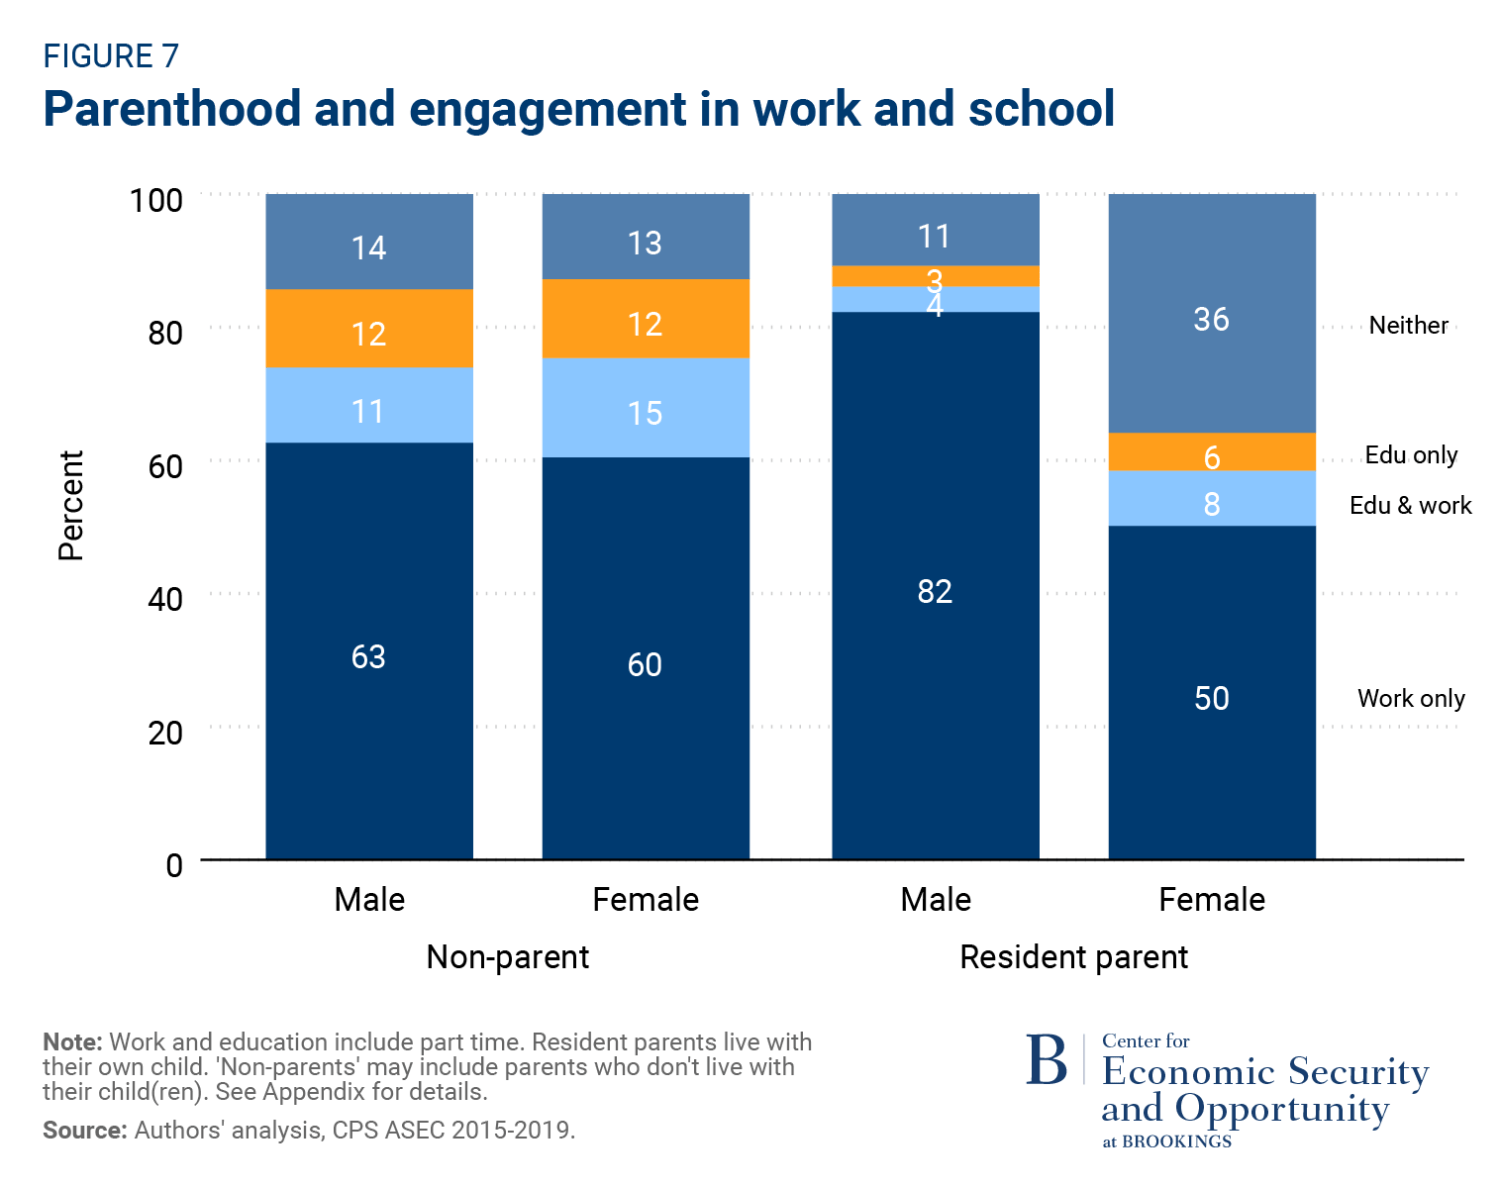
Young men and women without a child in their home have very similar profiles. Men are slightly more likely to be only working (63% versus 60%); women are slightly more likely to be combining work and education (15% versus 11%). But the difference between men and women who are living with their own children is striking. Young resident fathers are much more likely to be working than men who do not live a child (82% versus 63%) and less likely to be neither employed nor enrolled. For young women, the reverse is true: mothers are much less likely to be working than non-mothers (50% versus 60%), and much more likely to be neither employed nor enrolled (36% versus 13%), presumably because they are full-time parents.
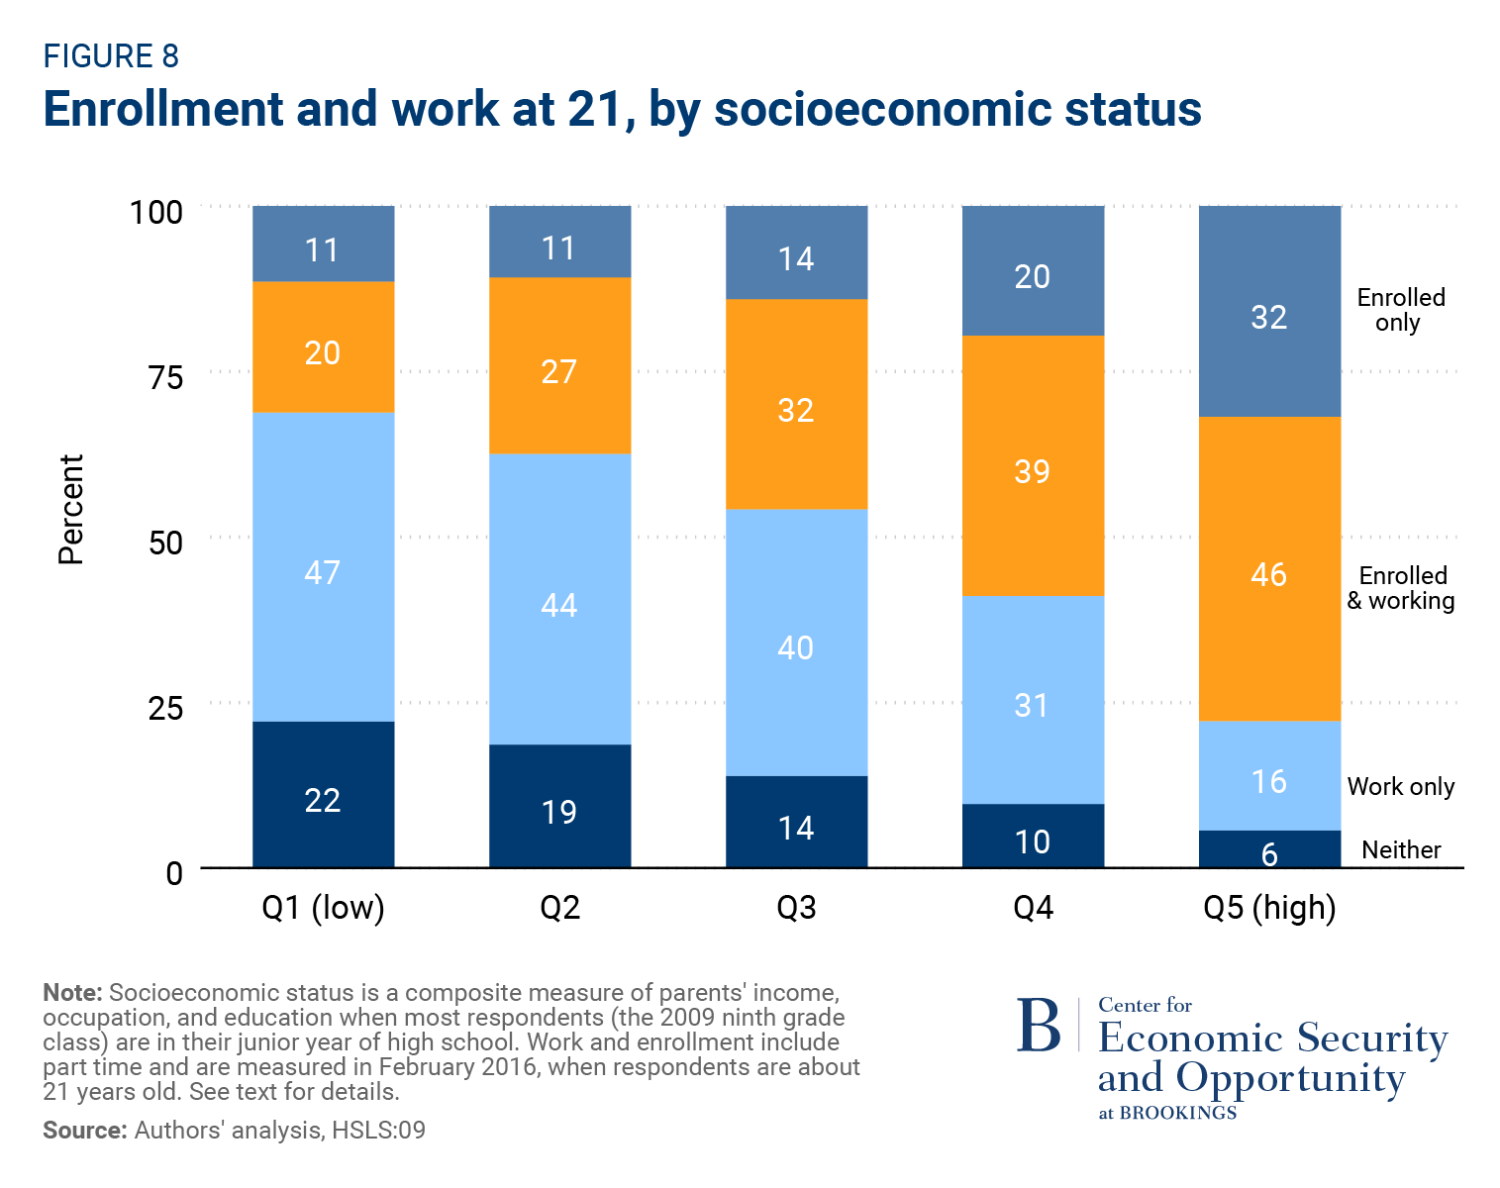
To examine the link between socioeconomic class and young adults’ engagement in work and school, we use the HSLS to show engagement three years after expected high school graduation2 (since we are unable to link young adults to their family of origin’s income in the CPS at the age of 24). Figure 8 shows that young adults who come from high-socioeconomic-status (SES) families are the almost three times more likely to be focusing entirely on school and more than three times less likely to be disconnected than their lower-SES peers at age 21. The difference between the top quintile and even the fourth quintile is stark: Top quintile young adults are about half as likely to be working only or disconnected than those in the fourth. It is relatively unusual for young adults from affluent families not to be in enrolled in college, but fairly common in the rest of the population.
Being in paid work increases the chances of being financially independent, and Figure 9 shows the relationship between these two milestones (at age 24 again, since we can use the CPS).
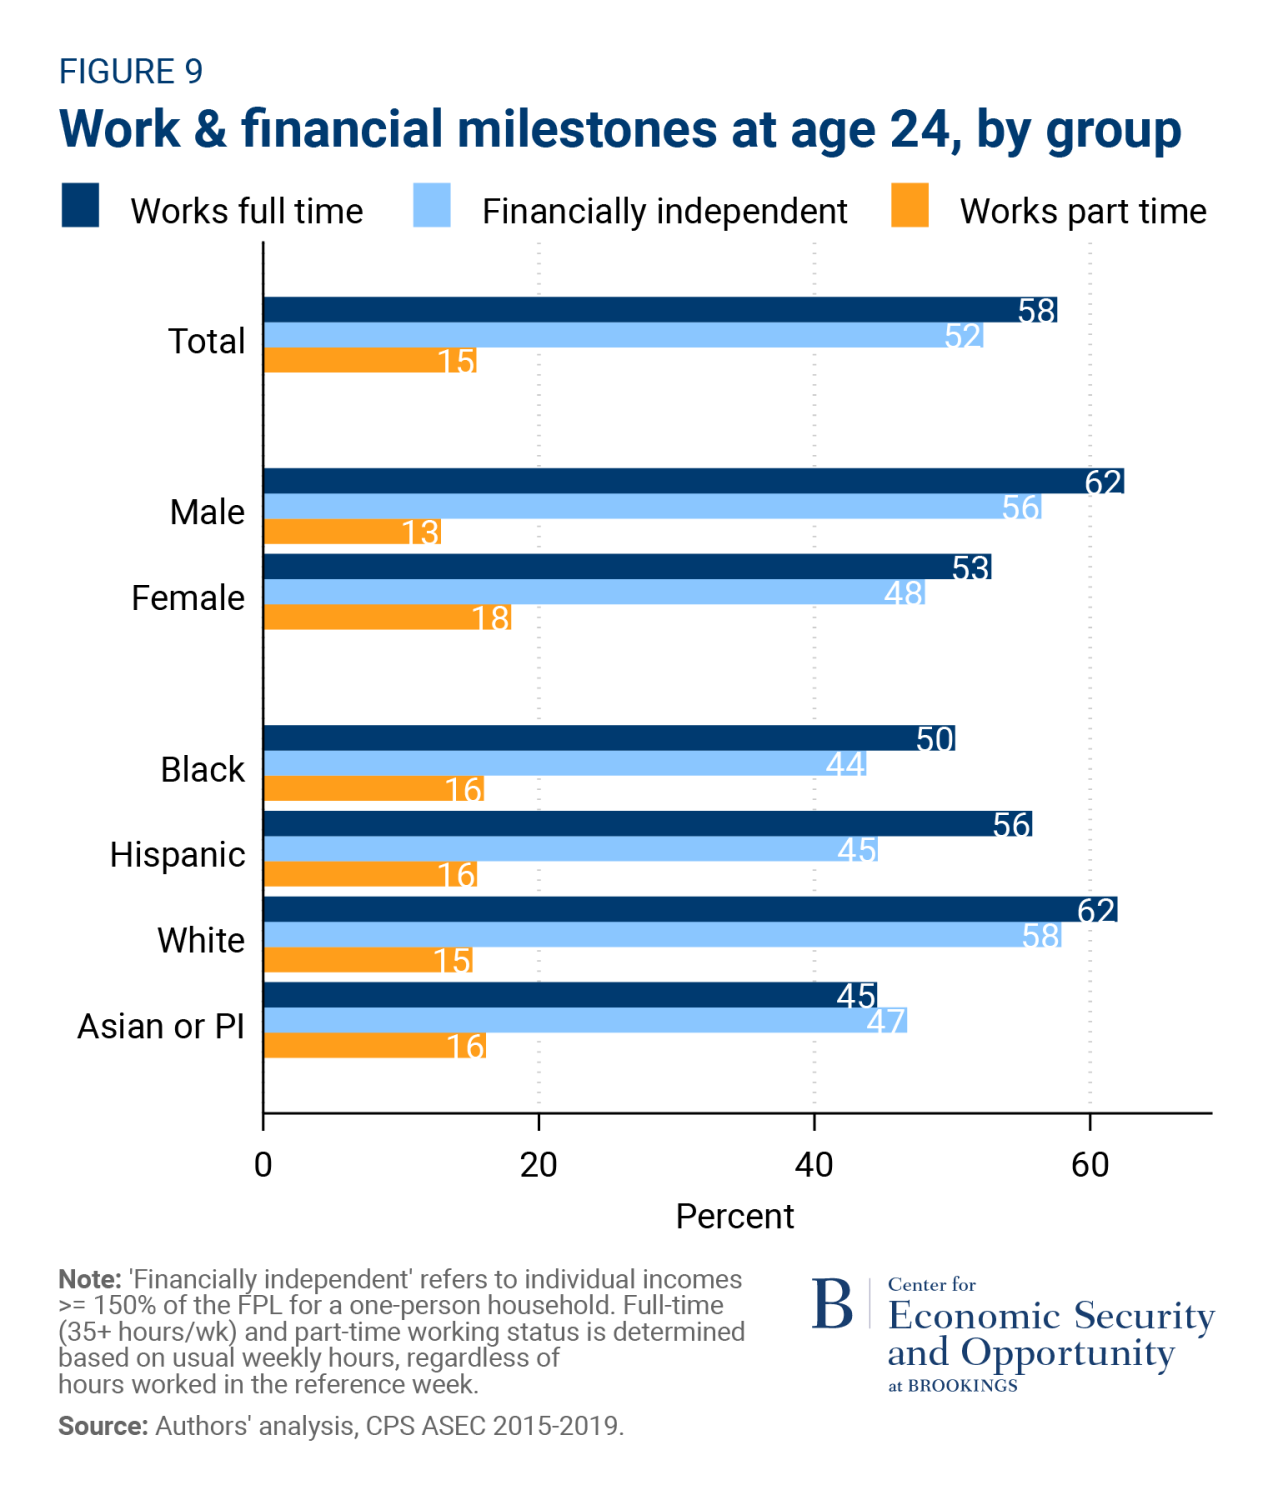
Male 24-year-olds are nine points more likely to be working full time than women, and more likely to be financially independent (though this could be in part because young women are more likely to be enrolled in school still).
Financial and work outcomes by race and ethnicity also follow disparities earlier in adulthood. White 24-year-olds are the most likely to be both working full time (62%) and the most likely to be financially independent (58%). Hispanic 24-year-olds are almost as likely to be working full time as white 24-year-olds (56% relative to 62%), but they are 13 percentage points less likely to be financially independent. Around half of Black (50%) and Asian or Pacific Islander (45%) 24-year-olds work full time.
Living arrangements
The family resources and formation patterns of young adults play a role in their educational and professional trajectories. Outside of work and school, many young adults transition to managing independent personal lives: moving out of their family’s home, finding a partner, and starting a family of their own. Here we consider differences in living arrangements and family formation by gender and race/ethnicity. Figure 10 shows the living arrangements of 24-year-olds overall and broken by demographic group.
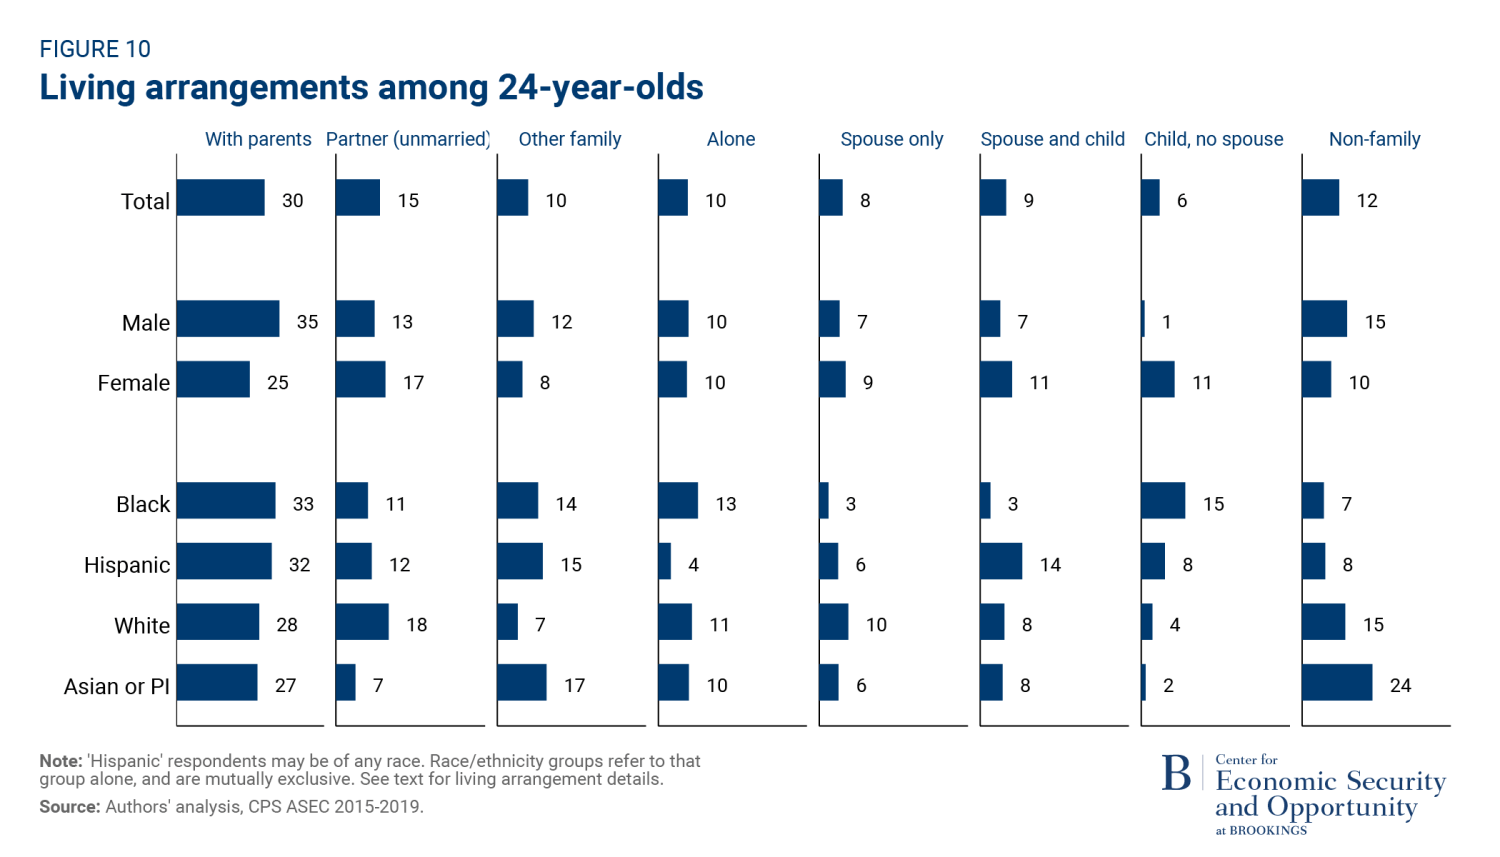
Most (70%) 24-year-olds do not live with their parents. Young men are ten points more likely to be living with their parents (35% versus. 25%). Women, by contrast, are more likely to live with an unmarried partner, a spouse only, a spouse and child, or with their own child but no spouse (48% versus 28%). There are also differences in the average living arrangement by race or ethnicity. Black and Hispanic 24-year-olds are more likely than their white and Asian or Pacific Islander counterparts to live in their parents’ household.3 Young Hispanic adults are also more likely to be living with their spouse and child than other racial groups (14%), while young Black adults are more likely to be living with a child but not a spouse (15%). Asian and PI young adults are more likely to be living with “non-family.” White young adults are about half as likely as other young adults to live with other family, and more likely to live with both a spouse and a child.
Looking ahead
In this paper we describe trajectories through the decisive decade. The central importance of these years is confirmed by our analyses: These are the years in which many key milestones are passed. What happens in the ten years after starting high school sets up to a significant extent the decades that will follow.
We show that passing key milestones during the decisive decade increases the chances of passing subsequent milestones in a timely manner; but we also show that there is no single path to success. The decisive decade looks different by race, socioeconomic status, and gender, with the differences growing as the years pass. The salience of post-secondary education varies greatly across all these dimensions, for example, in the years up to the age of 24, for example. Rates and types of family formation also show significant differences by the age of 24, especially between men and women.
We have been at pains to avoid strong normative judgements, especially regarding more subjective areas such as family formation patterns. Preferences are as a diverse as our society. But our results make clear that the opportunity structure of the decisive decade is very different, especially by class and race.
The goal is not to mandate a specific, narrowly defined path towards opportunity. It is to maximize what Joseph Fishkin calls “opportunity pluralism” or what Amartya Sen and Martha Nussbaum call “capability sets.” In other words, to broaden the options available to young adults, and the resources required to pursue them.
In policy circles, a great deal of attention has been paid in recent years to the early years. Of course these are vital. But the years from adolescence through to early adulthood are even more critical, and too often neglected. If the ten years that follow the first day of high school are truly the decisive decade, they are worthy of great attention from scholars, practitioners, and policymakers alike.
Authors


Related Content


APPENDIX
Current Population Survey (CPS)
To analyze educational attainment, enrollment, financial, and work trajectories of young adults cross-sectionally, we pool the 2015-2019 Current Population Survey – Annual Social and Economic Supplement (CPS – ASEC) and use appropriate weights.
Demographic characteristics
Race/ethnicity categories are singular and mutually exclusive (e.g., “Black” refers to “Black alone”). We show estimates separately for Black, Hispanic (regardless of race), white, or Asian and Pacific Islander respondents; total estimates include all respondents.
Education
We define young adults’ educational attainment based on the highest year of school or degree completed. They are considered “enrolled” in school if they are attending high school or college part-time or full-time.
Work engagement, financial independence, and poverty
We use WKSTAT and LABFORCE to determine whether the respondent is working full time, part time, unemployed, or out of the labor force. Both unemployed and employed respondents are classified as full- or part-time workers based on their usual hours at their job regardless of the numbers they worked in the reference week (including absence). Full-time work is 35 hours or more per week.
Young adults are considered “financially independent” if their pre-tax personal income in the previous calendar year is at or above 150% of the Federal Poverty Line for a single adult in the year they are observed, regardless of their living arrangement. See CPS documentation for additional detail.
Family formation and living arrangements
We largely follow Richard Fry’s methodology for assigning living arrangements of young adults in a 2016 Pew Research Center report. Young adults’ living arrangements are assigned in order, and do not change once one criterion has been met. First, young adults who are married and live with a child of their own are assigned. Next, those who live with a spouse (but no children of their own), followed by those who live with a child of their own (but no spouse) then young adults living alone. In our analyses by parenthood status, “parents” are those who are living with their “own child.” Of course, many people who are parents do not live with their own children. If a young adult is the child of the head of the household and has not already met one of the above categories, they are assigned to be “living with parents.” Then we assign those living with an unmarried partner, other family members, and other non-family. In Figure 4, “doesn’t live with parents” refers to all living arrangements that are not “living with parents” assigned here.
Milestones at age 24
Young adults are “on track” at age 24 if they are working full time; enrolled in school full time; working part time and enrolled in school at least part time; or in school part time and working at least part time. Enrollment and work status are as defined above.
High School Longitudinal Survey (HSLS)
The High School Longitudinal Survey reflects the academic performance and attitudes of students who were in 9th grade in 2009. Because the survey’s sample is selected using schools, we will see a nationally representative selection of only those who were enrolled in 9th grade (though practically all people around this age are enrolled).
Though we assign approximate ages to the milestones we measure in the HSLS, we do not literally condition our sample on age owing to survey administration timing and the fact that we are measuring cyclical milestones (e.g., completed high school) aligned with the academic year rather than grade/age cut-offs or similar. Instead, we loosely refer to “age 14,” for instance, as an approximation of the age by which young adults reach each milestone we measure. The same is true of our other metrics in the HSLS: we use survey years and refer to the timing of each milestone by age, though it simply reflects the age most people are at a given stage, rather than the respondents’ literal age.
We restrict most of our analyses using the HSLS to those with responses to all variables corresponding to each milestone and longitudinal weights (unless otherwise noted).
Student characteristics
Race or ethnicity is mutually exclusive, and each category refers to respondents of that race alone. Hispanic respondents may be of any race. Sex is based on the student questionnaire and supplemented with school or parent surveys (see HSLS documentation for additional details about X2SEX construction).
We also use a survey-constructed measure of socioeconomic status (X4X2SESQ5) based on parent or guardians’ education, occupation, and income in most respondents’ eleventh grade year.
Milestones: “Age 14”
Students are considered “on track” at about age 14 if they had both a 2.0 or higher academic GPA in grade 9 and were in either 7th or 8th grade in the previous academic year (or an ungraded program). We use this to approximate the share of 14-year-olds who were enrolled in 9th grade for the first time.
Milestones: “Age 18”
Young adults are considered “on track” at age 18 if they completed high school (or expected to complete high school) on time and had an academic GPA in grade 12 of at least 2.0. High school completion includes a diploma or GED/equivalent. Rather than collecting responses of people who are exactly 18 years old, these responses are from the third survey wave, which is conducted over the course of students’ expected senior spring and first fall after expected high school graduation (when most students would be 18).
Milestones: “Age 21”
We use the February 2016 wave, conducted about three years after respondents’ expected high school graduation, to measure their workforce and educational engagement around the age of 21. “On track” refers to those who are either working full time, in education (either full or part time), or both. Those who are only working part time (and not enrolled) are considered “off track,” as are those who are unemployed, and those not in the labor market. Postsecondary enrollment is “on track” regardless of if the respondent is full- or part-time.
Note: In Figure 8, showing the labor force and educational engagement by socioeconomic status, “working only” includes part-time and full-time employment/enrollment. Those who are neither enrolled nor working includes those in the labor force but not working (unemployed) and those not in the labor force. Because we are only considering a cross-sectional view in this figure, we use the corresponding cross-sectional weight and do not limit our sample to those with responses to all milestones.
-
Acknowledgements and disclosures
The Brookings Institution is financed through the support of a diverse array of foundations, corporations, governments, individuals, as well as an endowment. A list of donors can be found in our annual reports published online here. The findings, interpretations, and conclusions in this report are solely those of its author(s) and are not influenced by any donation.
-
Footnotes
- It is important to note that, because of the staggered timing of birth and events like high school graduation or survey administration, we aren’t always measuring the outcomes at the literal age listed. Instead, we describe the typical age of those who we are analyzing. See Appendix for details.
- The sample used in Figure 8 differs from the sample in the longitudinal analyses in the previous section
- See Appendix for details about how young adults’ living arrangements are assigned. Importantly, 24-year-olds are considered to be living “with parents” only if their parents are the head of their household and they aren’t living in a set of other arrangements.
The Brookings Institution is committed to quality, independence, and impact.
We are supported by a diverse array of funders. In line with our values and policies, each Brookings publication represents the sole views of its author(s).