
American households live amid a transportation conundrum. From a technological perspective, no developed country makes greater use of private vehicles and their incredible ability to cover long distances in relatively little time. The problem is that all those vehicles come at a real cost to society: growing environmental damage, unsafe roads, higher household transportation spending, and rising costs to maintain all the infrastructure. Even as electric vehicles promise to reduce the climate impacts of driving, this latest innovation still fails to address car dependency’s other persistent costs to society.
Building for proximity could offer a more holistic solution. Helping people live closer to the centers of economic activity—from downtown hubs to local Main Streets—should reduce the distances people need to travel for many of their essential trips. Shorter trip distances, in turn, make walking, bicycling, and transit more attractive and can improve quality of life. And as more people travel by foot instead of a private vehicle, officials can feel empowered to build complete streets that include lower speed limits, protected bike lanes, and other amenities.
In other words, greater proximity could lower environmental emissions, create safer streets, and unlock financial savings. The question, then, is whether proximity-focused neighborhoods can deliver the shorter-distance trips the theory suggests. One way to judge proximity is through how close people live to activity centers, or neighborhoods with a relatively high number of community institutions, tourism destinations, consumption amenities, or jobs in traded sectors.1 These regional hubs appear in every metro area and offer the range of amenities people seek to reach.
Now, using real-world data to estimate travel patterns for residents in the 110 largest U.S. metro areas, we can more directly measure the relationship between residential proximity to activity centers and overall trip distances. As it turns out, the relationship affirms the theory. We find that:
- Households living near multiple activity centers consistently travel shorter distances, often cutting annual miles traveled by more than half. Generally, the more activity centers a household lives near, the shorter their total travel throughout the year. While this pattern holds when looking at proximity to any number of nearby activity centers, residential proximity to the fifth-nearest activity center holds the strongest explanatory power for overall residential travel patterns. For the average driver, living closer to multiple activity centers can save around $920 to $1,200 in annual transportation expenses and reduce their carbon footprint by 2,455 to 3,020 pounds of carbon dioxide.
- Generally, too few people live near multiple activity centers. Even though proximity to activity centers brings major travel-related benefits, only 37% of residents in the 110 largest metro areas live within 3 miles—equal to a 15-minute bike ride—of five activity centers. It’s no surprise, then, that metro areas with a higher share of their population living near activity centers tend to exhibit shorter average travel distances overall, although there are some common exceptions related to the metro area’s age and urban form.
- Residents of every metro area studied experience travel benefits when living within 3 miles of five activity centers. Annual travel distances are anywhere from 15% (Stockton, Calif.) to 58% (New York-Newark-Jersey City, N.Y.-N.J.-Pa.) shorter for households living within 3 miles of five activity centers. These trends hold from the oldest, densest metro areas along the coasts to the newer, more automobile-oriented metro areas in the Sun Belt.
- These trends were consistent both before and after the COVID-19 pandemic. Even after all the pandemic-related disruptions to household travel behavior, the relationship between personal miles travelled (PMT) and proximity to multiple activity centers exhibited almost zero change between 2019 and 2022.
These findings underscore just how powerful proximity can be—and just how little U.S. metro areas are designed to leverage the opportunities proximity creates. Moving forward, stakeholders working in real estate development, transportation planning, and related fields should do more to promote growth in neighborhoods close to established activity centers. Up-zoning, streamlining permitting processes, eliminating parking mandates, and constructing complete streets can all support greater development around and within activity centers and facilitate safe transportation connections. Road pricing, impact fees, and resource conservation rules can do the same by dissuading investment in disconnected neighborhoods, particularly by showing the full costs of sprawling development patterns.
America can bring down household trip distances and, in the process, improve environmental quality, health outcomes, and household budgets. But to do so, public policy must do more to promote development in high-proximity neighborhoods.
Practitioners and researchers have long understood the relationship between land use and people’s travel habits. When a variety of buildings with a diversity of uses are densely placed near one another and connected via short street blocks—think of most downtowns, urban neighborhoods, or even some streetcar suburbs—then people tend to travel short distances in those places, frequently by biking and walking. When properties are spread far apart and separated from one another with limited access roads (the predominant suburban model in the United States), people must travel further. In other words, the proximity and connectivity between locations—what’s often referenced to as “accessibility”—is a major determinant of people’s travel choices.
Metropolitan America has now spent nearly a century undercutting the importance of proximity. Urban land area grew 1.4 times faster than the population between 1960 and 2020, leading to drops in overall population density, significant increases in roadway lane miles, and longer distances between where people live and where they need to go.2 The result is a multi-decade expansion of the average mileage each person travels per day, or what’s known as PMT: from 19.5 miles in 1969 to 40 miles in 2017.3 Covering those kinds of distances overwhelmingly favors car usage, so it is little surprise that 92% of American households now have access—often by necessity—to a private vehicle.4
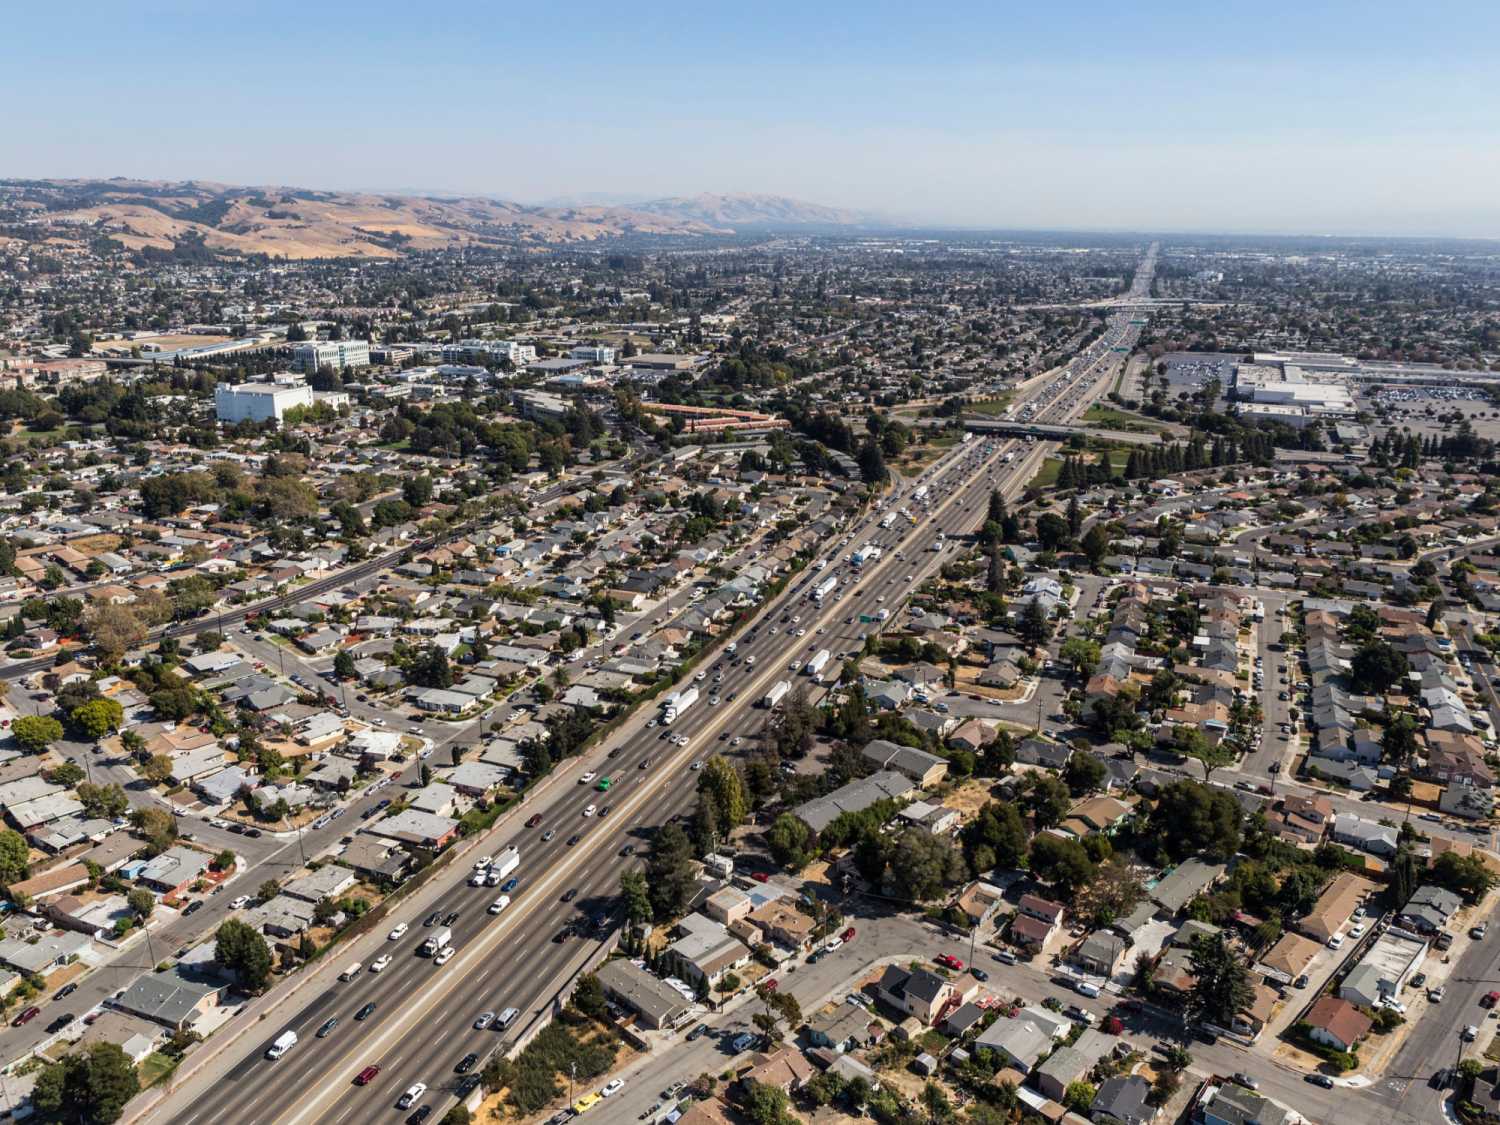
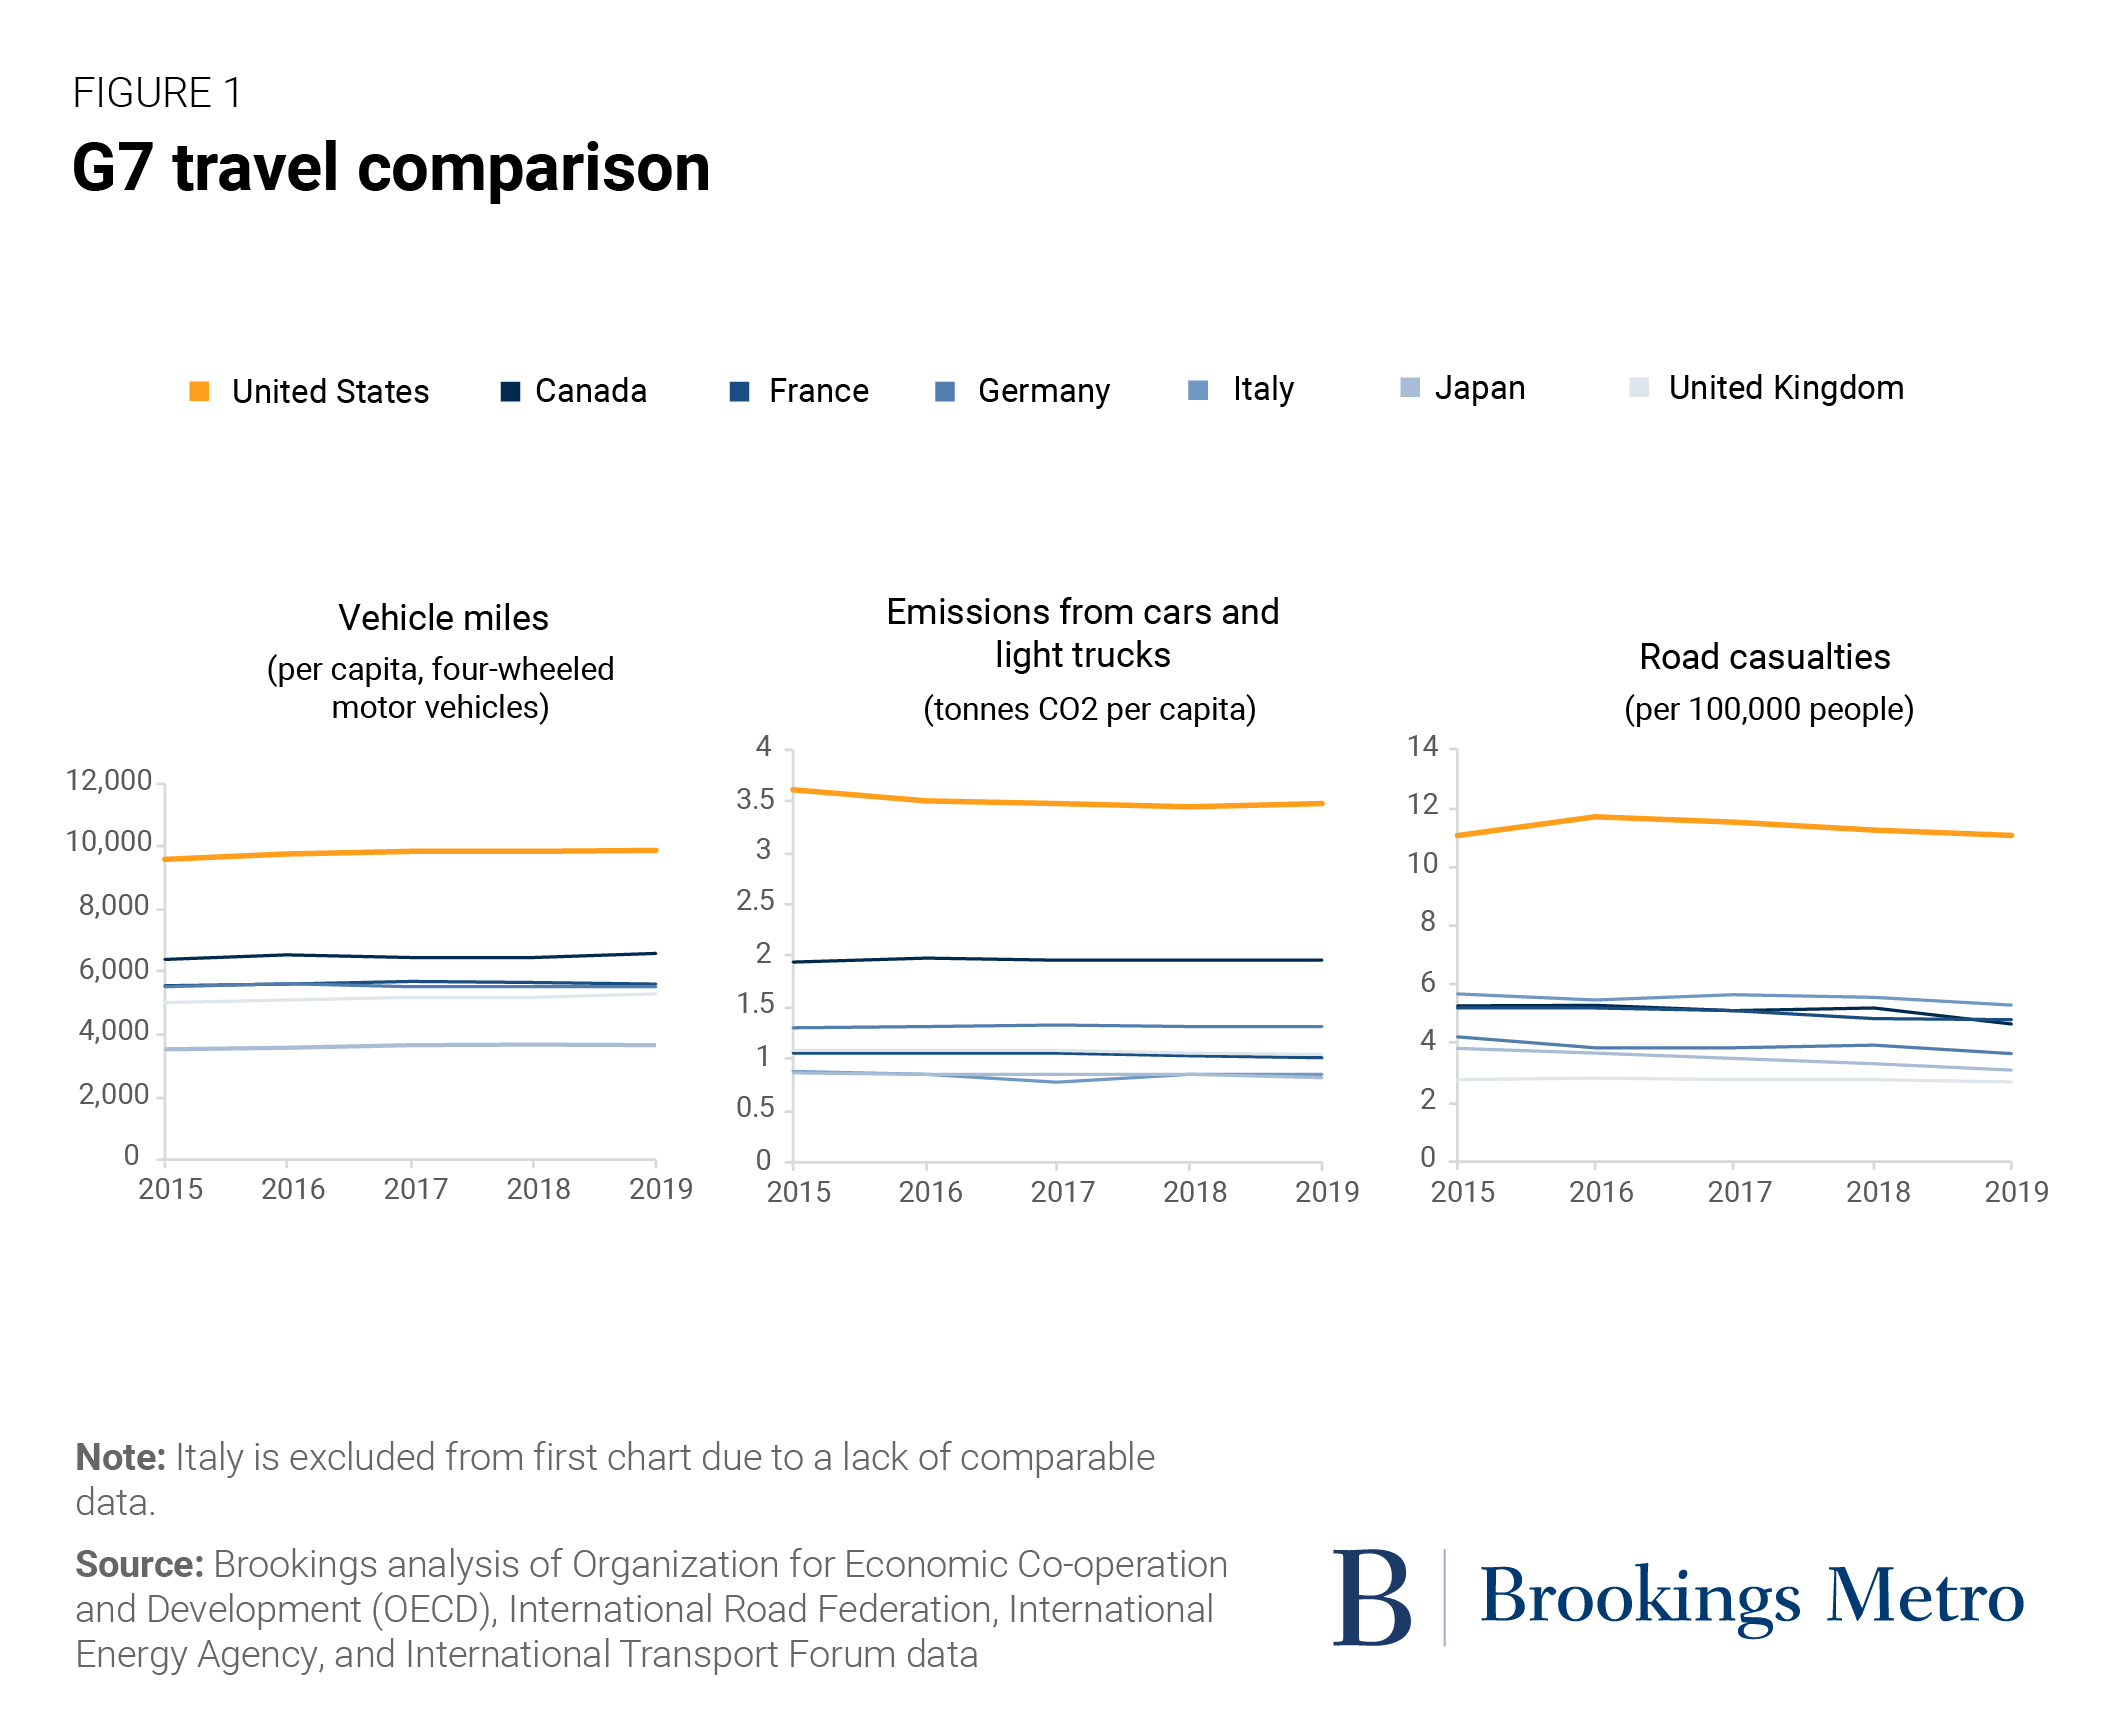
By comparison, our global peers invested far more in a proximity-focused development model—and the differences are stark. The U.S. claims both the lowest urban population density and the highest vehicle miles traveled per capita among the G7 countries. It’s not surprising, then, that the U.S. consistently emits the most transportation-related greenhouse gases per capita and experiences the highest national roadway fatality rate. And ironically, an American economy that prides itself on consumer choice offers less transportation choice than our global peers, which is especially impactful among the households that can least afford private vehicles.
Still, these comparisons should inspire confidence. The fact that our global peers can achieve lower transportation emissions, safer streets, and greater transportation choice proves the United States can do the same. It also underscores how electrifying our vehicles is not a comprehensive solution to our transportation challenges. While reducing greenhouse gas emissions helps—especially if powered by clean electricity—electric vehicles require costly maintenance (although cheaper than traditional vehicles), demand the same amount of roadway infrastructure as their gas-powered predecessors, continue to require dangerous mining activities, and don’t make streets any safer.
The question, then, is what kinds of regional geographies and neighborhood designs can uniquely promote shorter-distance trips and the benefits they bestow. This report suggests one answer is reinvesting in physical proximity, particularly around established activity centers.
This report uses a national model to study travel patterns between every block group in the 110 largest metro areas in the United States (those with populations of 500,000 or more, excluding San Juan, Puerto Rico). The data provider, Replica, uses a mix of cell phone geolocation data, credit card transactions, and underlying demographic information to create a simulated, agent-based model of all U.S. trips (not just commutes to work) on an average Thursday and Saturday in fall 2019 and 2022.5 The Replica dataset also enables analysts to relate each individual trip and the trip purpose (commuting, shopping, or socializing) back to the traveler’s home block group.
For this analysis, we aggregate Replica’s simulated trips up to the census block group level and extrapolate annual distance travelled by weighting Thursday and Saturday travel distances according to 2017 National Household Travel Survey findings.6 We then create summary statistics using past activity center research and related federal datasets. For more methodological details, please see the appendix.
People who live near activity centers consistently travel shorter distances
Activity centers—neighborhoods with a relatively high number of community institutions, tourism destinations, consumption amenities, or jobs in traded sectors—are prevalent in every metro area. While accounting for 9% of total block groups in the 110 largest metro areas, these neighborhoods concentrate significant economic and civic activity into small places, including 41% of all private sector jobs, 25% of total retail establishments, and even larger shares of university students, government offices, and museums. These are the places that regional residents are most likely to go to work, eat, and play.
It makes sense, then, that people who live closer to activity centers tend to travel fewer miles. Per capita, people living in a neighborhood within 1 mile of the nearest activity center travel only 28.7 miles on a typical weekday, 28.1 miles on a typical weekend day, and about 9,770 miles annually. At a household level, these distances translate to 70.4 miles on weekdays, 68.9 miles on weekends, and 23,990 miles annually. Travel distances steadily rise from there, with households living 10 miles from the nearest activity center travelling an average of 130.9 miles per weekday and 41,390 annually.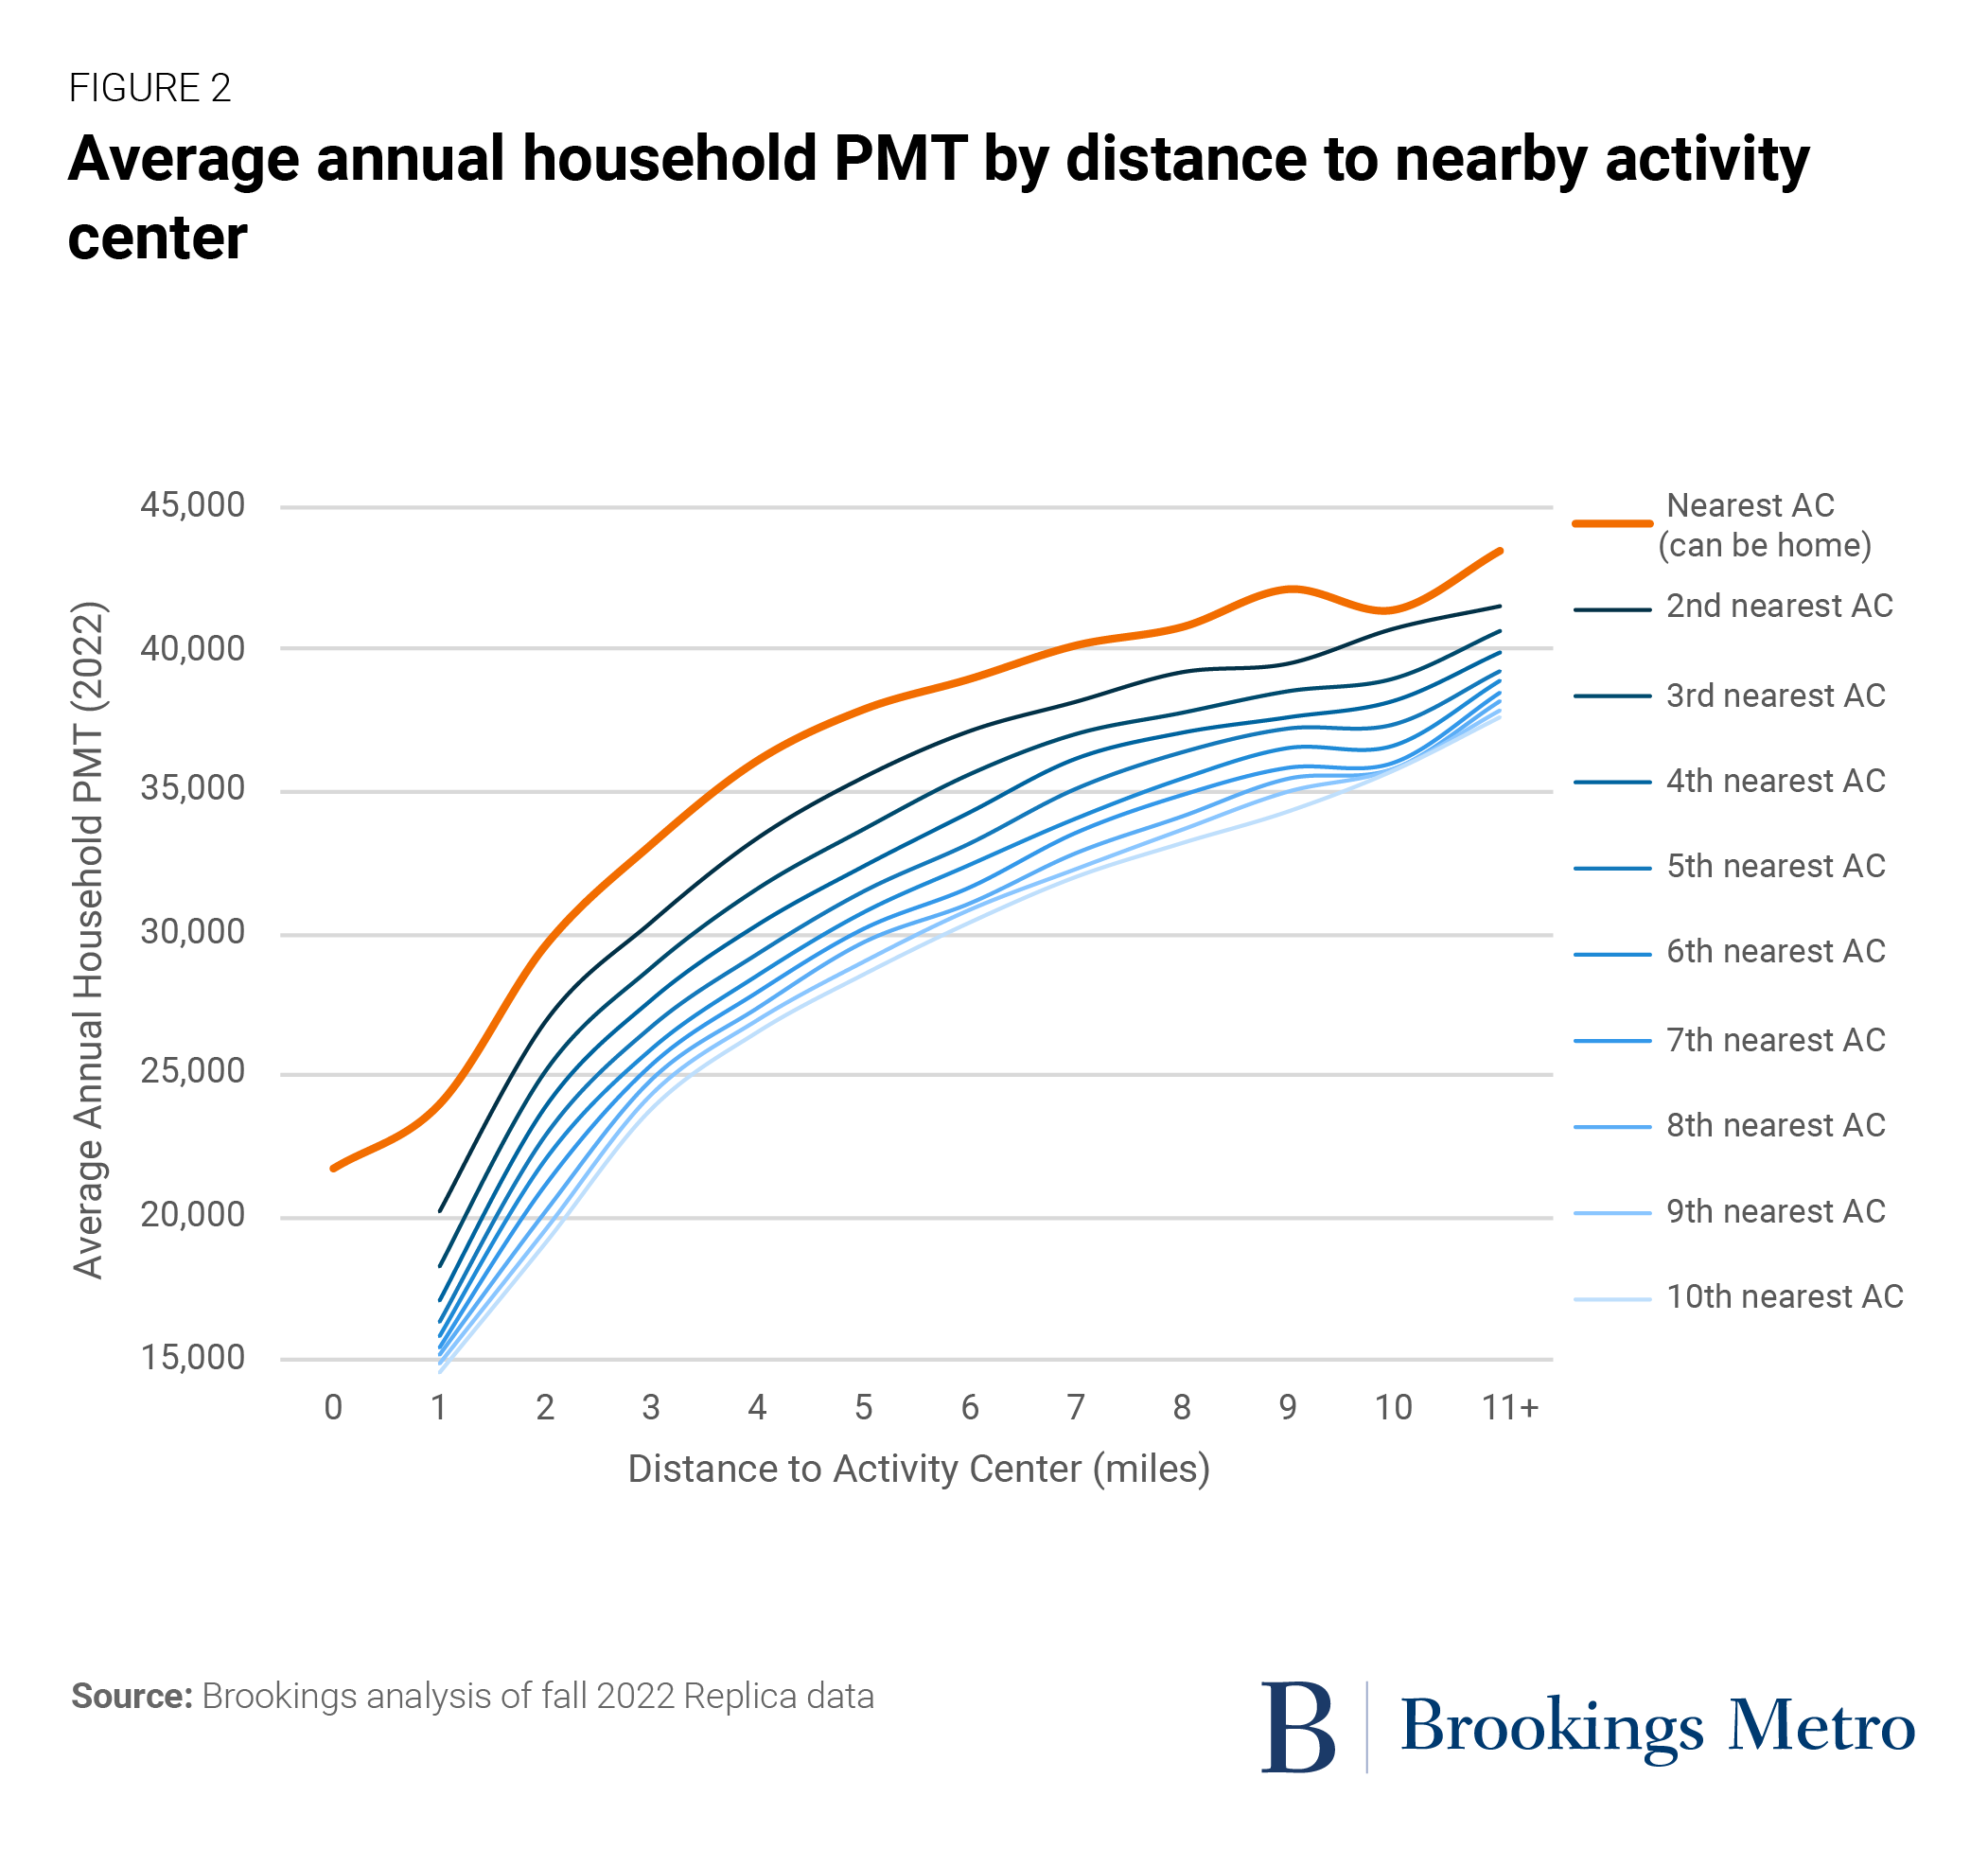
Living near multiple activity centers has an even more pronounced relationship with trip distances. As proximity to each successive activity center grows, total PMT continues to drop. Based on correlation coefficients, the strongest relationship with PMT is how far a household lives from the fifth-closest activity center. In that case, households that live within 1 mile of five activity centers travel around 16,330 miles per year—about 56% less than the roughly 37,360 miles traveled by people who live 11 or more miles from the fifth-closest activity center.
All those shorter trip distances translate into direct benefits for households and society. While many factors influence a household’s travel behavior, these results suggest a household living closer to multiple activity centers could easily travel 14,500 fewer miles through the year.7 For the average American driver using a typical car with an internal combustion engine, such a move would save $920 to $1,200 in annual transportation expenses and emit 2,455 to 3,020 fewer pounds of carbon dioxide.8 If there are two drivers and two cars in the household, the savings double. And that’s a conservative estimate: Living closer to more activity centers could easily allow someone to walk and bike more or trade down for a smaller vehicle, further reducing vehicle miles traveled (VMT) and emissions.
It’s difficult to put these benefits into simple environmental comparisons, but consider this: While individuals have little control over manufacturing processes or electricity generation, where one chooses to live and travel is their most significant environmental decision. Living near activity centers could reduce an individual’s transportation-related carbon footprint by roughly 32%. The fiscal savings are much easier to compare: Moving closer to multiple activity centers could leave enough savings to cover the average individual’s annual spending on medical services, a year’s worth of water bills, or four months of food away from the home.
Generally, too few people live near multiple activity centers
The closer a household lives to more activity centers, the greater likelihood they will make shorter trips. Unfortunately, most metropolitan residents do not enjoy those travel-related benefits at scale. We use a 3-mile travel shed to judge proximity, which roughly equals a 15-minute bike ride and is a large enough catchment area to include tens of neighborhoods.
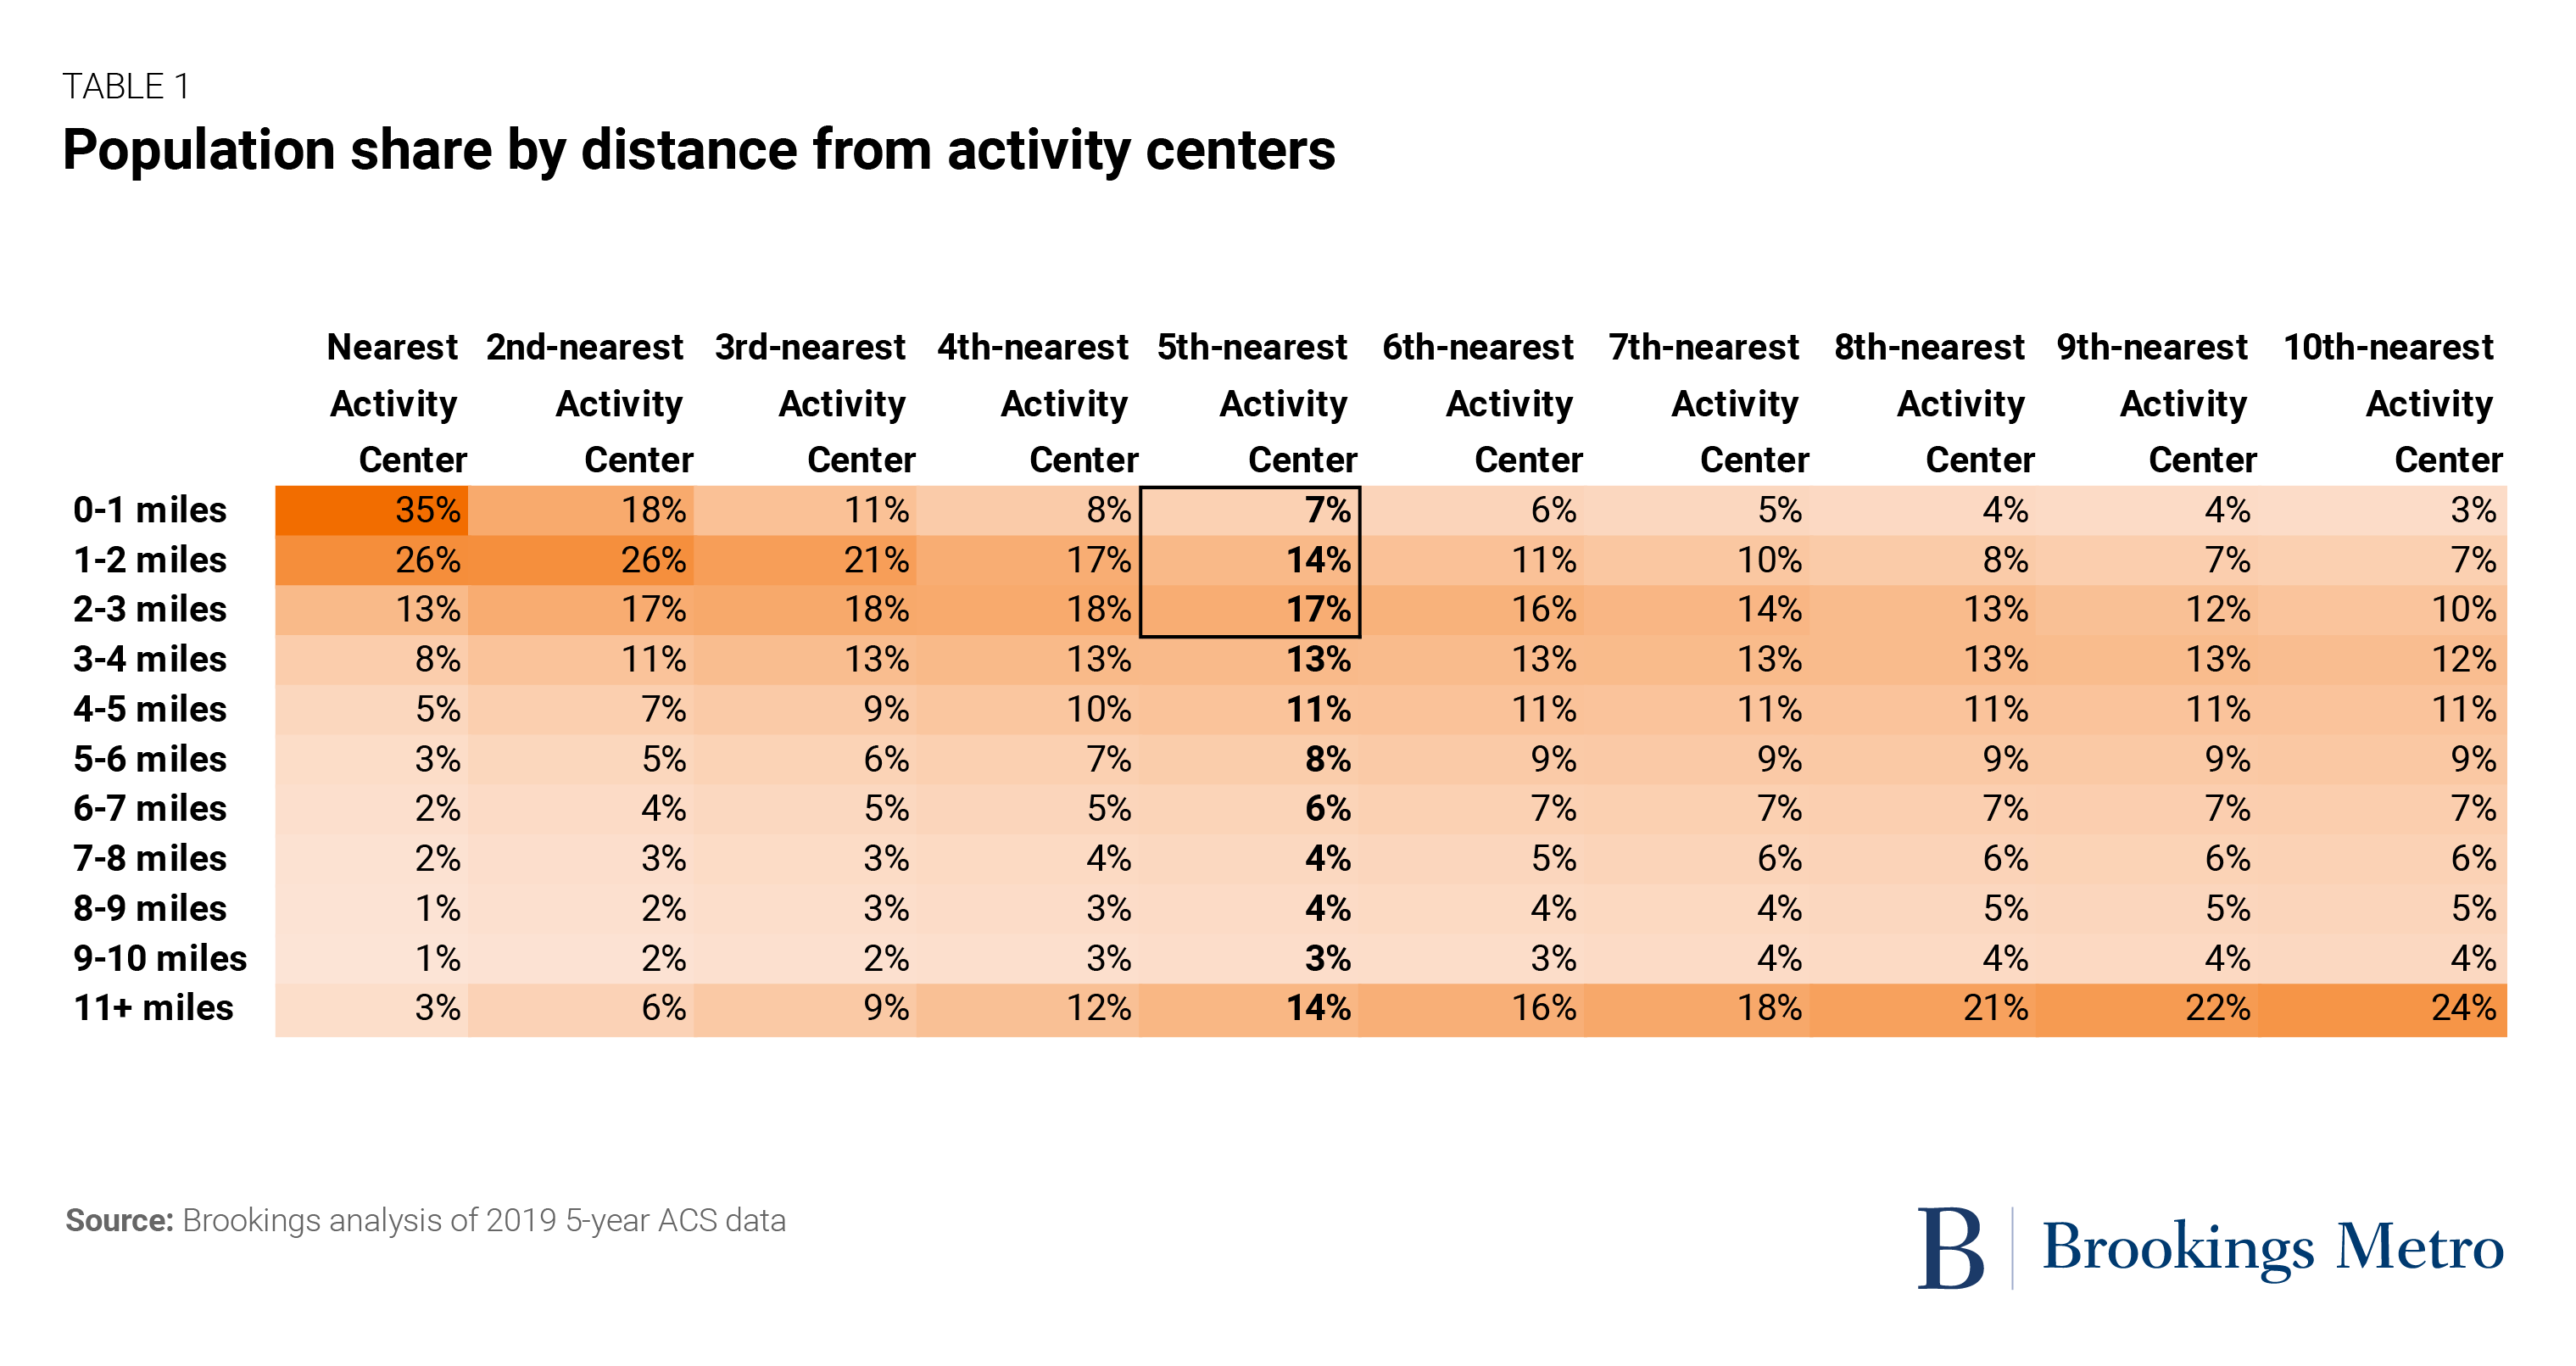
Looking across the 110 metro areas, only 37% of residents—or 82.6 million people—live within 3 miles of five activity centers. This doesn’t mean the other 63% of residents live far away from any activity center. If we measure proximity to just the closest activity center, then 75% of the metro area population studied—or 166 million people—live within 3 miles of one activity center. But as Table 1 shows, as we assess how close people live to multiple activity centers within the same 3-mile threshold, the share of the population steadily drops. And keep in mind that travel benefits are largest when living near greater numbers of activity centers.
Looking across the country, there is enormous variation among the 110 metro areas in terms of how many people live within 3 miles of five activity centers, our standard proximity measure. The highest share is in metro area Los Angeles, where 74% of the population lives within 3 miles of five activity centers. The lowest share is in Charleston-North Charleston, S.C., where only 9% of the population lives within 3 miles of five activity centers. In the case of Charleston, there simply isn’t enough housing near the region’s two big activity clusters: the colonial central city and North Charleston.
The case of Los Angeles is especially interesting. All across this California metro area, there are clusters of multiple activity centers either adjacent to or within a half-mile of each another. It’s simply hard to live in metropolitan Los Angeles and not live near a few—if not five—activity centers. However, even with relative proximity, Los Angeles is still an enormous metro area that’s famously built for the automobile, both in terms of highway miles, parking availability, and inhospitality to pedestrians. The metro area offers proximity, but the quality of its transportation connections between neighborhoods—plus general cultural attitudes around driving to far-off neighborhoods—may be off-setting the benefits of proximity.
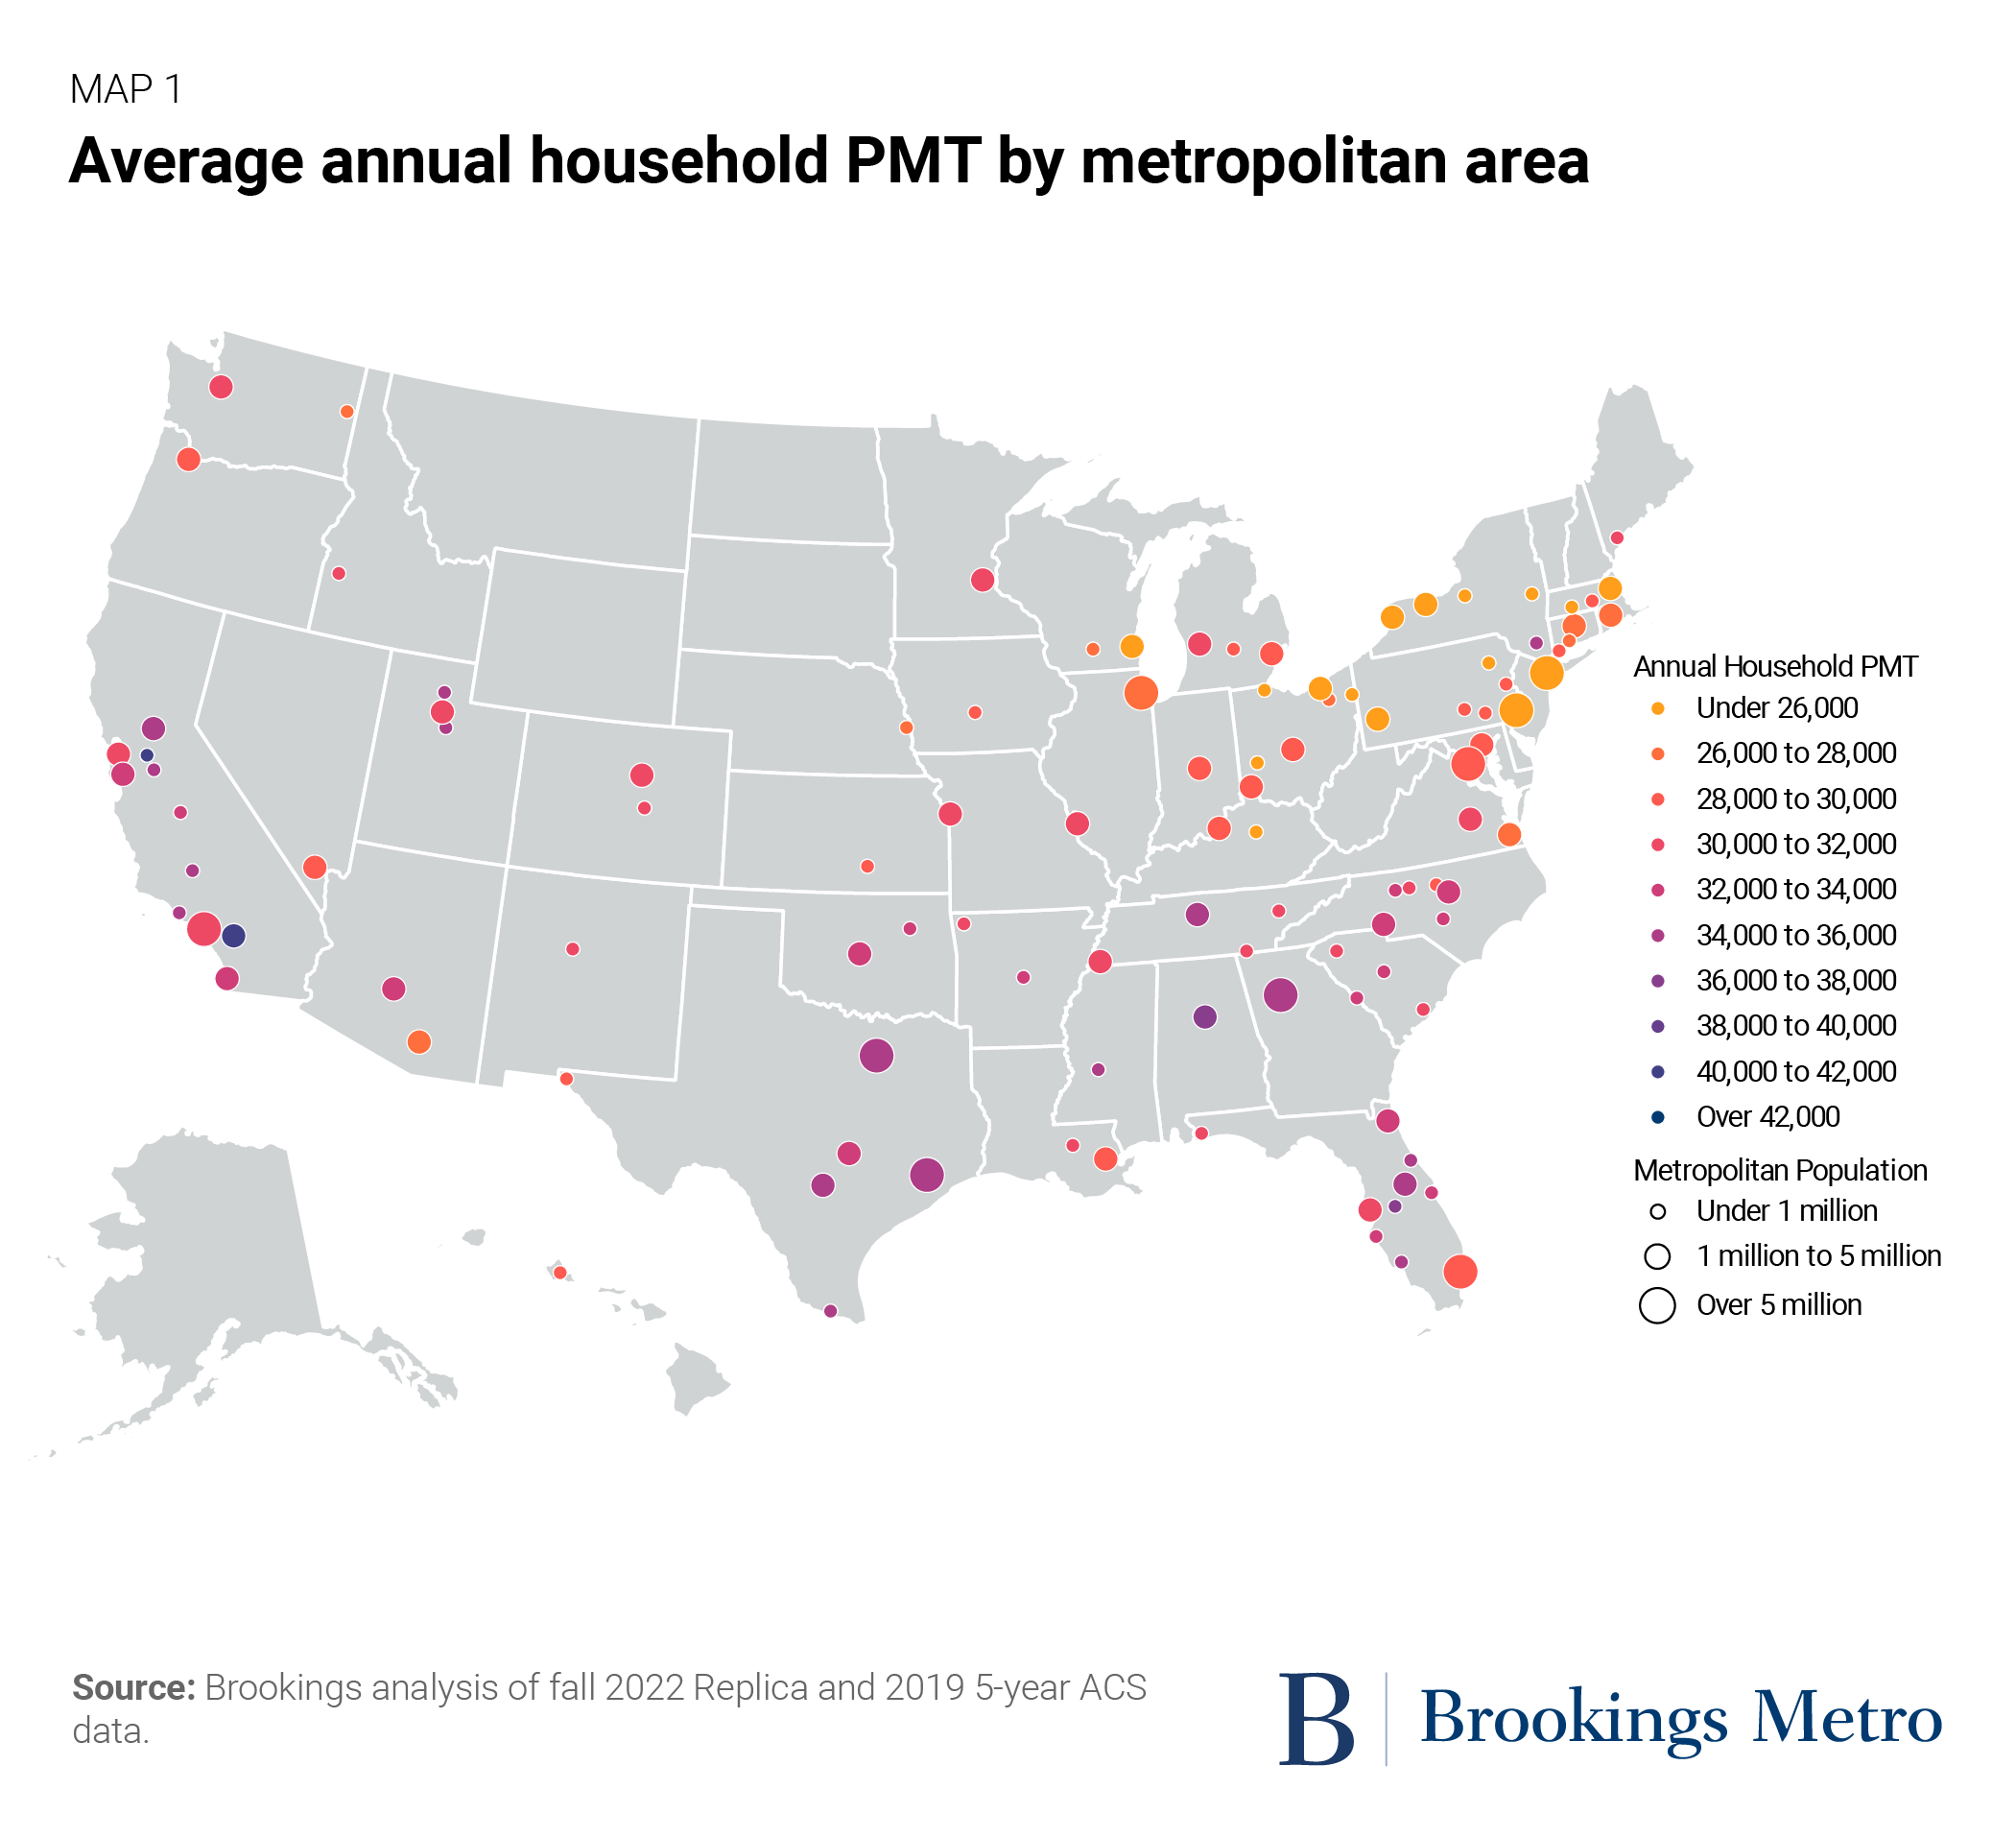
Considering the different demographic characteristics, settlement patterns, and natural geography across the 110 largest metro areas in the United States, it’s not surprising that travel distances vary by place. While the average household travels roughly 29,909 miles in a year, the metro area average ranges from 21,433 miles in metropolitan New York to 41,046 miles in Riverside, Calif. Residents of older, coastal metro areas typically travel less—and tend to live closer to more activity centers—than their peers in faster-growing, more automobile-oriented metro areas in the Sun Belt. Florida is somewhat of an exception, although the lower PMT likely has more to do with their number of retirees who do not commute. Not coincidentally, these patterns of total trip miles roughly follow national patterns of which metro areas’ residents register the most vehicle miles traveled (VMT). 9
Residents of every metro area studied experience travel benefits from living near activity centers
Regardless of a metro area’s overall trip mileage, there is a consistent benefit to living closer to more activity centers. In fact, living close to multiple activity centers is associated with shorter trips in every single metro area studied here, from the densest to the most sprawling.
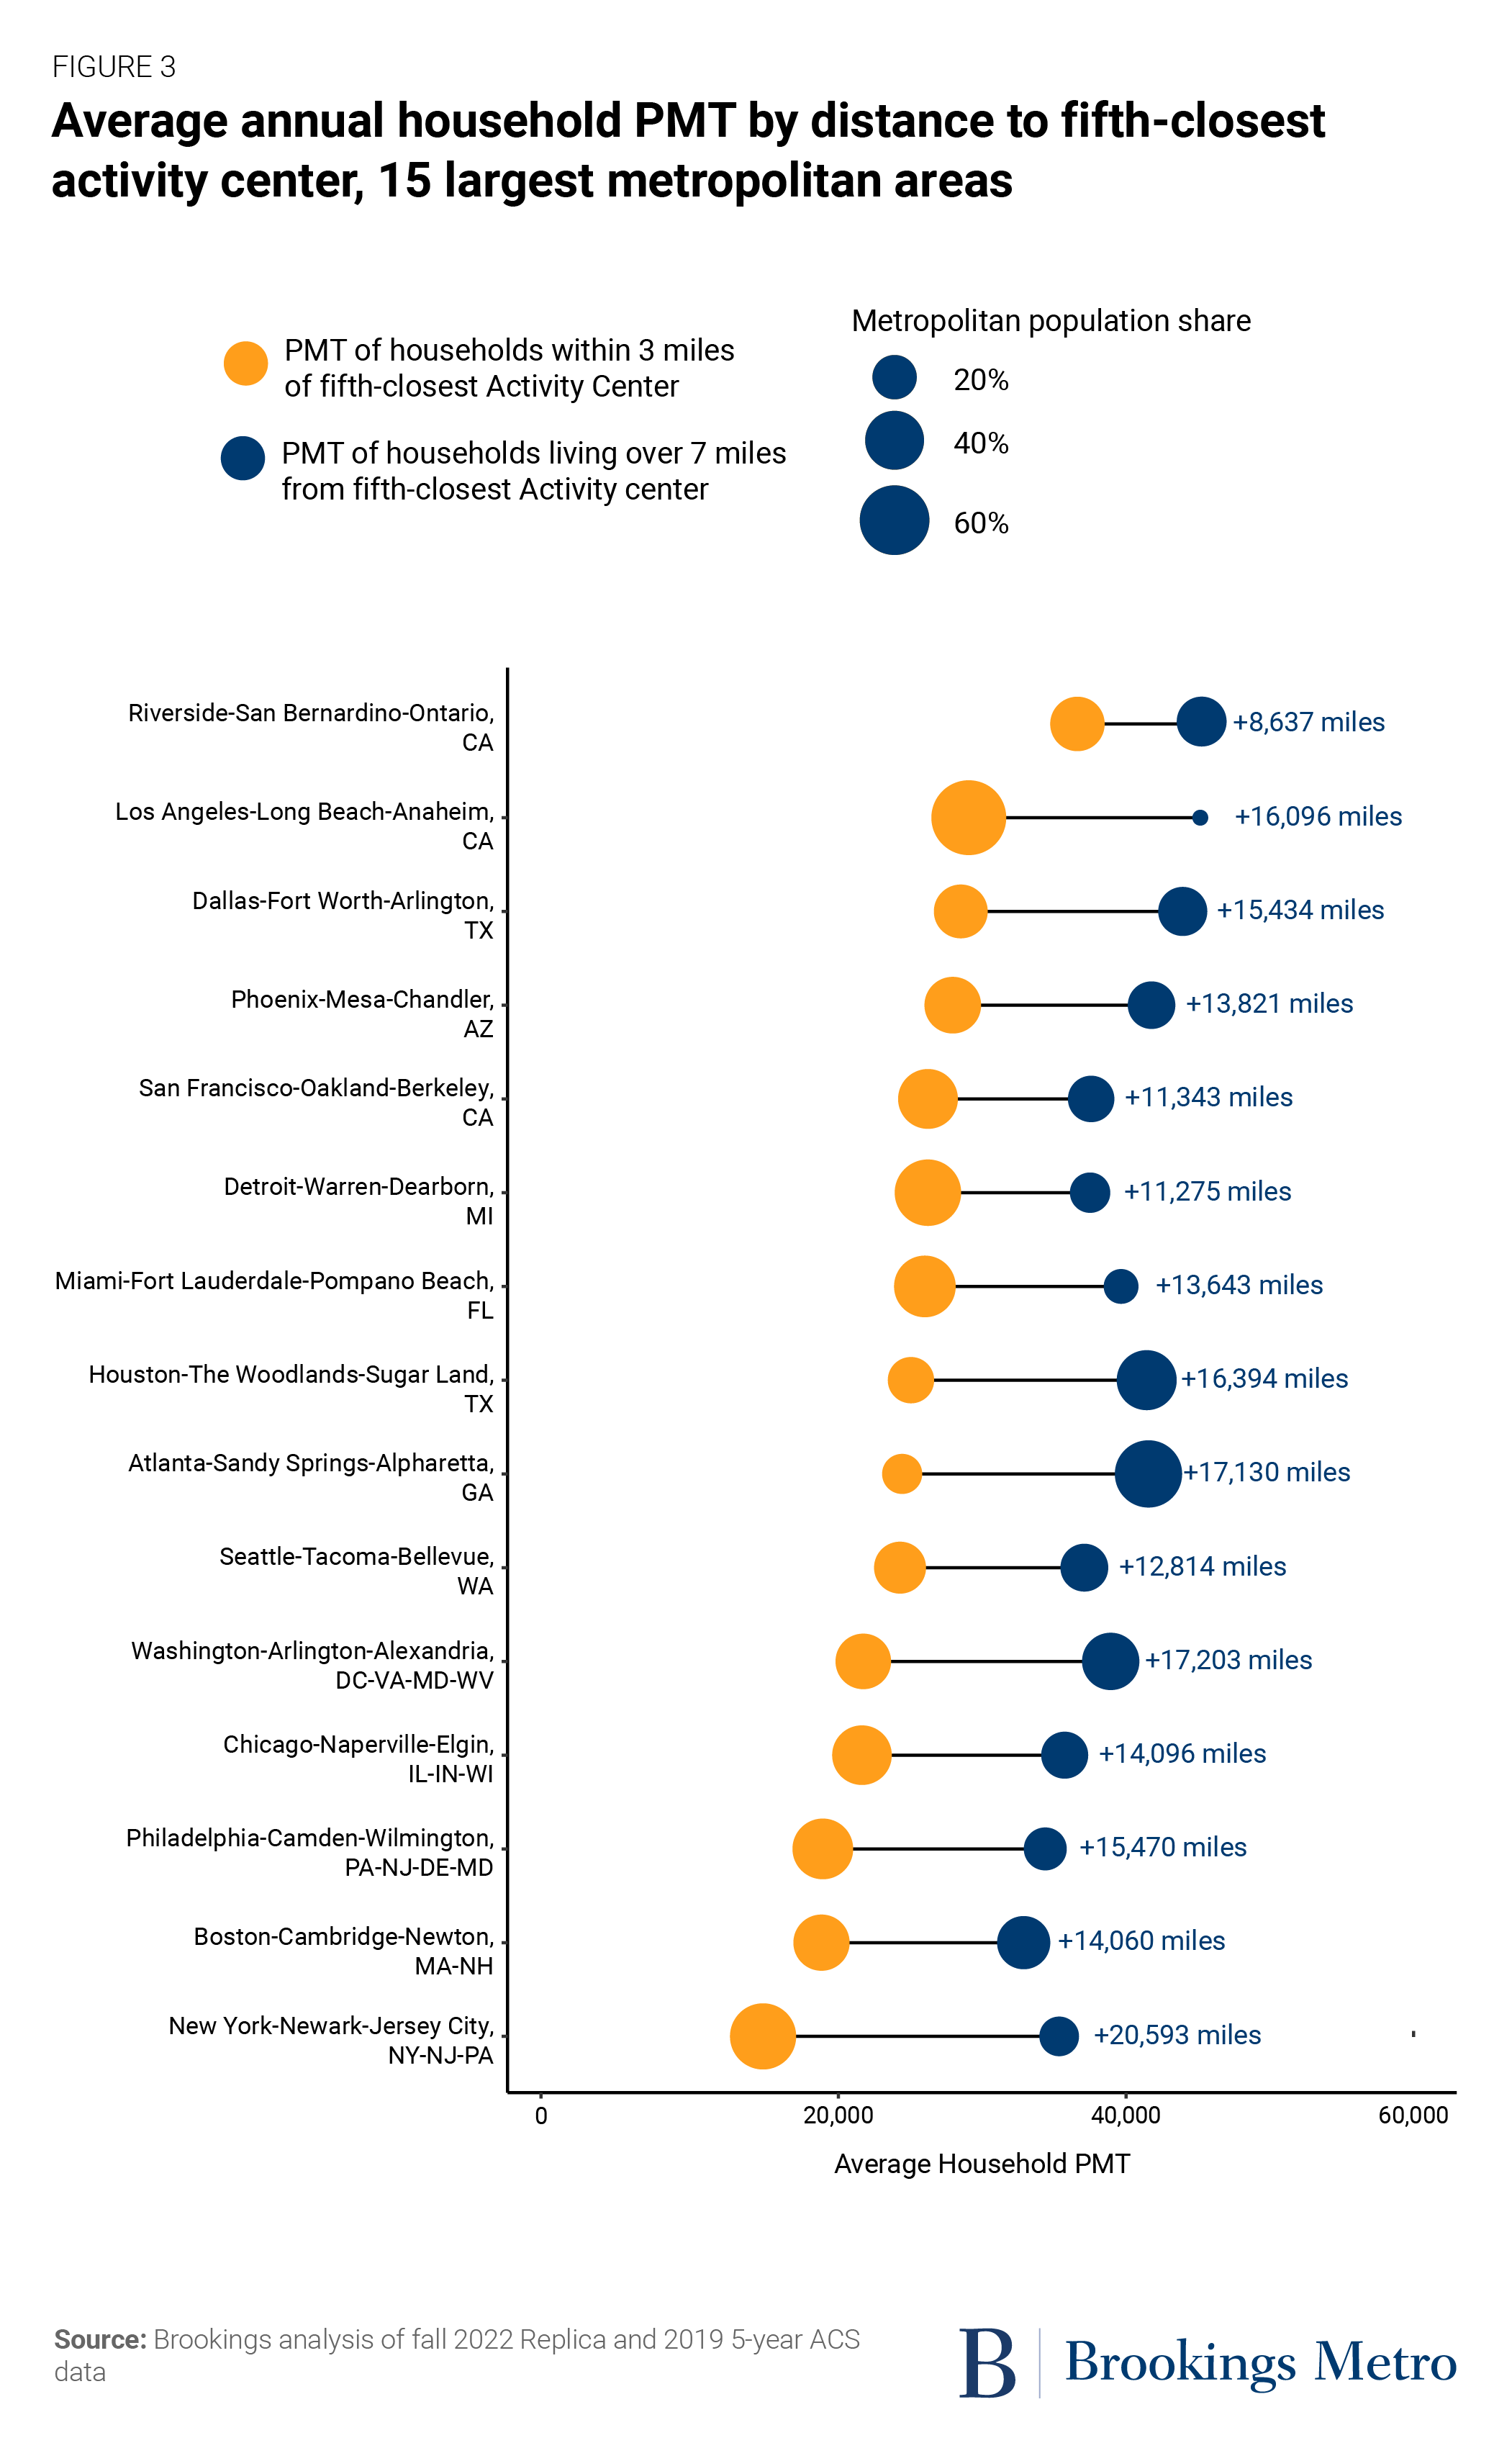
Compare the spread between those who live within 3 miles of five activity centers versus those who live at least 7 miles away from five activity centers. The increase in proximity is associated with anywhere from a 15% (Stockton, Calif.) to 58% (New York-Newark-Jersey City, N.Y.-N.J.-Pa.) difference in the total miles traveled annually. In terms of nominal mileage, these differences can amount to anywhere from 6,400 to nearly 25,770 fewer miles traveled for those living closest to five activity centers.
We can see these results when zeroing in on the 15 largest metro areas by population (Figure 4). While the general ranking looks much like the national PMT map in Figure 3, there is a constant mileage split between household travel based on their proximity to multiple activity centers. Whether in Washington, D.C. or Dallas, there are huge travel advantages to living close to economic, civic, and cultural hubs. Yet it’s the share who lives within these proximity bands that tells us much about average PMT for the entire metro area.
These metropolitan differences also underscore how significant—and variable—the environmental and fiscal savings can be from living closer to multiple activity centers. In metro areas anchored around cities such as Philadelphia, Denver, Tucson, Ariz., and Milwaukee, households could see their PMT fall between 40% and 50%. If it’s a two-car household, that’s akin to taking an entire car off the road—including its emissions and costs to own and operate.
It’s also important to note that these mileage differences don’t just apply to those living closest to the urban core and traditional downtowns. Suburban residents who live close to multiple activity centers also tend to travel much shorter distances than those without the same kind of economic proximity.
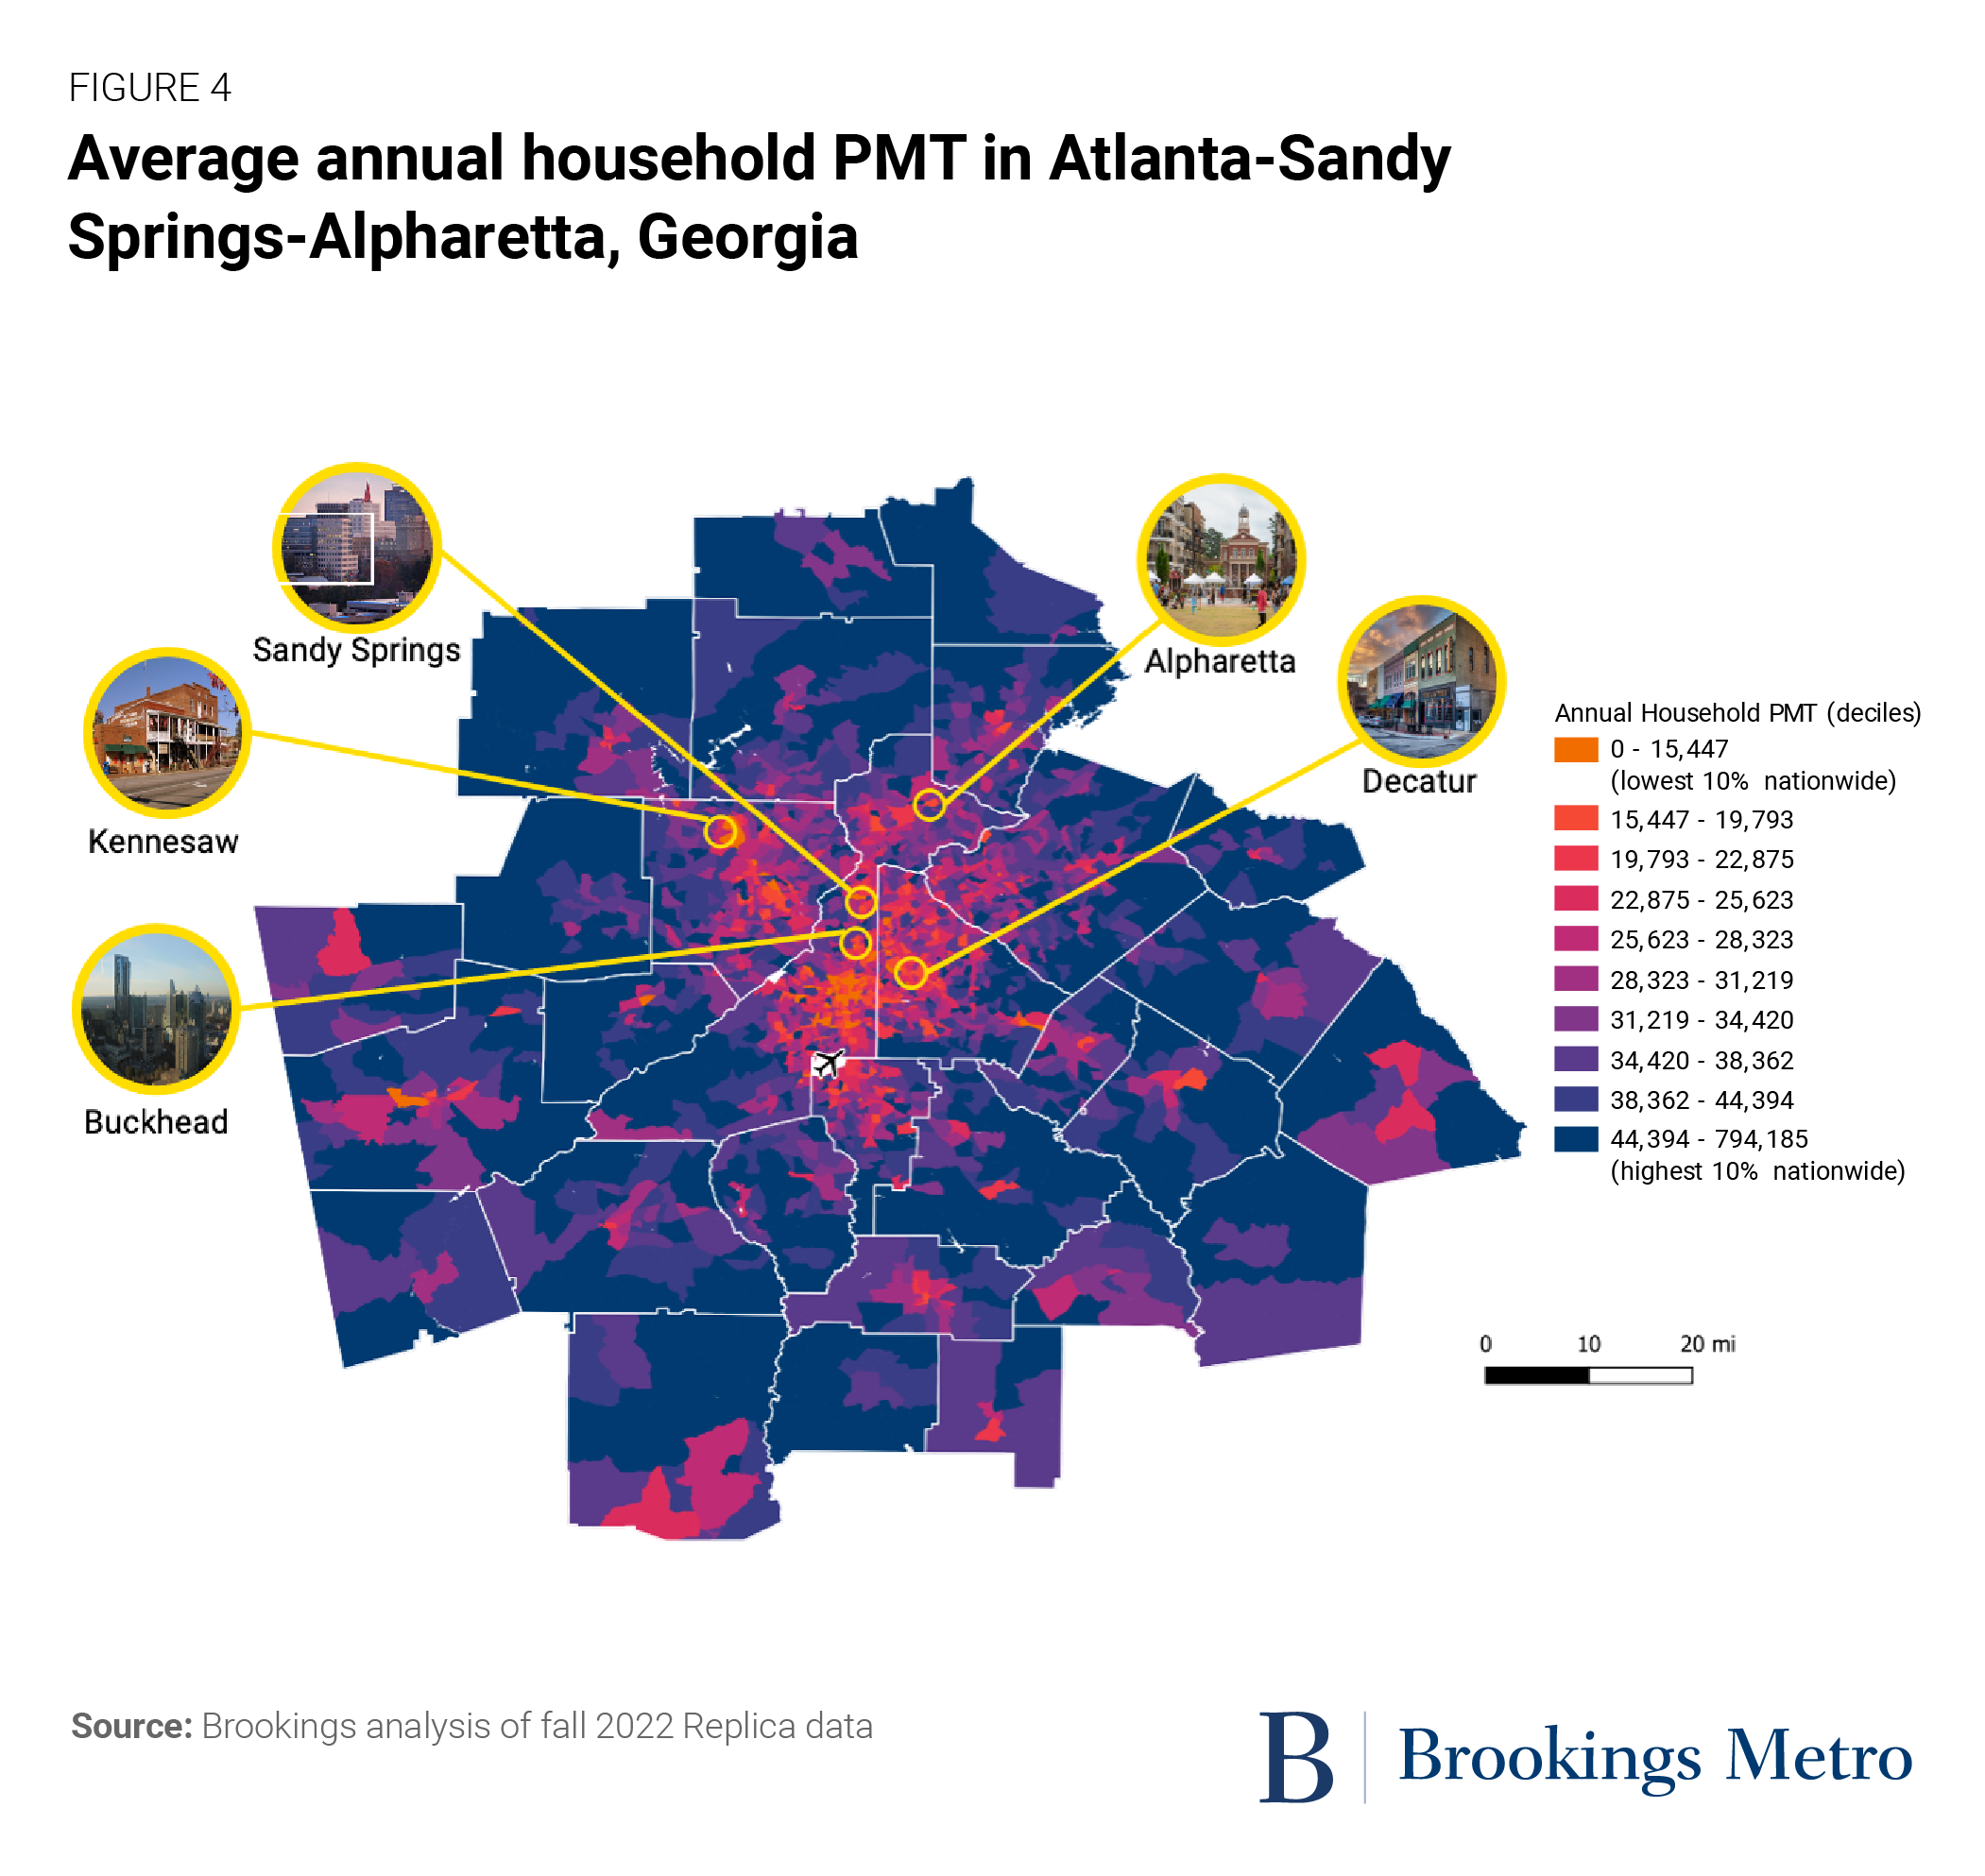
The Atlanta metro area may best encapsulate all these trends at once. The Georgia capital registers the sixth-highest overall household PMT among the 110 largest U.S. metro areas. Yet when comparing neighborhoods within the metro area, those living near five activity centers travel over 40% less, and the map below bears this out. As expected, some of the lowest PMT levels come from neighborhoods near downtown and Midtown in the urban core, which are also home to a dense cluster of activity centers. Many residents of other older areas with multiple activity centers—Buckhead (which is within Atlanta city limits), Decatur, and Sandy Springs—travel similar distances. But even in many of the fastest-growing, asset-rich suburban locations—such as Kennesaw and Alpharetta, both of which are more than 25 miles from downtown Atlanta—PMT is far lower than other suburban locations. Still, Atlanta’s most proximate neighborhoods are home to only 16% of the metro area’s population; prioritizing growth in these areas is an ideal lever to reduce the metro area’s overall travel distances.
The relationship between proximity to activity centers and travel distances is strikingly consistent over time
So far, the data presented in this report summarizes travel habits during fall 2022. That period marked a time when the national economy had generally re-opened following the pandemic and—with the notable exception of transit trips—national travel statistics such as vehicle miles traveled and the number of domestic airline passengers had also returned to near pre-pandemic levels. Yet with many economic activities still upended (particularly, sustained levels of telecommuting and e-commerce), there is a real question as to whether proximity to activity centers plays a similar role in the pre- and post-pandemic environment.
The short answer is yes. Whether looking at 2019 or 2022, living closer to more activity centers is consistently associated with fewer miles traveled. In other words, proximity was powerful before the pandemic, and it continues to be powerful after it.
This consistency is seen most clearly when comparing average household PMT to activity center proximity in 2019 and in 2022 (Figure 6a and 6b). The two charts almost perfectly overlap, and show almost no difference between the two years. This is striking considering how much underlying transformation took place between the two periods. There is even a subtle intensification of proximity’s travel benefits in 2022; households living within 3 miles of multiple activity centers traveled a bit less that year, and households who lived more than 7 miles from multiple activity centers traveled a bit further.
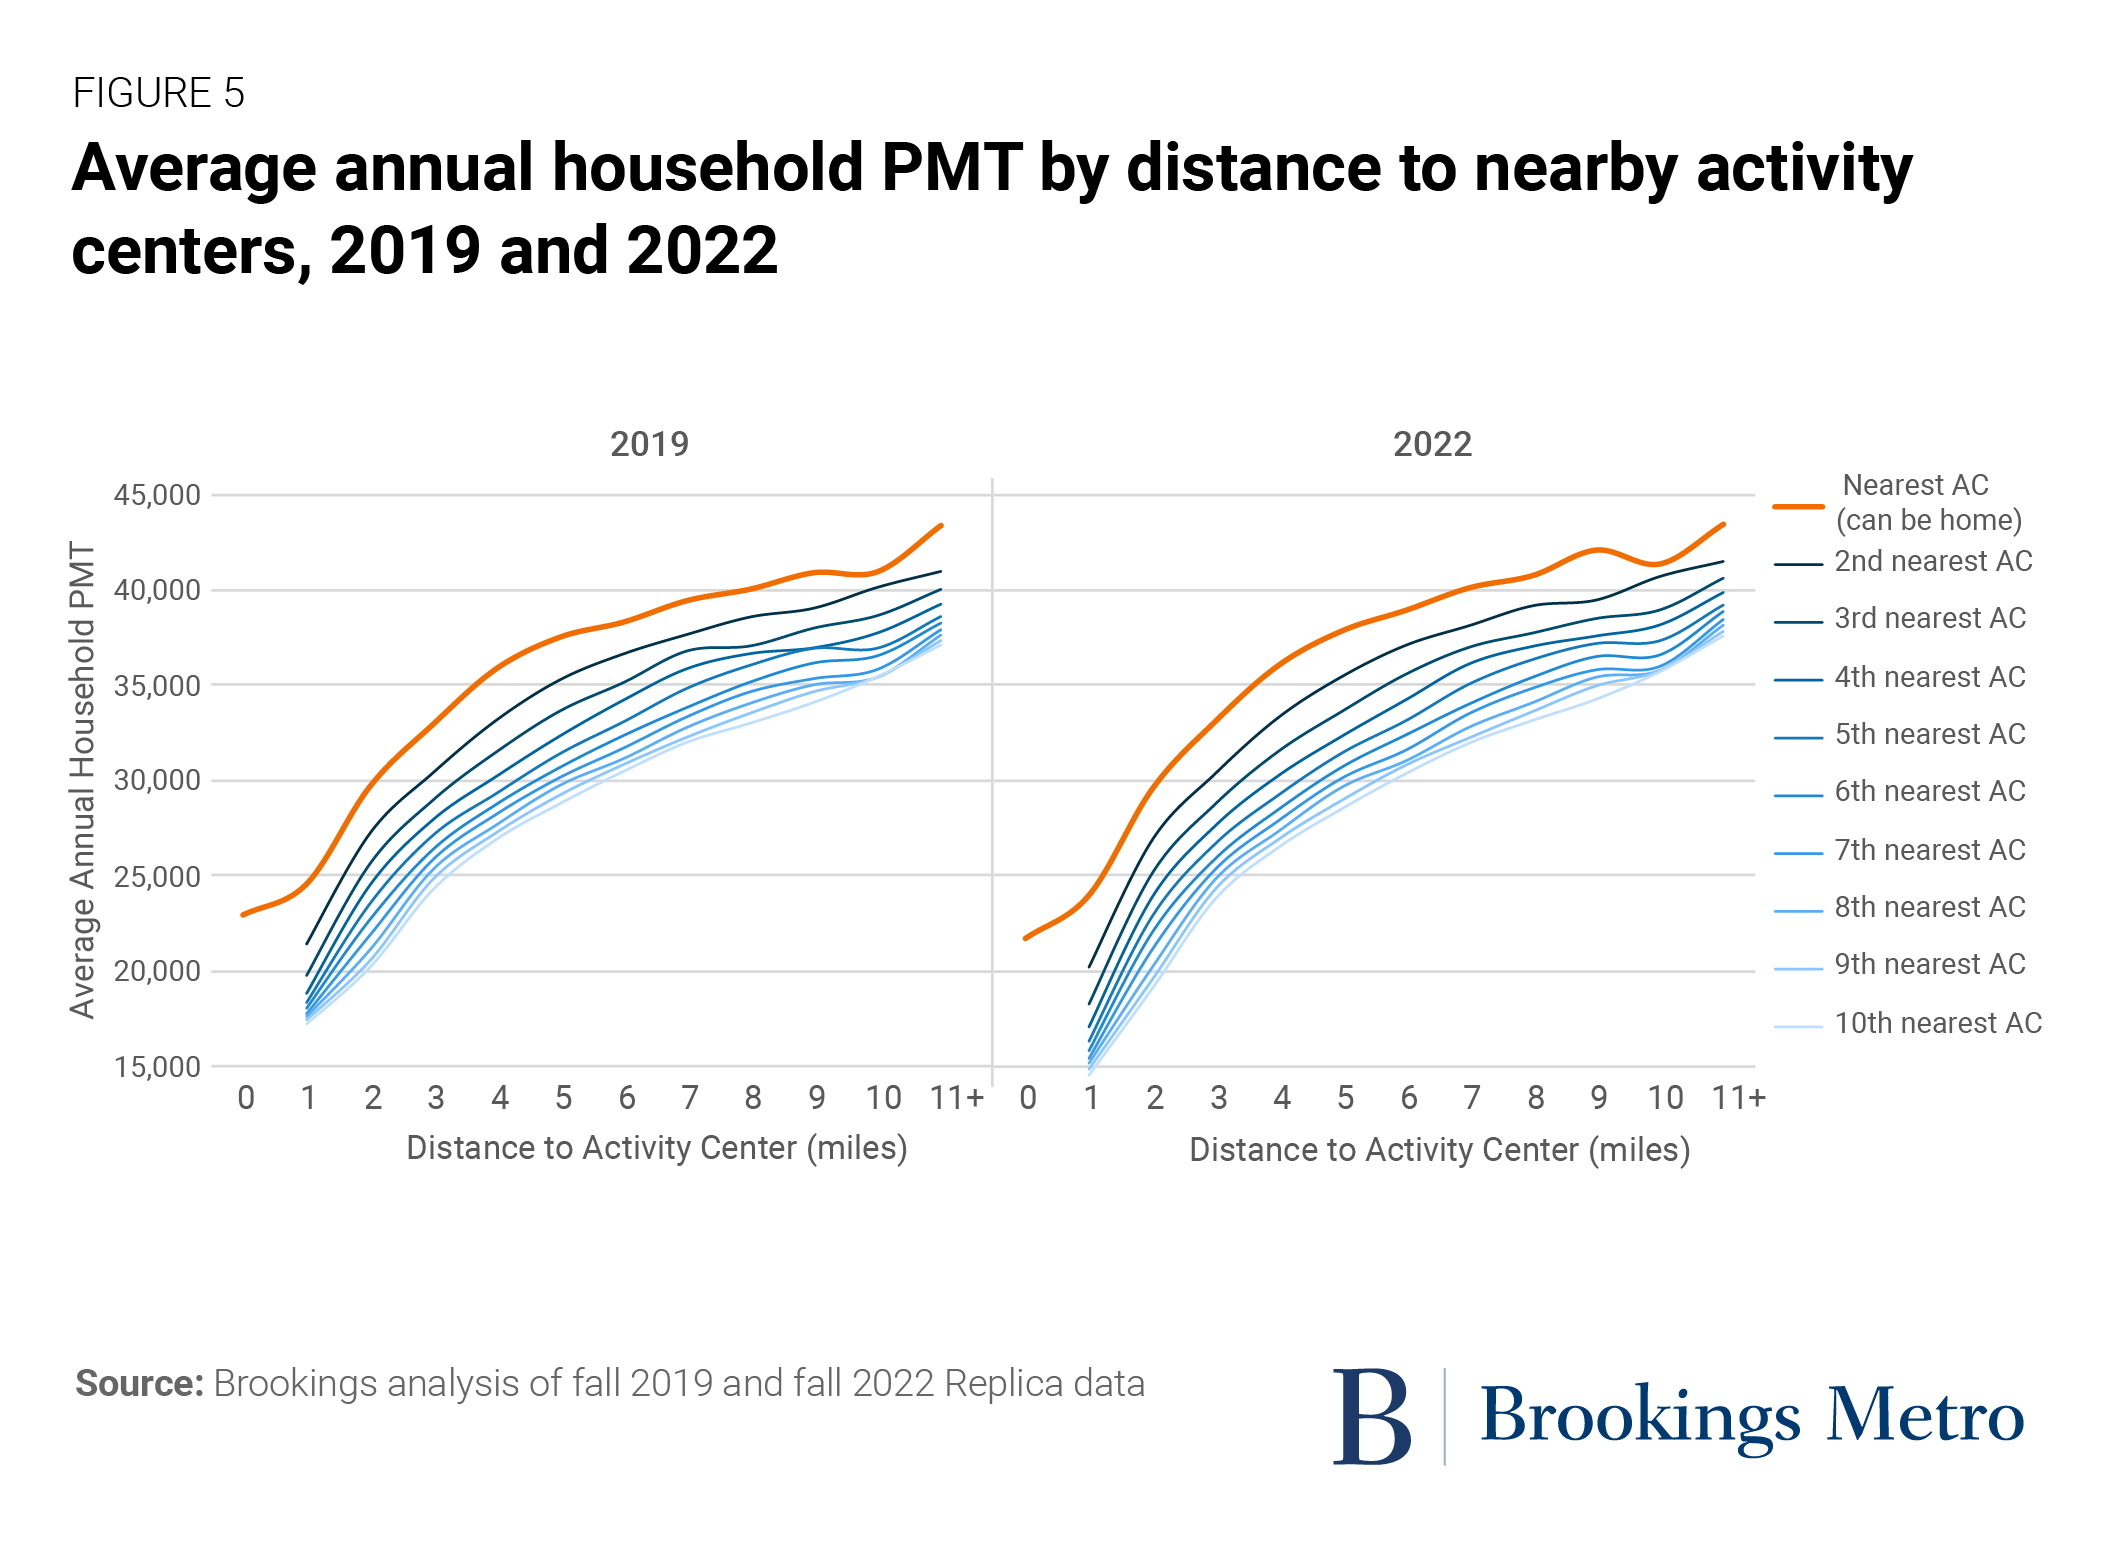
The geographic ubiquity of proximity’s relationship to travel behavior was also consistent across the three-year period. In both 2019 and 2022, residents of all 110 metro areas traveled much shorter distances when they lived within 3 miles of five activity centers compared to residents who lived 7 or more miles away.
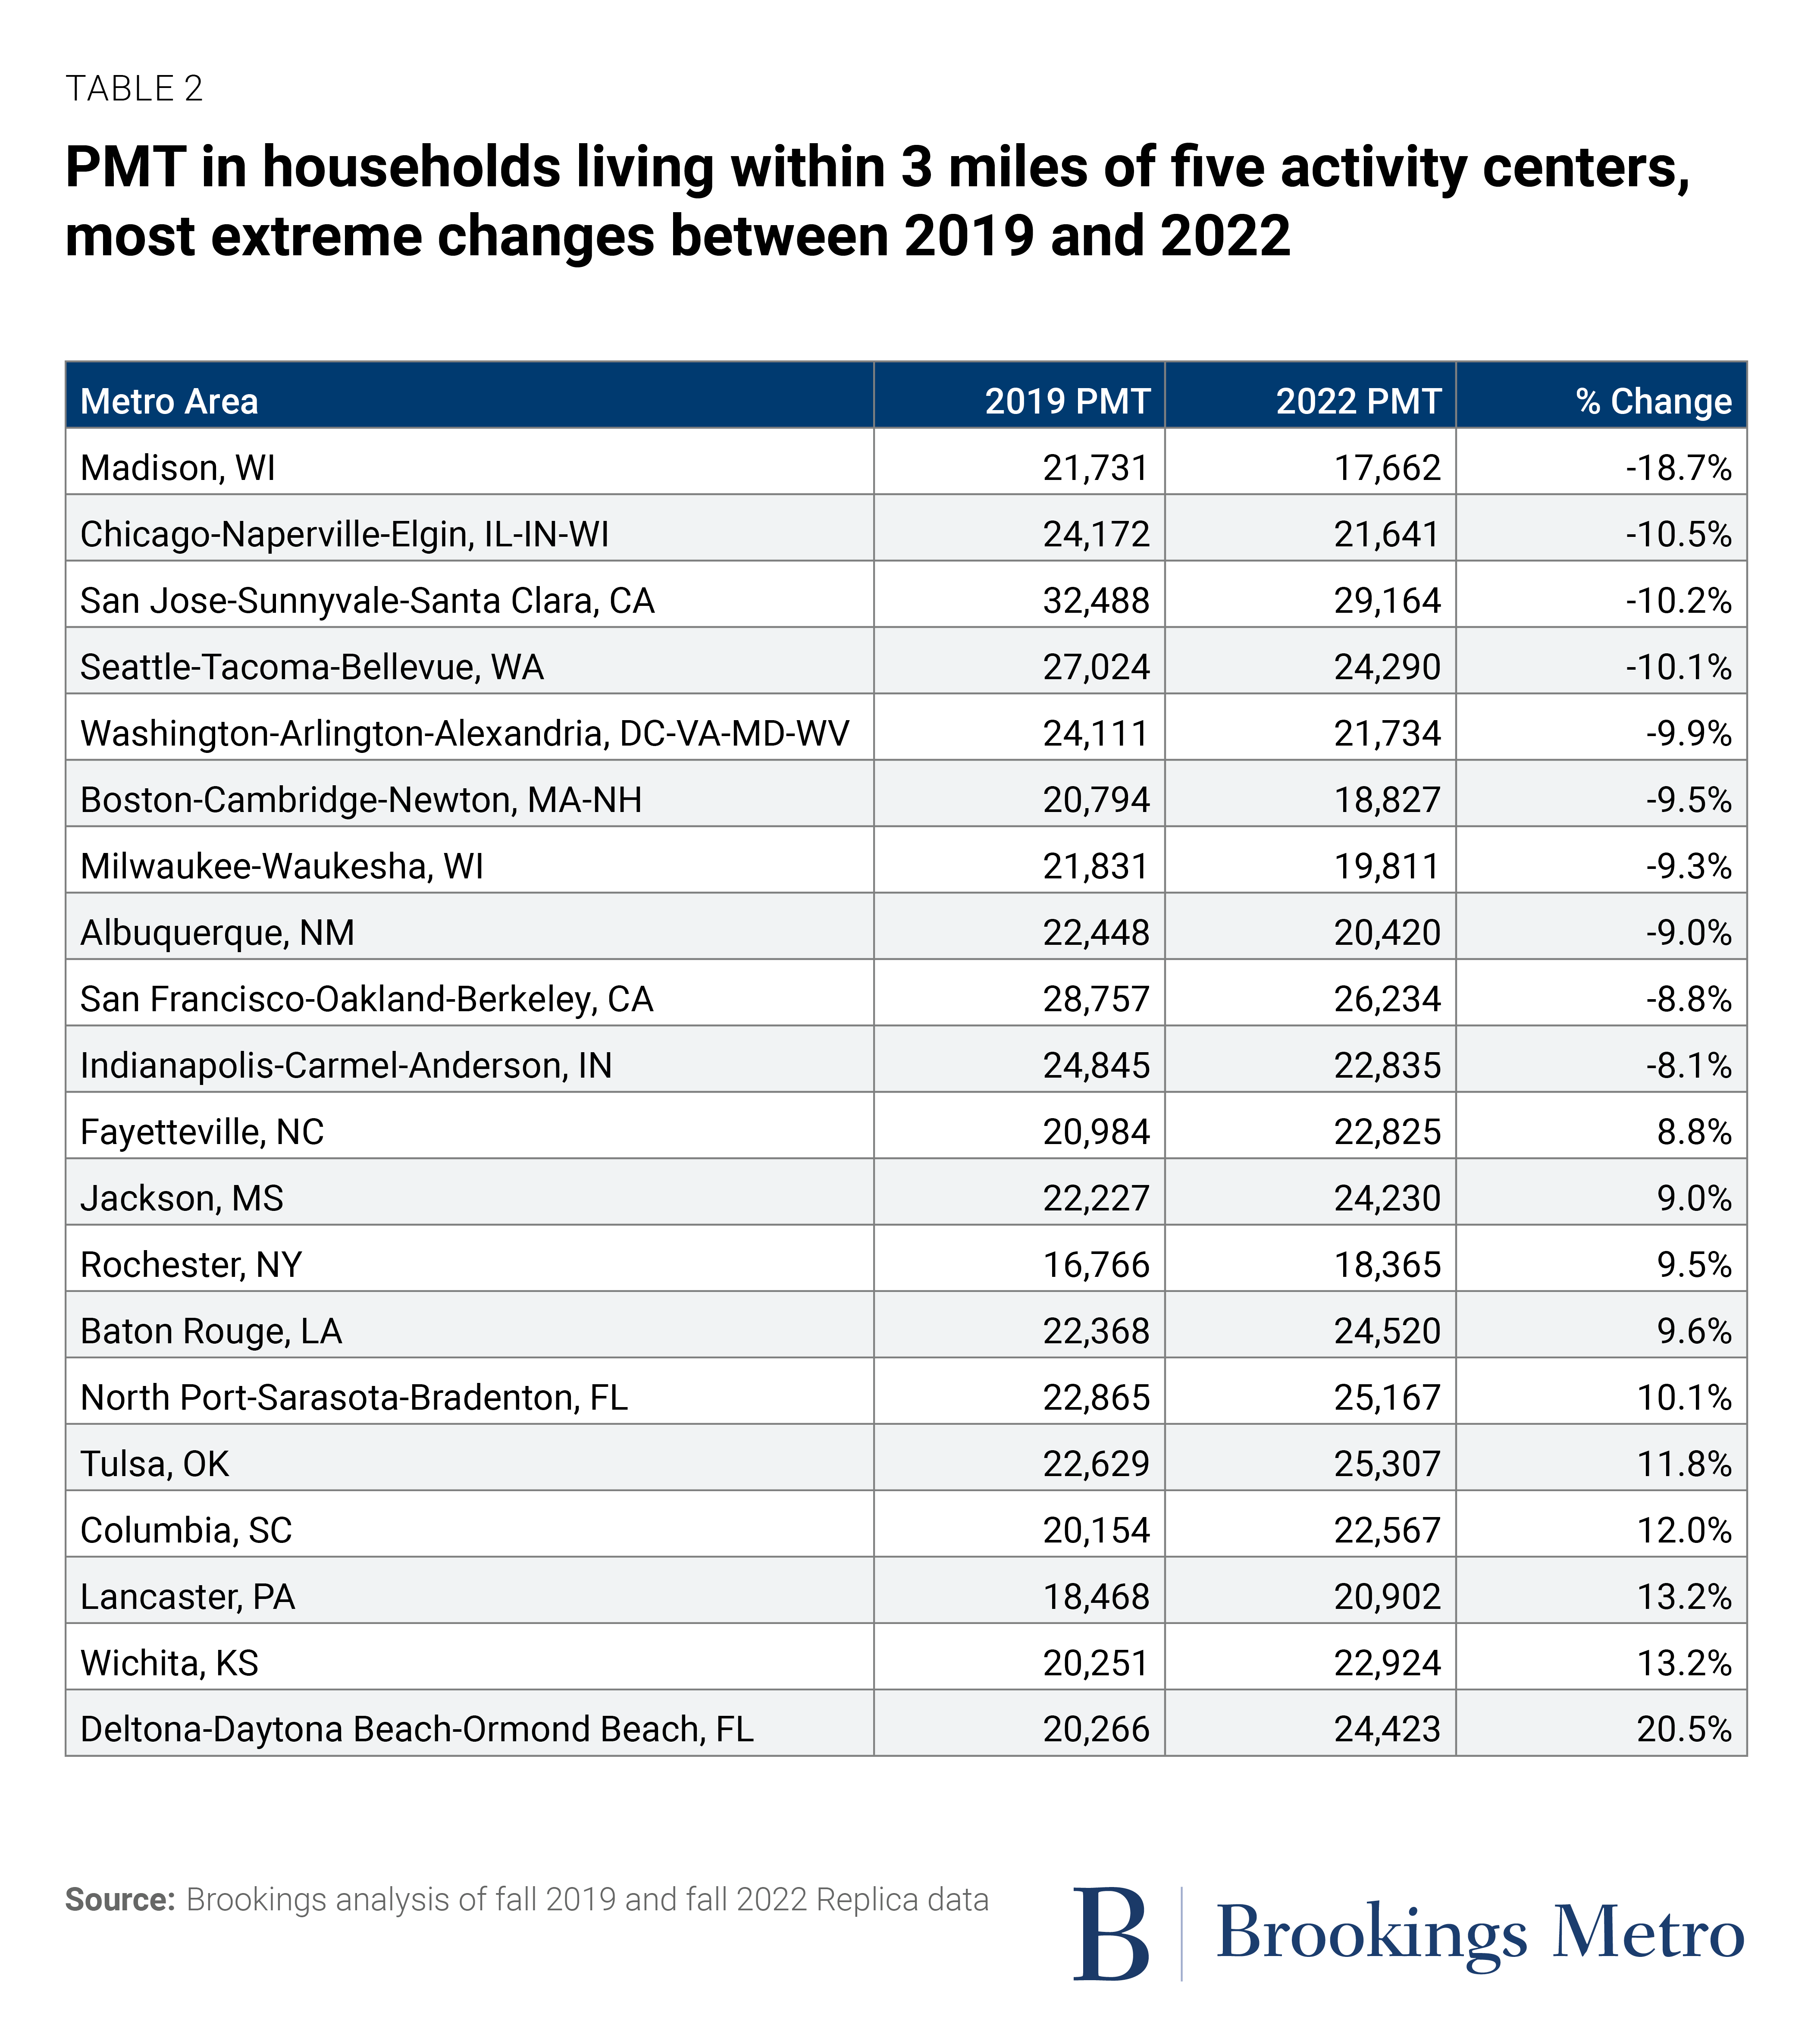
While the aggregate levels were consistent, individual metro areas did experience large changes in household travel behavior between the pre- and post-pandemic periods. Even just looking at households that lived within 3 miles of five activity centers, annual PMT numbers often changed by thousands of miles in each direction. Generally, PMT drops were largest among the densest coastal metro areas, state capitals, and many of the largest Great Lakes metro areas. PMT increases, on the other hand, mostly took place in southeastern metro areas and less dense places. Table 2 summarizes the most extreme examples.
Even though the general trend lines held, the level of variation among metro areas confirms that the pre- and post-pandemic periods should be studied in greater detail. Impacts related to trip-chaining, telecommuting, downtown job concentration, e-commerce, and residential mobility are just some of the forces that are likely to impact different metro areas in different ways. Still, even with those forces impacting behavior for three years, one core pattern did not change: Proximity to activity centers is consistently associated with shorter trips.

The American economy, society, and natural environment would all benefit from a sustained reduction in people’s total miles traveled. Americans simply travel too far, using cars too often. National trip distances easily exceed global economic peers, leading to far higher pollution rates and transportation-related injuries while costing consumers more in transportation expenses and leaving them with little transportation choice. The society-wide math doesn’t add up.
Fortunately, policymakers and practitioners don’t need to look far to find evidence for how to reduce miles traveled. Every metro area in the country includes clusters of activity centers and residential neighborhoods where people of all incomes, races, and ethnicities travel shorter distances. The problem is that metropolitan America simply houses too few people near these mixed-use clusters. Human-scale proximity is in short supply.
Thus, if a national goal is to reduce miles traveled without negative economic impact, the core implication of this report is fairly straightforward: Transportation practitioners, land use planners, and real estate developers need to give more people the option to live closer to multiple established activity centers. People need greater housing choice to unlock greater transportation choice. But achieving such outcomes won’t happen overnight—it will require steady work around the following two complementary principles.
First, local officials, state policymakers, and practitioners need to promote more development within activity centers and the neighborhoods surrounding them
To start, the nation must build more housing and other development in neighborhoods within 3 miles of an activity center (or, ideally, multiple activity centers). If current land use policies such as zoning or permitting processes are too restrictive, they should be liberalized to streamline construction of denser housing—from missing middle designs such as townhomes and garden apartments to larger multifamily buildings where appropriate. If financing is an issue, public officials should work with local investors, underwriters, and insurers to experiment with incentives and reforms such as land value taxes and well-designed tax abatements to help funnel and accelerate capital flows to prioritized locations.
Transportation officials should complement the housing approach by promoting connectivity within neighborhood clusters and between adjacent ones. American neighborhoods need more protected bike lanes, well-maintained sidewalks, and slower vehicle speed limits to make pedestrian travel safer and more pleasant. Transit prioritization such as bus-only lanes and investing in more frequent transit service—combined with reduced parking—will make shared modes a more attractive choice. Making such investments will often require new design standards and tax policies, but can unlock greater transportation choice, lower emissions, and safer streets.
Second, local and state officials need to be more cautious when planning and approving greenfield and single-use development
Our PMT-related findings are just another confirmation of Jane Jacobs’ timeless call for mixed-use districts. When residential neighborhoods are isolated from other economic activities, trip distances grow longer and vehicle use goes up. That hard, fixed truth should give public officials pause before they greenlight roads, neighborhoods, or activity centers that reduce transportation choice, including limited-access highways and communities with few entrances and exits. Once those roads and places are built, the assets and associated land uses are locked in for generations, or will demand expensive retrofits.
Fortunately, most localities and states have the policy tools to dissuade such investment, particularly through more accurate pricing. Transportation and water utility officials can impose impact fees to correctly price the cost of building and maintaining new roads and water infrastructure. If designed well, such impact fees can protect current residents and businesses from subsidizing new development elsewhere. State and local environmental officials can use water rights and open space laws to disincentivize investment in climate-insensitive locations. States and localities should also review tax laws to ensure they don’t overly promote automobile-dependent commercial sites such as large lot retailers.
Of course, none of this will be easy
Political economy will often favor the status quo: rules that favor high-speed roads instead of complete streets, an absence of impact fees to discourage greenfield development, and byzantine regulations that dissuade denser housing and commercial development. Practitioners have struggled to map long-term costs such as roadway maintenance to local tax revenues, making it harder to understand fiscal burdens. Many regions do not even have a common understanding of their economic geography, including maps of activity centers and which interventions make the most sense given local and regional conditions.
Then there’s the general cultural current around vehicles. Generations of Americans have lived in an automobile-centric environment and used their cars for most trips. Convincing them to approve a local built environment that makes it harder to drive—not just to bike and ride transit when they’re on a vacation in New York or a European city—will be a tall task, despite the cost, climate, and quality of life benefits. Still, if practitioners only plan for electric vehicles and not proximity, it will be difficult to change those generational patterns. Markets keep telling us people and investors want more proximate neighborhoods; this research affirms the benefit of giving people the transportation choice such neighborhoods afford.
American travel habits are a problem. With Americans deeply committed to private vehicles and traveling long distances at high speeds, the transportation sector is now the country’s leading source of greenhouse gas emissions, represents a top cause of bodily harm, and requires an overly expensive infrastructure to maintain. And the more we build neighborhoods and metro areas to serve this travel and housing model, the harder it will be to undo our habits.
These findings point toward a promising, more universal solution than just electrifying our vehicles: shifting development to promote proximity within and around established activity centers. People who live near multiple activity centers not only travel far fewer miles—enough to make a massive dent in transportation-related emissions even if people still drive—but those kinds of neighborhoods naturally support more mixed housing types, promote safer streets, and reduce household expenses through greater transportation choice.
Learning both from our international peers and pockets of each U.S. metro area, the next step for policymakers and their private sector peers is to deploy rules that promote shorter-distance trips and proximity at the same time. The opportunity is nothing short of greater sustainability and shared prosperity for all.
Authors


-
Acknowledgements and disclosures
Brookings Metro would like to thank the Anne T. and Robert M. Bass Foundation and the San Diego Foundation for their generous support of this analysis, and the Metropolitan Council, a network of business, civic, and philanthropic leaders that provides both financial and intellectual support for the Program.
The authors would like to thank the following colleagues for providing valuable insights and critiques on early versions of the analysis and report: Alex Berke, Geoff Boeing, Joe Cortright, Joseph W. Kane, Sarah Kaufman, Tracy Hadden Loh, Beth Osborne, Jenny Schuetz, and Jennifer S. Vey. The authors would also like to thank the following colleagues for valuable support in producing the report and contributing to outreach efforts: Michael Gaynor, David Lanham, Leigh Balon, and Erin Raftery. Thank you to Carie Muscatello for layout and design, and Alec Friedhoff for website design and production.
-
Footnotes
- Activity centers are evaluated at and correspond to census block groups.
- Source: Authors’ calculations based on Census Bureau data. For a longer description of land use and transportation context, see: https://www.brookings.edu/research/we-cant-beat-the-climate-crisis-without-rethinking-land-use/.
- Source: United States Department of Transportation, National Household Travel Survey. Note urban land transformation is not the sole reason PMT grew. For example, increasing labor force participation among women is just one other reason for growing travel distances.
- Source: American Community Survey, 2021 1-year Estimates
- Replica makes use of Census Bureau data, plus their own records, to construct population counts and related demographic information. Throughout this report, we make sure to note when we use Census Bureau or Replica demographics.
- The 2017 NHTS found Thursdays and Saturdays to account for approximately 30.3% of weekly person miles. We divide the sum of Thursday and Saturday person miles by this percentage to calculate total weekly person miles, then multiply the percentage by 52.1428571 to aggregate to annual PMT. The 2017 NHTS found a national average annual household PMT of 36,302 miles—slightly higher than the 29,909 average annual household PMT we find for 2022, with a sample limited to the 110 largest metropolitan areas.
- Comparing the difference between a household that lives 7 or more miles from the fifth-nearest activity center to one that lives 3 or fewer miles.
- Assuming 73% of a driver’s personal travel takes place in a vehicle per the 2017 NHTS, cost and emissions savings ranges are calculated for a widely purchased 2018 model year sedan and SUV. Savings are extrapolated from changes in vehicle lifespan, maintenance costs, fuel use and costs, and purchase costs following assumptions and methods used by the Alternative Fuels Data Center’s Vehicle Cost Calculator. See appendix for full set of estimation assumptions and methods.
- In 2019, there is a 0.54 correlation between individual PMT in each metropolitan area and the VMT per capita in each corresponding urbanized area. Note these are not the same transportation or geographic definitions and merit further exploration. For more on VMT trends in the U.S. broadly, see: The Road…Less Traveled: An Analysis of Vehicle Miles Traveled Trends in the U.S.
The Brookings Institution is committed to quality, independence, and impact.
We are supported by a diverse array of funders. In line with our values and policies, each Brookings publication represents the sole views of its author(s).