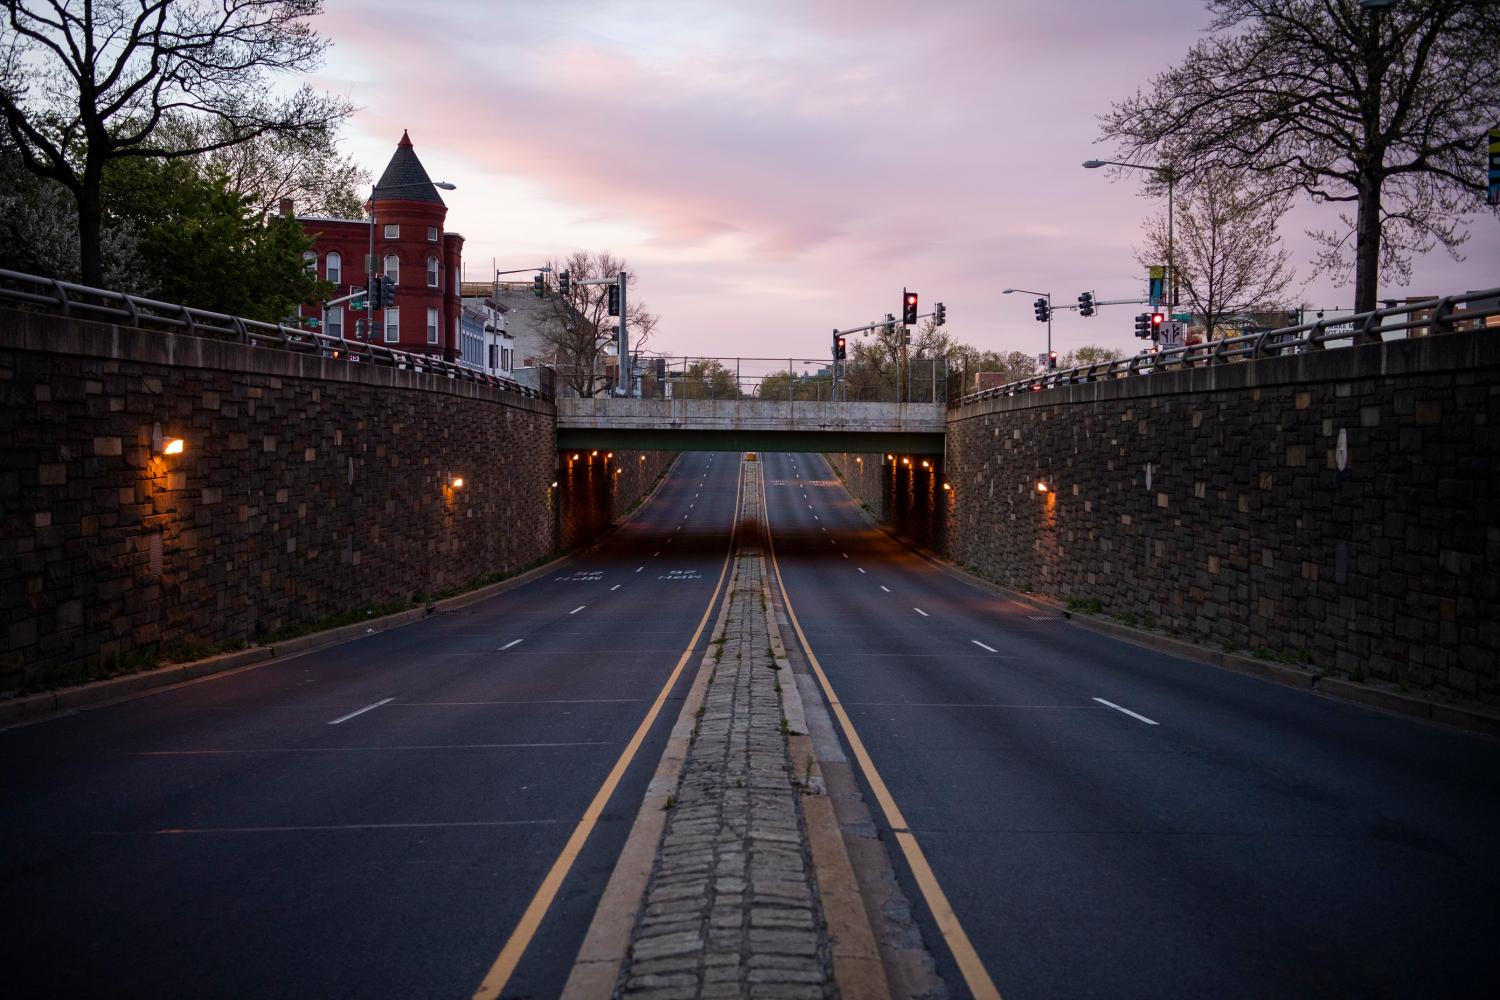
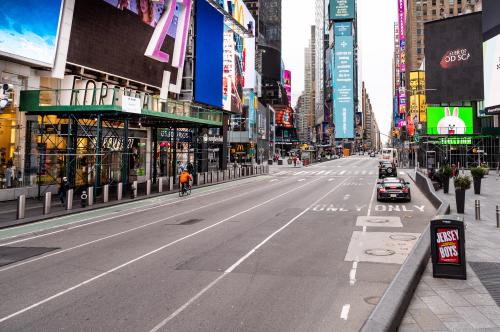
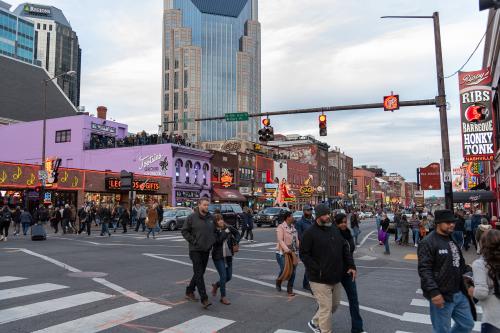
There are few silver linings to the COVID-19 pandemic, but free-flowing traffic is certainly one of them. For the essential workers who still must commute each day, driving to work has suddenly become much easier. The same applies to the trucks delivering our surging e-commerce orders. Removing so many cars from the roads has even led to cleaner air, clearer views, and more room for outdoor recreation, even in major cities.
Yet, stay-at-home orders are far from an ideal way to eliminate traffic. If the choice is between brutal congestion or full employment, we’ll take full employment every time. Nor were governments prepared for the loss in gas tax revenue, which leaves their transportation budgets in tatters.
Now, with many states considering lifting their stay-at-home orders, the question is whether the country can resume economic activity without bringing back the worst effects of our driving.
Using driving data from the pandemic alongside key economic data, it’s clear that the country can jump-start the economy without so many daily traffic jams. Doing so, however, will require major sacrifices: Employers will need to rethink their telecommuting practices, government officials will need to accelerate adoption of new revenue sources, and entire communities must be willing to redesign their roads for greener and more flexible uses.
America’s traffic has disappeared—everywhere
The United States maintains data on driving levels—or what’s technically called “vehicle miles traveled” (VMT)—dating back to the middle of the 20th century. The data covers 11 national recessions, one oil embargo, and major social transitions including the entrance of women into the workforce en masse. Still, we’ve never seen a drop in VMT like the one underway today.
Using StreetLight Data’s public VMT feed—which uses a mix of in-vehicle and cellphone location services to track driving levels—we can see how national driving habits have transformed in less than two months. Figure 1 tracks VMT in 12-month increments to control for seasonal driving effects.

Even if driving returned to pre-coronavirus levels by June, total VMT in 2020 would match the driving levels of 1998, when inflation-adjusted GDP was $6.7 trillion smaller and there were 42 million fewer registered drivers. But if stay-at-home orders remain in place another four months or more, the country could easily be driving the lowest number of miles since the 1980s or even 1970s.
Just as importantly, the drops in traffic aren’t isolated to a handful of dense, coastal hubs. StreetLight provides county-level data in the continental U.S., which allows us to track changes in almost every metropolitan area. Map 1 compares driving from the week of March 1, 2020 to the week ending April 24.

Every metro area in the country experienced a traffic decline of at least 53% since the beginning of March. Still, the largest and smallest VMT drops tend to cluster in similar places. College towns such as Ann Arbor, Mich., large metro areas along the Northeast corridor, and most of coastal California’s metro areas all saw their traffic levels drop by at least 75% since March 1. Meanwhile, many medium-sized metro areas in the South, running from Texas through the Carolinas, saw the smallest declines.
What’s affecting the decrease in driving?
These driving declines did not happen in a vacuum. Coronavirus outbreaks impacted communities at different times, industries shut down quicker in some places than others, and—maybe most importantly—communities responded with different attitudes toward government oversight. The contrasting images from late March of Florida’s crowded beaches and New York’s abandoned streets underscore these extremes.
To better understand why driving fell across the country—and to help predict why and where driving may increase—we ran a regression to control for several distinct metropolitan variables:
- Days between the country’s first stay-at-home order (in California) and the metro area’s similar order
- Share of workers in high-risk and essential industries
- Share of workers in high-information and management industries such as media, finance, insurance, real estate, and scientific and technical services (NAICS 51-54)
- Share of workers in public or private higher education (to control for college towns)
- County-level voting patterns from the 2016 presidential election
- Household median income
Not only did the model help explain over 60% of the variation across the country’s 178 largest metropolitan areas with complete data, but certain variables had a huge influence on the driving decline. We posted the full model results here, but three results stood out:
- Metropolitan populations were responsive to stay-at-home orders, leading to larger drops in driving the longer orders were in place. This was especially apparent in California, where Governor Gavin Newsom instituted the first major national order.
- Larger shares of workers in high-information and management industries had a major negative impact on driving. We believe this is evidence of a surge in telework among these relatively high-paid and digitally literate households.
- Voting patterns from 2016 had a significant impact, with Democratic-leaning counties far more likely to reduce their driving. This confirms national reporting that suggested partisanship was a major factor in a community’s approach to social distancing recommendations.
How can leaders sustain the benefits of less driving?
To be sure, the entire country wants to reach a place where the economy can restart. Getting people back to work, allowing family and friends to reunite, or simply visiting our favorite local stores would all be a welcome change.
But the COVID-19 lockdown has enabled the country to execute a transportation experiment at an almost unfathomable scale. Those results should give us hope that it’s possible to reduce congestion, deliver a safer and greener transportation system, and still bring the economy back to full capacity.
How do we do it? The process starts with demand management. It’s clear that many high-information and management industries—and establishments like them—could allow staff to work from home more often. Research finds that employers who offer more flexible work schedules tend to see more remote work occur. Regional business groups and large national companies should promote more flexible work, especially in some of the country’s most congested metro areas. Remember, even small decreases in traffic can lead to huge time savings on the road.
Now is also the perfect time to account for driving’s high costs, and price it more appropriately. Private vehicles help us make trips at incredible speeds, but they have major consequences on the communities around us. Roadway fatalities are the first or second leading cause of unintentional death across all ages. Transportation is also the country’s top source of greenhouse gas emissions, with private vehicles the primary culprit. With gas prices at multidecade lows, now is the ideal time to better reflect on driving’s social costs.
Transportation departments should use this opportunity to implement the VMT fees (where drivers pay per mile driven) they’ve wanted to initiate for decades. Unexpected losses in gas tax revenues will require states to shelve major capital projects—some indefinitely—and could limit routine maintenance work. The same could apply to local governments, due to their reliance on sales and income taxes for transportation budgets. Yet even if driving returns to prior levels, more fuel-efficient vehicles still pose a challenge to traditional gas-tax-based revenue sources. With widespread use of tracking technology to map coronavirus-related activity, the public may develop a greater acceptance of using similar technology to charge for their use of limited road space. Now is an ideal time to expand VMT fees from their pilot phases.
Finally, social distancing has created a unique opportunity to rethink how society divides transportation space. COVID-19 has been a wake-up call that we leave too little space for sidewalks, bike lanes, and just about any roadway use besides motor vehicles. But there’s also a chicken-or-egg element at play: As long as local streets primarily reserve space for cars, people will want to drive more. If society wants to create more safe space for outdoor activity, promote more biking, and reduce the use of our top source of pollution, then it’s time to refashion streets for more sustainable, safer uses.
This is where politics matter. While transportation technology is apolitical, use of it is not. It’s reasonable to expect that many of the same Democratic-leaning communities that took social distancing more seriously are also more sensitive to climate insecurity. Metropolitan and state leaders should use this VMT data to target the communities that may be most willing to test new, post-coronavirus interventions.
The U.S. spent decades building metro areas to accommodate cars. Once residents can leave their homes again, it’s reasonable to expect many will return to vehicles. But if leaders take the right steps—encouraging telework, altering revenues structures, and retrofitting roadways—the nation can emerge from the COVID-19 pandemic with a stronger and safer transportation outlook. It’s now up to society to remake itself in the image it wants.


