Newly released Census estimates that track population changes through July 2017 suggest that the rising post-recession Sun Belt boom has hit a snag in some places. At the same time, many Snow Belt states have seen unexpected growth upticks. This counters last year’s estimates that suggested a steady “back to normal” trend for the long-standing population shifts from the nation’s Northeast and Midwestern states toward the South and West, after a lull that lasted several years after the recession.
To be sure, the collective populations of the South and West “Sun Belt” states continue to grow faster than those in the Northeast and Midwest “Snow Belt”. In fact, if the current rates of growth continues through the 2020 Census, the Sun Belt will increase its advantage over the Snow Belt in congressional representation from 263 to 172, currently, to a projected 270 to 165. Yet the growth differential between the two mega-regions, which had widened through 2013, has noticeably shrunk last year.
Figure 1 displays the annual growth of these regions from 2000-01 to 2016-17. While Sun Belt growth exceeded Snow Belt growth throughout this time span, the growth disparity was widest in the years prior to the 2007-09 recession. In 2004-07, the annual growth differential between the two was well over 1 percent. This plummeted as the recession and housing crisis reduced movement to previous fast growing parts of the country such as Florida, Nevada, and Arizona. Net movement from Snow Belt to Sun Belt states shrunk from 611,000 in 2004-05 to levels well below 400,000 in 2012-13; so that, by the latter year, the Sun Belt’s growth advantage was reduced to 0.64 percent.
 Eventually, Sun Belt growth began to pick up along with the re-emergence of national labor and housing markets. By 2015-16, the net migration to the region rose to nearly 600,000 and its growth differential rose above 0.9 percent. Yet, the last year showed a noticeable drop in net migration gains—down to 470,000, lowering its growth differential to 0.75 percent.
The slower growth in the Sun Belt is not uniform across the region, nor is the slight uptick in Snow Belt growth pervasive across the nation’s Northeast and Midwest states. Yet some of the shifts are surprising and suggest future areas of unevenness within the regions.
Uneven growth within the Sun Belt
There is wide variation in 2016-17 growth rates within the Sun Belt (download Table 1) with 16 of the 30 states (including Washington, D.C.) growing faster than the national population growth rate of 0.72 percent. These include the nation’s fastest growing states of Idaho and Nevada, which grew at rates of 2.2 and 2.0 percent, respectively; and another 11 states with growth rates exceeding 1 percent. At the other extreme are six Sun Belt states which registered 2016-17 population losses including Wyoming, West Virginia, Alaska, Hawaii, Mississippi, and Louisiana. This is the most Sun Belt state losses registered in decades.
More noteworthy is the fact that 18 of these 30 states registered either slower growth or greater declines in 2016-17 than in the previous year. This includes growth reductions of 0.25 percent or more in Wyoming, West Virginia, Alaska, Louisiana, Oregon, Florida, Colorado, and Hawaii. Some states, such as Florida and Oregon, showed dips after successive years of growth, though West Virginia and Hawaii sustained several years of growth slowdowns.
The 12 Sun Belt states which showed raised levels of growth in 2016-17 include the Mountain West states of Idaho, Montana, and Nevada, and southeastern states: Arkansas, Tennessee, Alabama, Virginia, Kentucky, North Carolina, and Georgia.
Figure 2 compares the experiences of two large southern states, Florida and Texas, which registered recent growth slowdowns, with those of two western states, Idaho and Nevada, where growth increased. Texas has long exhibited high growth rates, and, by virtue of its size, high numeric population gains. Yet, while it faired better than most Sun Belt states during the recession, its recent growth ticked downward. Florida followed the trend of many Sun Belt magnets, with plummeting growth during the recession and immediate post recession years, only to show a rise from 2013 to 2016 before dipping last year. The rising growth in other southeastern states suggests dispersion away from Florida over the last year.

Unlike these two states, Nevada and Idaho display continued growth through 2016-17. Nevada, like Florida, saw a steep growth decline beginning in 2007, only to rise in recent years. This occurred in Idaho as well as other interior western states including Montana and Arizona. Some of this growth uptick is attributable to these states’ strengthening economies and rebounding housing markets, leading to an attraction of migrants from more high-priced markets in California, which is experiencing increased net out-migration (-138,000 in 2016-17 up from a low of -40,000 in 2010-10).
Snow Belt growth rebounds
Growth rates also vary within the Snow Belt, though at generally lower levels. Among its 21 states, only two (South Dakota and Minnesota) grew faster than the nation in 2016-17; and 16 grew less then 0.5 percent (download Table 1). Illinois and North Dakota registered population losses. Still 17 of the 21 Snow Belt states displayed higher growth than the year before. These include each of the New England states and several large industrial or midwestern states like Pennsylvania, Ohio, Michigan, and Wisconsin.
Yet, these stand in contrast with two of the Snow Belt’s largest states, New York and Illinois, which registered reduced growth, and, in the case of the latter, population decline. Figure 3 contrasts the post-2000 experiences of these states with those of Michigan and Ohio.
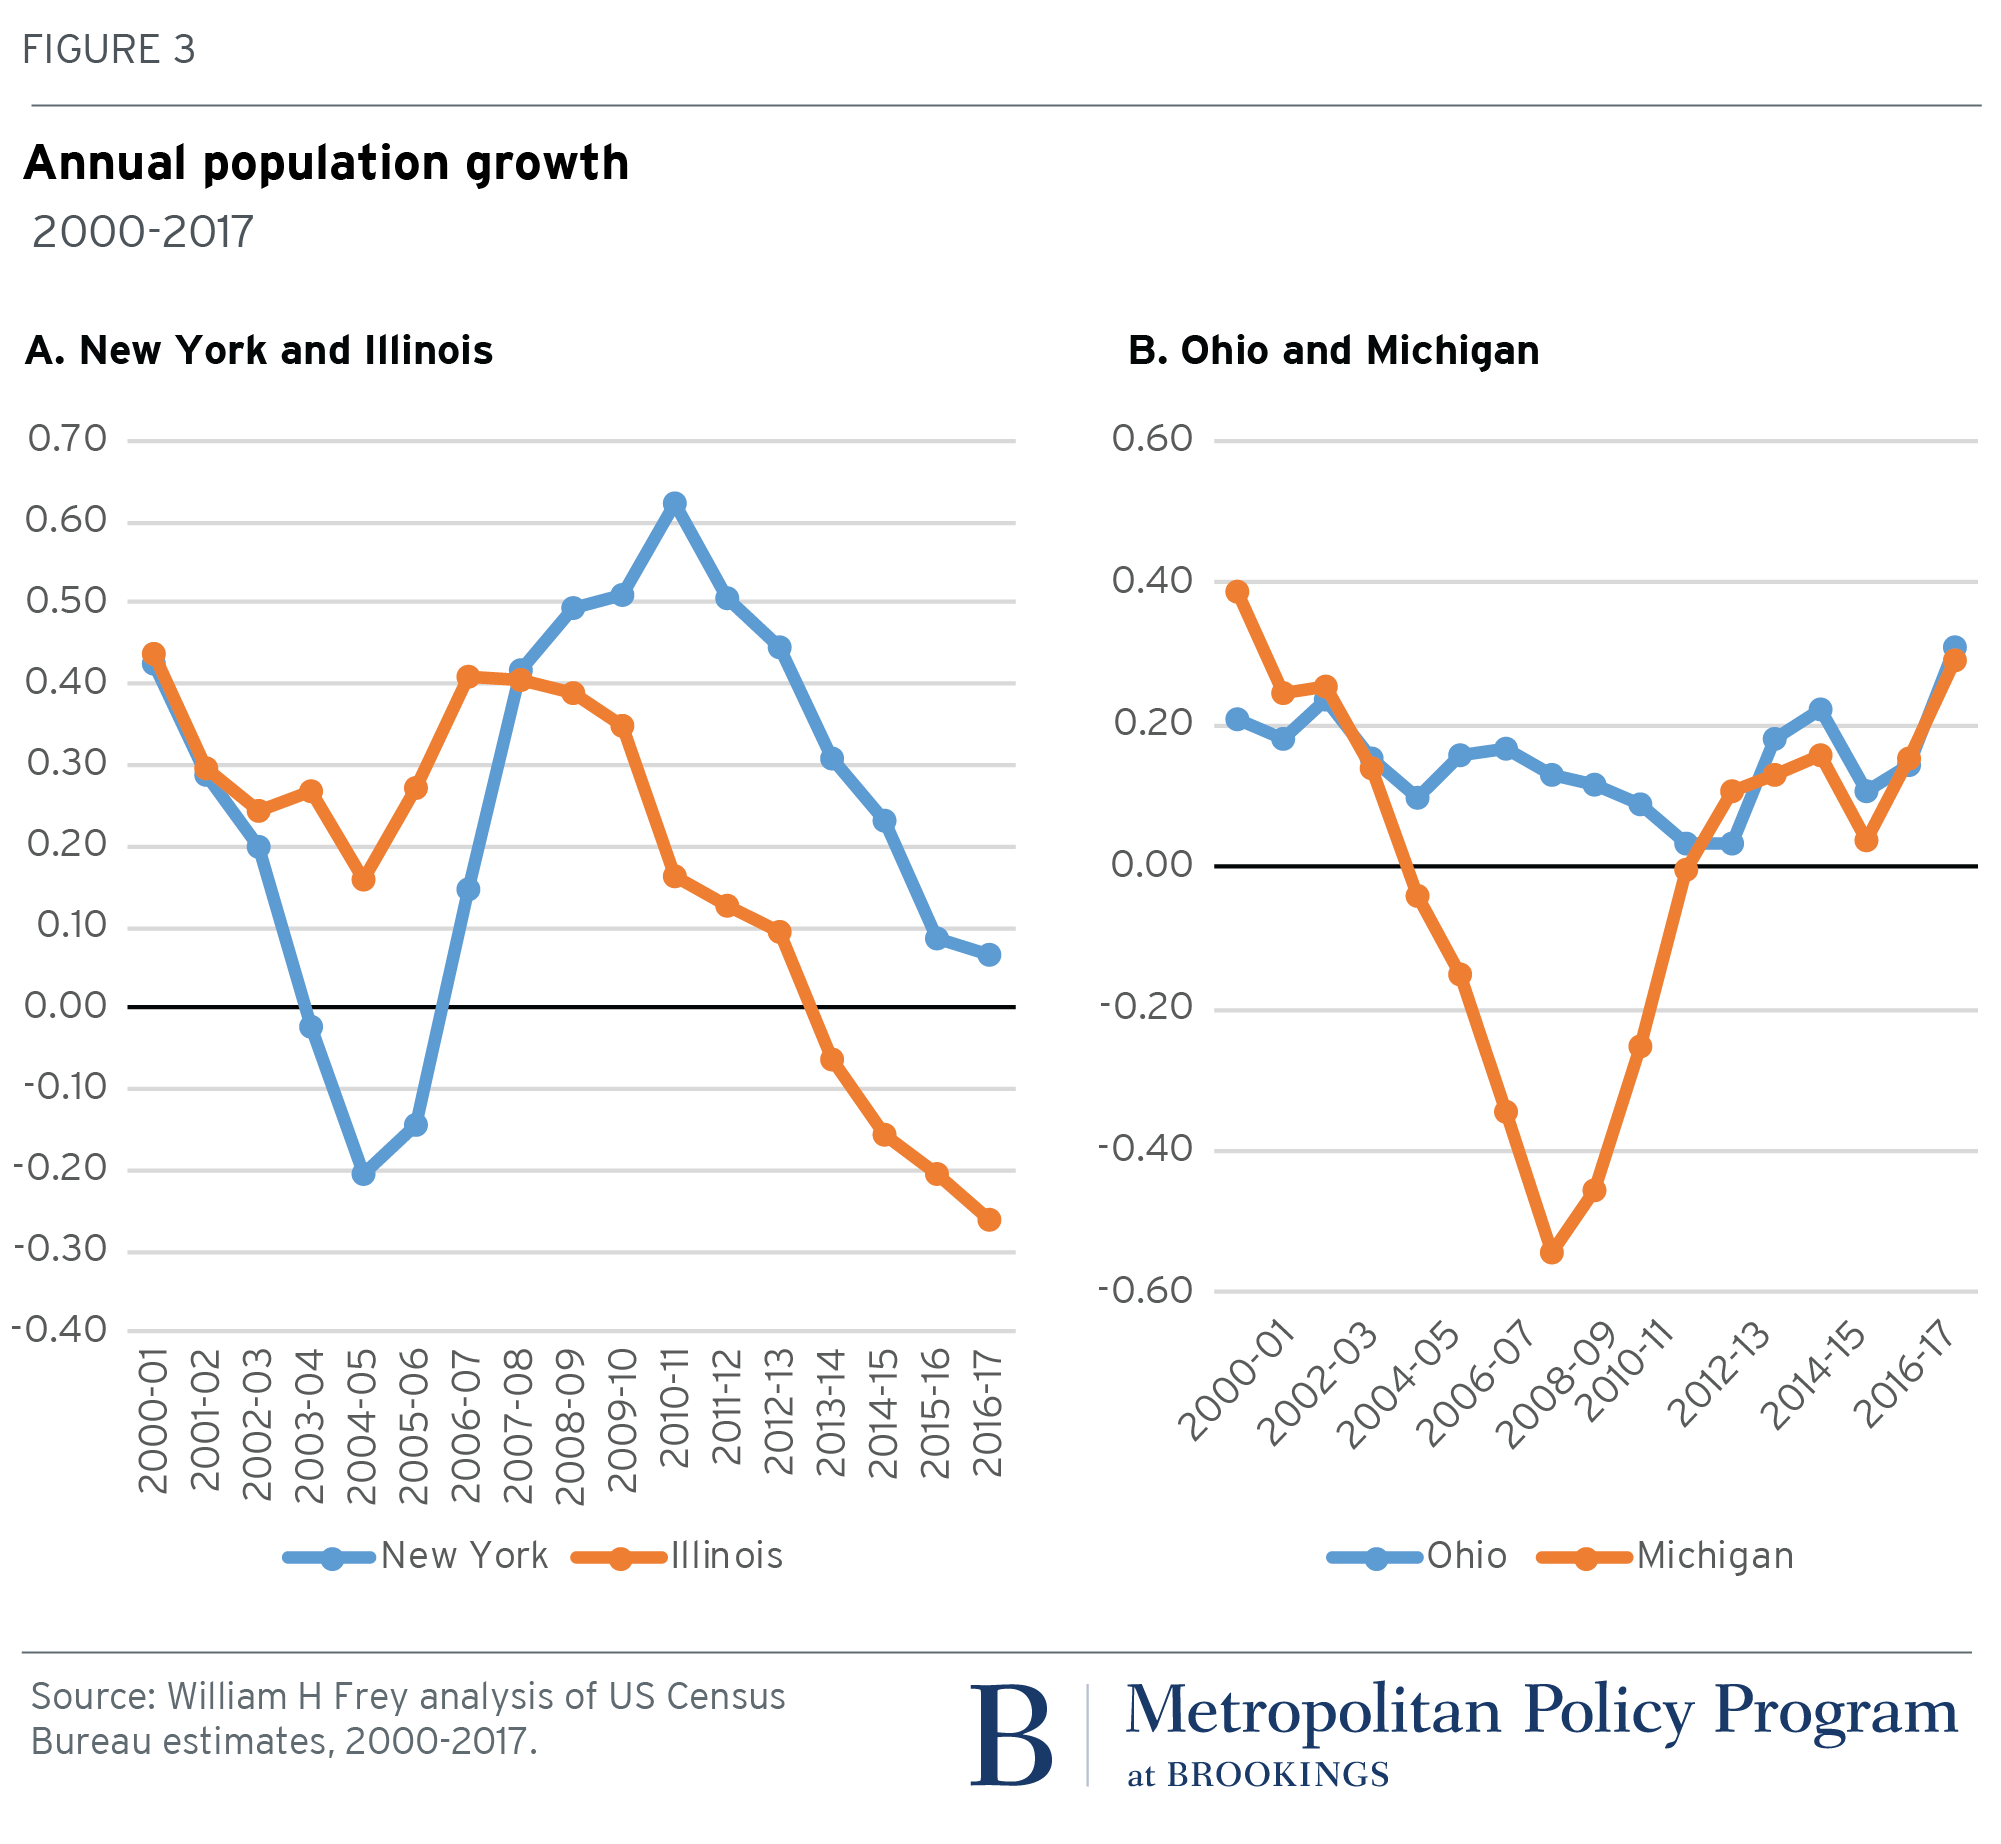
Like many Snow Belt states, both New York and Illinois showed increased growth during the early recession years as Sun Belt employment opportunities dried up and “would be migrants” stayed put. While their growth levels peaked in different years, each showed especially lowered growth since, especially since, 2011; and in the case of Illinois, four straight years of population loss. The slow growth/decline patterns of these large states dominate population shifts in the Snow Belt, accounting for 65 percent of the region’s overall 2016-17 net out migration.
Still, the rising growth in other Snow Belt states such as Ohio and Michigan is noteworthy and especially heartening for the Great Lakes states in light of the population losses it sustained between 2004 and 2011. While growth rates for Ohio and Michigan rank low among all states (32nd and 35th, respectively), the recent uptick for these and other parts of the Snow Belt hint that a modest rebound could be in the offing.
Intraregional shifts and political clout
The new Census estimates suggest that previous forecasts of a return to the heady population shifts from the Snow Belt to the Sun Belt might be tempered to some degree. In fact, there seem to be noticeable growth shifts underway within these mega-regions, as migrants relocate to less pricey locales in the Southeast and Mountain West (within the Sun Belt) or away from states with the largest urban centers (within the Snow Belt).
These shifts could also impact state political clout through congressional reapportionment if they continue through the 2020 Census. A new analysis by Election Data Services indicates how the intra-regional reshuffling of congressional seats might be altered if 2016-17 population shifts continued. Compared with previous projections, California could lose a seat for the first time in history while Montana would pick up an extra seat, and, within the Snow Belt, Illinois could lose a second seat to the benefit of Minnesota, which would not lose a seat. Along with other changes that would occur, the Sun Belt would gain a net of seven seats. But there would be important changes occurring within regions if the latest population growth rates persisted.
Of course, future population shifts will depend upon migration across states while, still occurring at historically low rates, showing signs of picking up. If they do, there could be increased movement from high-cost to low-cost states within regions along with the longstanding shift from Snow Belt to Sun Belt.
Related Content


Authors


Commentary
Sun Belt population growth hits modest snag, Census data show
December 22, 2017