Half a year ago, debate at the IMF/World Bank annual meetings in Marrakech centered on geopolitics, with a lot of concern that the global security situation was spinning out of control. This was not the central theme at last week’s IMF/World Bank Spring Meetings. To be sure, there was lots of debate on the Middle East and Ukraine, but neither were seen as “systemic.” Instead, focus was on cyclical outperformance of the United States vis-à-vis its peers and the possibility that this might keep U.S. inflation stickier than elsewhere, preventing the Fed from cutting rates even as other major central banks begin easing cycles. This combination of factors made sentiment the most dollar-bullish in a very long time, with the U.S. election and geopolitical risk seen as additional sources of dollar strength. Not much of any of this is priced into markets. Option-implied volatilities for the euro and Mexican peso, for example, are at very depressed levels. This means volatility may rise, perhaps sharply, as the rest of 2024 unfolds.
US economic outperformance
A stylized fact following the 2008 crisis is that U.S. growth substantially outperformed the rest of the advanced world. This again looks to be true in the aftermath of COVID-19 (Figure 1), with lots of debate on the underlying drivers. Some argue that this outperformance reflects loose fiscal policy and rapid immigration, while others see a productivity boom linked to tight labor markets. Whatever the source, cyclical outperformance may keep U.S. inflation stickier than elsewhere. There are some signs of this. Figure 2 shows the combined weight of items in the U.S. consumer price index (CPI) with month-over-month inflation above 2% (on a seasonally adjusted, annualized basis), alongside the same measure for the eurozone’s harmonized index of consumer prices (HICP). This metric is noisier than if we used year-over-year inflation, but it has the advantage of focusing on recent inflation dynamics, since there are no base effects to muddy the picture. Elevated inflation remains relatively broad-based in the U.S., consistent with strong growth, while inflation momentum is clearly fading in the eurozone.
Figure 1. Real GDP vs. pre-COVID trend growth in the US and eurozone, indexed to 100 in Q4 2007
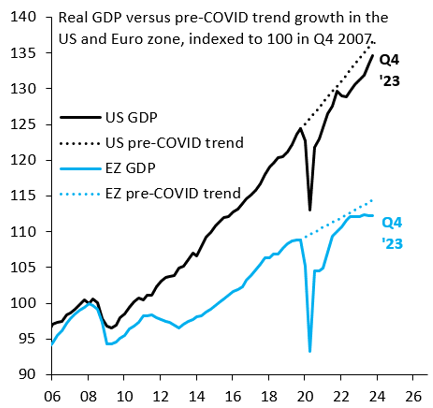
Source: BEA and Eurostat
Figure 2. Inflation generalization in the US and eurozone: Weight of items in CPI and HICP with m/m (saar) inflation > 2%
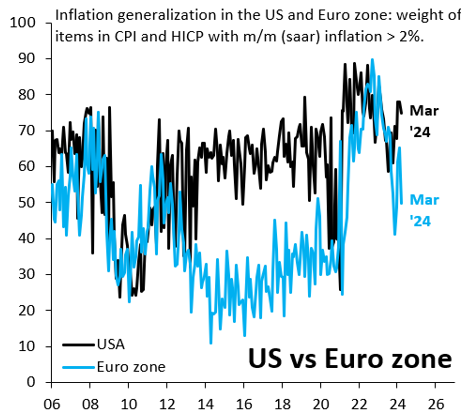
Source: BLS and Eurostat
Cyclical outperformance of the United States is not priced into markets. Figure 3 shows 5-year, 5-year forward breakeven inflation for the U.S. and eurozone. Prior to COVID-19, breakeven inflation in the eurozone was around 70 basis points below the U.S. That wedge has closed and is currently only half that, which means that markets are not differentiating sufficiently between the U.S. and the eurozone. The same picture emerges from interest rate differentials. Figure 4 shows 2-year, 2-year forward interest rates in the U.S. and eurozone—an estimate for where markets think the “terminal” rate will be—along with the corresponding rate differential. The rate differential is below where it was prior to COVID-19, even though the U.S. is now much more clearly outgrowing the eurozone. The fact that U.S. outperformance is not priced into markets suggests there is scope for the dollar to rise going forward, which explains bullish sentiment at last week’s Spring Meetings.
Figure 3. 5-year, 5-year forward inflation breakevens for the US and eurozone, in %
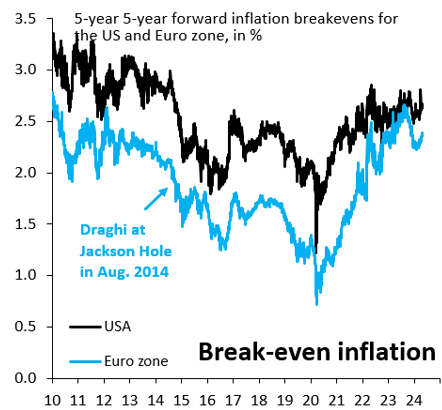
Source: Bloomberg
Figure 4. 2-year, 2 year forward interest rates in the US and eurozone, in %
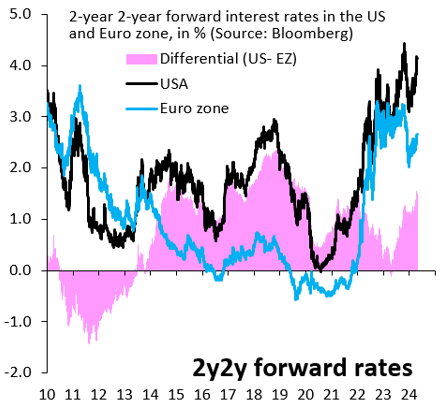
Source: Bloomberg
While the charts so far have drawn the contrast with the eurozone, our basic points carry over to the broad dollar. Figure 5 shows the trade-weighted interest differential at different tenors of the U.S. vis-à-vis other advanced economies, where we use the same weights as the Federal Reserve’s dollar index. Much as in Figure 4, the rate differential of the U.S. versus key trading partners is below its peak in the run-up to COVID-19. Markets are not pricing U.S. “exceptionalism.” The same is true just looking at the trade-weighted nominal dollar versus advanced economies and emerging markets (Figure 6). The dollar has basically been in a decade-long holding pattern since its large rise in 2014/5.
Figure 5. US interest rate differentials vs. other advanced countries, in % (US – GDP weighted foreign)
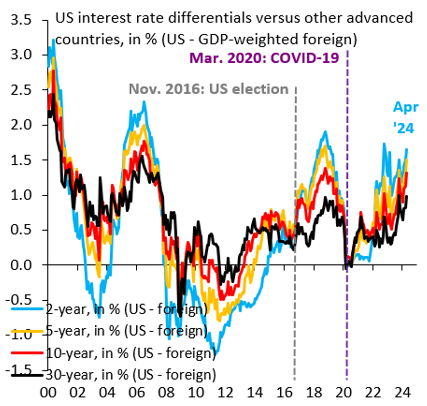
Source: Bloomberg
Figure 6. US dollar vs. G10 and emerging markets, excluding China
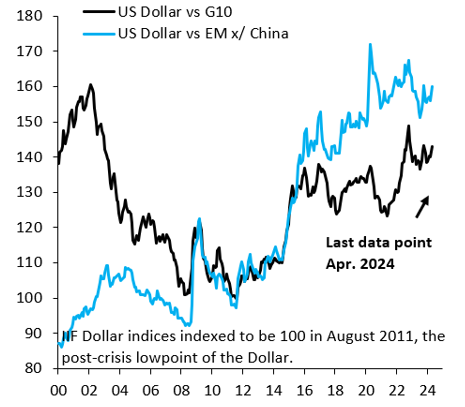
Source: Bloomberg
US elections and geopolitical risk
The looming U.S. elections were—inevitably—a major discussion point, though there is little conviction on which way the election will go. What is clear, regardless of the outcome, is that markets have not yet begun to hedge this event risk in any material way, which is evident from meetings with investors and market pricing. Figure 7 shows option-implied volatility for EUR/$ on a six-month (does not cover the election) and one-year tenor (spans the election). Volatility spiked sharply in November 2016 and is currently far below those levels, even after the recent rise as markets priced a more hawkish Fed. Figure 8 shows the same thing for $/MXN, where it is again true that volatility rose sharply in November 2016 and is currently far below those levels. The fact that markets have not yet begun to hedge U.S. election risk is another source of dollar strength and volatility for the rest of 2024. An escalation of conflict in Ukraine or the Middle East would also prompt safe-haven flows to strengthen the dollar..
Figure 7. EUR/$ money option volatility
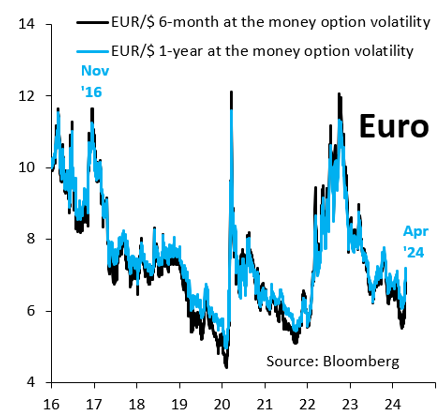
Source: Bloomberg
Figure 8. $/MXN money option volatility
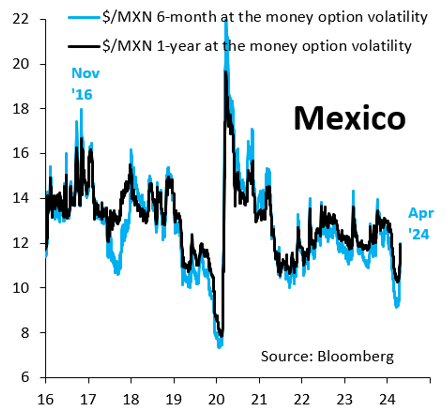
Source: Bloomberg
Author

The Brookings Institution is committed to quality, independence, and impact.
We are supported by a diverse array of funders. In line with our values and policies, each Brookings publication represents the sole views of its author(s).

Commentary
Key themes at the IMF/World Bank Spring Meetings: Dollar dominance
April 25, 2024