An earlier version of this post incorrectly labeled the year for “Robot intensity is much greater in red states than blue,” as 2016. The correct year is 2015 and the chart has been updated.
Where are the robots, exactly? One answer—if you read the steady flow of doomy articles online — is that automation is everywhere, not just all over the media but (you would have to conclude) thoroughly infiltrating the economy. In that sense, the trend seems omnipresent even as it spawns a kind of free-floating dread amongst the chattering class.
Yet, that can’t be right. Almost nothing in today’s economy is evenly distributed, whether it be technology, productivity, output, or inclusive prosperity. And so it is worth getting more specific about where exactly automation may displace workers — and where not.
To parse that out, the Brookings Metro program will later this year release a new state and metro mapping of where the effects of automation may be most disruptive, using some high-quality estimates of the susceptibility of occupations to substitution. In the meantime, though, we thought we’d take a look at the geography of one particular flashpoint of the automation debate: the use in American regions of industrial robots, defined here as “automatically controlled, reprogrammable machines” capable of replacing labor in a range of tasks.
To get at this, the Metro program has followed the lead of economists Daron Acemoglu and Pascual Restrepo who, in a recent paper, deployed sales data from International Federation for Robotics (IFR) to explore trends in the installation of robots in U.S. and international work places. Although Acemoglu and Restrepo’s paper has been controversial in its modeling of large negative effects of robots on employment and wages, the underlying robot data appear sound, so we use them to measure the penetration of robots into American industries and then into U.S. metropolitan areas (Acemoglu and Restrepo did this for commuting zones).
Here, then, is what the data show:
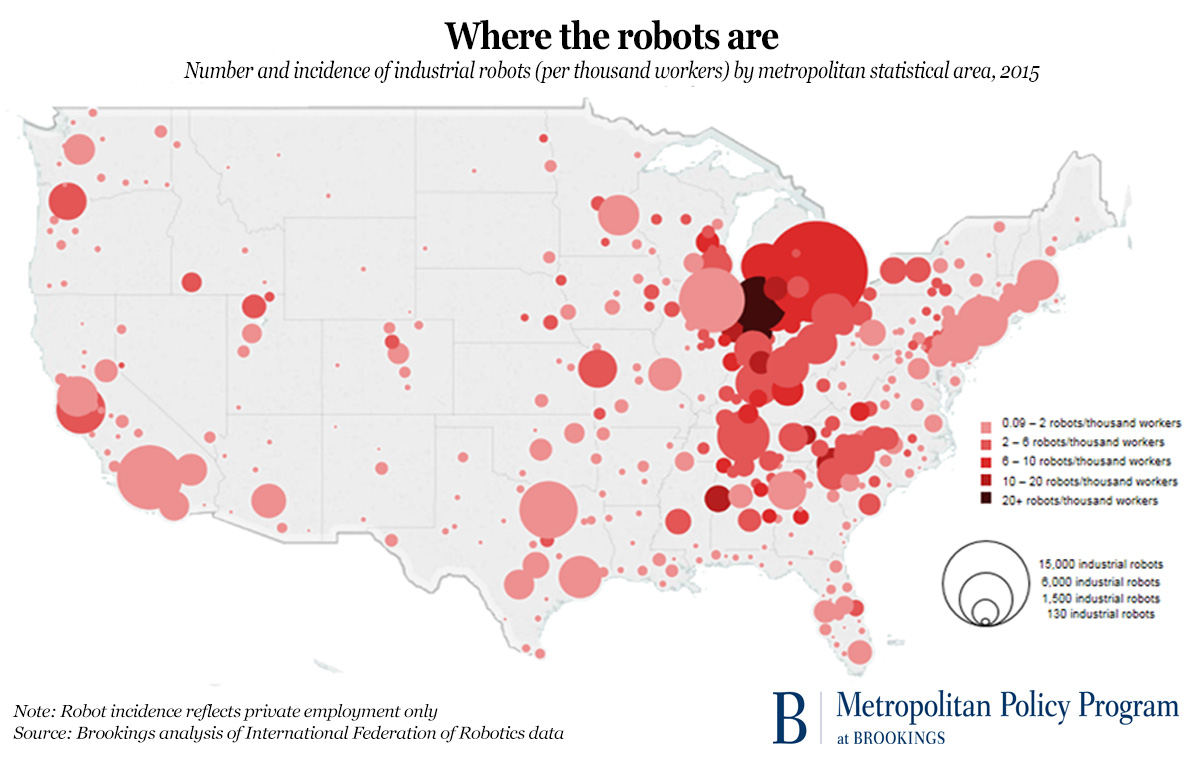
Robots, it turns out, are congregating densely in some places but are hardly found in others. Specifically, the map makes clear that while industrial robots are by no means everywhere, they are clustered heavily in a short list of Midwestern and Southern manufacturing states, especially the upper Midwest.
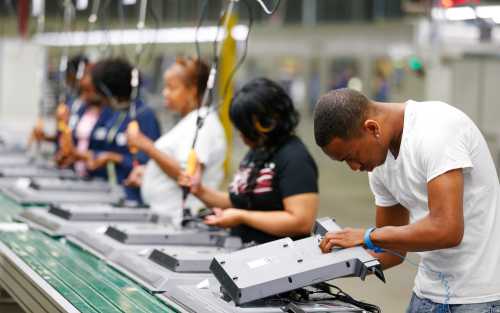
This clustering follows logically from the fact that the auto industry—highly concentrated in the Midwest and upper South—currently employs nearly half of all industrial robots in use. (Lesser but significant users are the electronics and rubber and plastics industries). But at any rate, more than half of the nation’s 233,305 industrial robots are burning welds, painting cars, assembling products, handling materials, or packaging things in just 10 Midwestern and Southern states, led by Michigan (which accounts for nearly 28,000 robots, 12 percent of the nation’s total), Ohio (20,400, 8.7 percent), and Indiana (19,400, 8.3 percent), followed closely by Tennessee. By contrast, the entire West accounts for just 13 percent of the nation’s industrial bots.
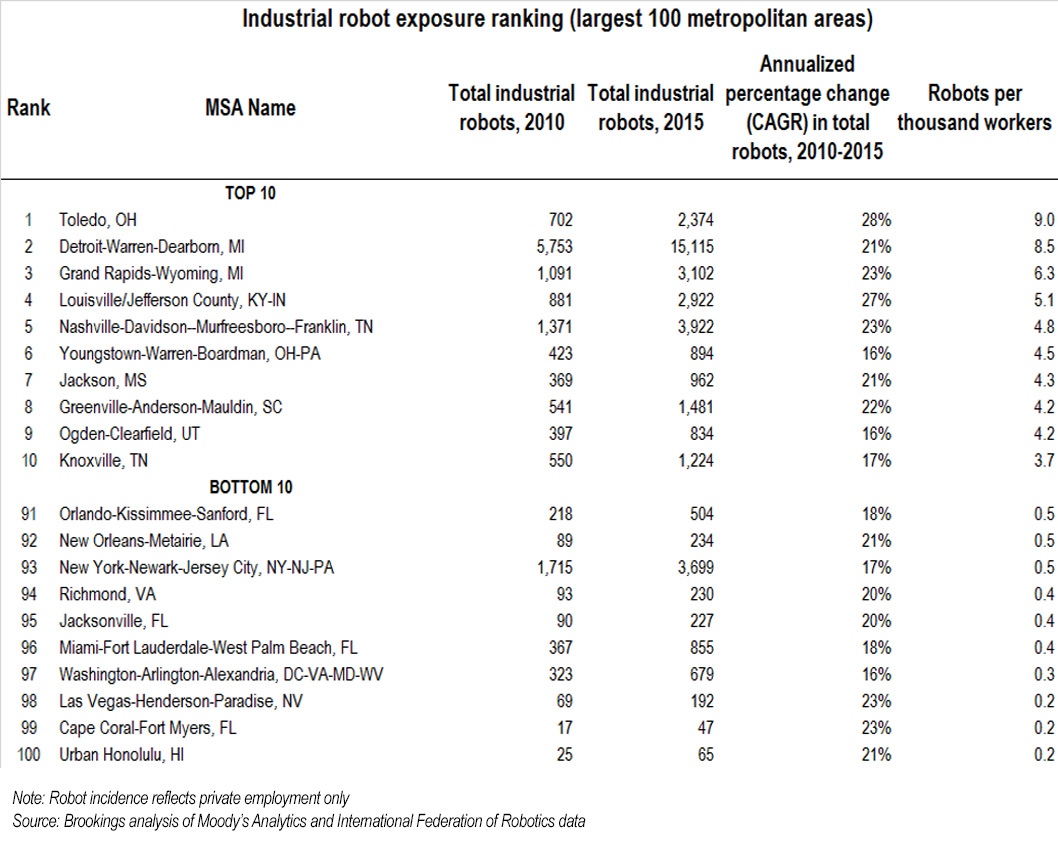
Turning to the robots’ location within states, the list of the most robot-exposed larger and smaller metropolitan areas is similarly concentrated.
Focusing on the largest metros along the Interstate corridor from Indiana to Alabama, auto-intense metro Detroit—with more than 15,000 industrial robots in place or 8.5 per 1,000 workers—dominates the map with more than three times the number of installed robots of other metros. Other major manufacturing centers like Toledo, Grand Rapids, Louisville, and Nashville also loom large. Each of these metros saw a tripling of the number of their robots in operation during the post-crisis auto boom between 2010 and 2015. Among these metros, the number of robots for every 1,000 workers now ranges from 4.8 in Nashville to 6.3 in Grand Rapids, and nine in Toledo (compared to incidences of less than one in dozens of Western cities). Regardless of whether these robot densities are meaningfully limiting aggregate employment in these metros, as Acemoglu and Restrepo claim in their paper, there is no doubt that robotics are playing a substantial role in shaping the dynamics of many, though by no means all, local economies.
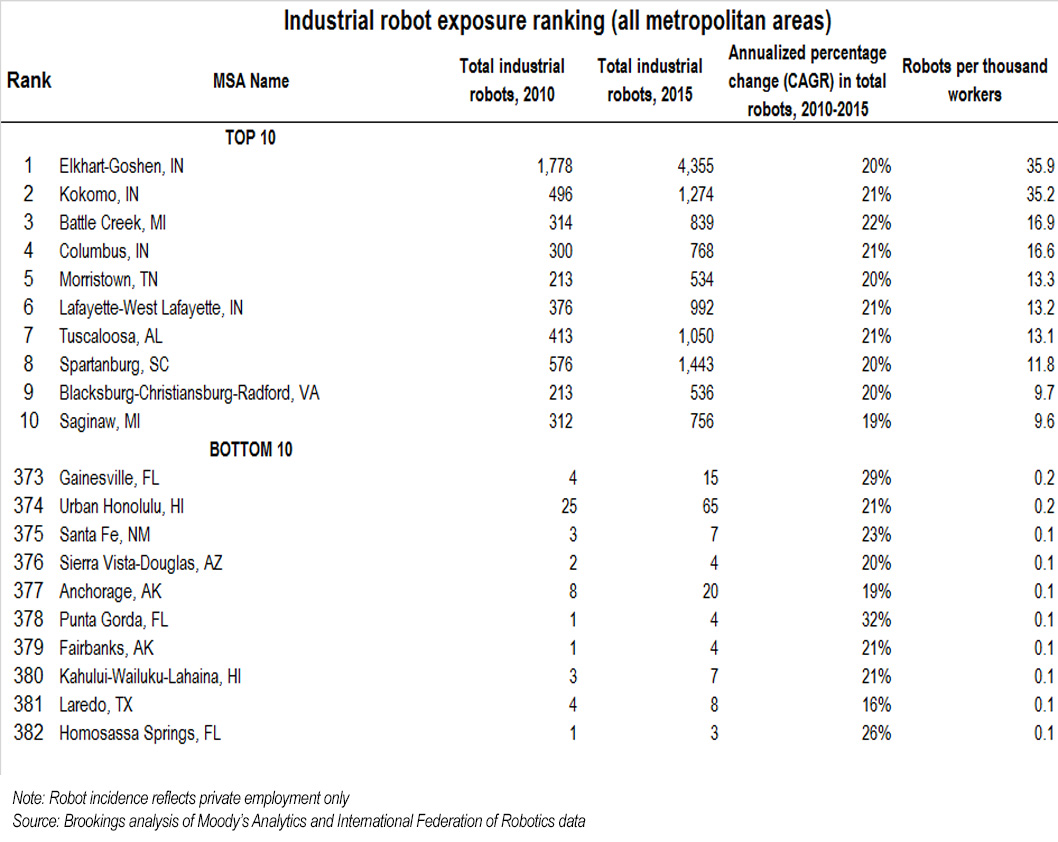
Nor are large Midwestern metros the only ones heavily affected. Scores of smaller towns and cities in the Midwest and South are also heavily involved with robots, as would be expected from their high involvement in manufacturing. Twelve smaller places including four towns in Indiana (led by Elkhart), Tuscaloosa, Ala., and Spartanburg, S.C. all have robot densities higher than any larger metro. The densities are sometimes substantially higher, with incidences ranging up through the teens (there are 16.6 robots per 1,000 workers in Morristown, Tenn.) to 35.2 and 25.9 in Kokomo and Elkhart, Ind. In fact, there are currently 35 smaller metropolitan areas where the robot count exceeds five per 1,000 workers and 56 where it exceeds three. Conversely, the robot incidence is less than two per 1,000 workers in 253 metros.
For good and ill, then, this is where the industrial robots are and aren’t. Long to short, their incidence reflects the nature and geography of the nation’s highly automated advanced manufacturing sector.
Which prompts a couple observations. First: The uneven map of industrial robotics makes a simple point about technology change. Automation—like so many other economic trends—won’t occur in the same way everywhere. Far from being entirely novel, automation will resemble other economic changes in that it will touch down in disparate communities in disparate ways determined by the workings of global value chains as they are shaped by the local industry mix, skills, location.
Which points to a second point: Anxiety about robots — like their physical distribution — will also likely have its own geography. On this point, while the nation’s anxiety about automation appears broad and diffuse, the specific facts of robot use suggest that the most significant social impacts of at least this form of automation remain concentrated. Specifically, the robots map suggests that robot and broader economic anxiety (along with associated labor market stresses) may also max out in the industrial Midwest—particularly in such robot-exposed “red” states as Michigan, Wisconsin, and Pennsylvania where the election’s outcome was determined.
It is telling that the robot incidence in red states that voted for President Trump in November is more than twice that in the blue states that voted for Hillary Clinton, according to our analysis of the IFR data (a finding that parallels an earlier analysis by economist Jed Kolko of the geography of the “routine” jobs deemed vulnerable to automation):
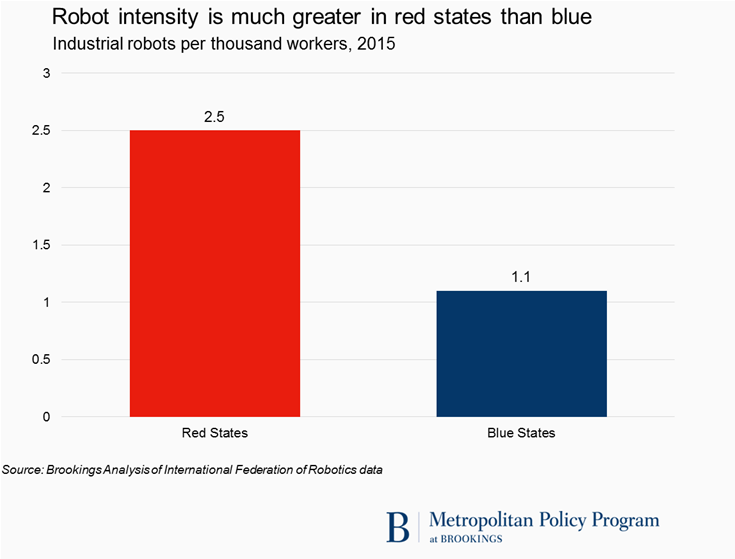
This is not to say robots determined the outcome of the 2016 election. However, the red-state robot concentration does suggest that to the extent industrial automation brings difficult labor market transitions and anxiety, it will visit those difficulties most heavily on a particular swath of red-leaning America—specifically, the most robot-exposed locations in the industrial Midwest. To be sure, the disruption that will come with the continued adoption of broader “office” technologies like artificial intelligence will likely be felt on a wider national scale. But for its part, the robot portion of the automation fear is, and should continue to be, more confined.
In that sense, robots appear to be playing a special role in the specific unease of at least one region.
The author would like to thank Sifan Liu, Dustin Swonder, Jacob Whiton, and Irvin Mull for research assistance on this post.
Robot incidence and concentration data for 50 states, 100 large metropolitan areas, and all 382 metros is available here, here, and here.
Related Content


Author

The Brookings Institution is committed to quality, independence, and impact.
We are supported by a diverse array of funders. In line with our values and policies, each Brookings publication represents the sole views of its author(s).
Commentary
Where the robots are
August 14, 2017