
This report is part of a series by the author on the results of the 2020 census.
In April 2021, the Census Bureau released the first set of results from the 2020 decennial census, providing a snapshot of the U.S. population for use in congressional reapportionment and redistricting. But recently, the agency released more detailed census information that shows a fuller picture of the population as it stood during the once-a-decade headcount.
These new statistics provide more information on the nation’s age structure and its race-ethnic composition, both nationally and across geographic areas. Among other items, they show that the nation continues to age, with the fastest population growth occurring among the older population while the youth population declines.
This aging is not “race neutral.” White Americans contributed substantially to older population gains compared to younger and middle-aged populations, which registered white declines.1 Nonwhite residents accounted for all of the gains in post-baby-boomer populations. Although all race and ethnic groups are aging to some degree, the median age of white Americans is higher than all others in most geographic areas.
These patterns have led to a “racial generation gap,” in which the younger population—more influenced by immigration in recent decades—is far more diverse than older age groups. This demographic phenomenon has been shown to underlie many aspects of American social life, including its politics. While these national patterns are important in their own right, they vary considerably across states and regions, and thus exert more political and social influence in some areas of the country than others. Accordingly, this report pays special attention to the local dimensions of these demographic dynamics with interactive maps for states and metropolitan areas.
The US population continues to grow older, with some geographic variation
The new census data provides an authoritative picture of the nation’s continued aging. During the 2010-20 decade, the 65-and-older population (referred to here as the “senior” population) grew by nearly two-fifths (38.6%). This is over twice as much as during the 2000-10 decade and more than triple the rate of the 1990s (see Figure 1). It was the highest decade-long rate of senior growth that the nation has experienced since the 1880s, and the largest intercensal numeric gain (15.5 million) in its history. Underlying this gain was the aging of the large baby boomer generation, the first half of whom turned 65 during this decade.
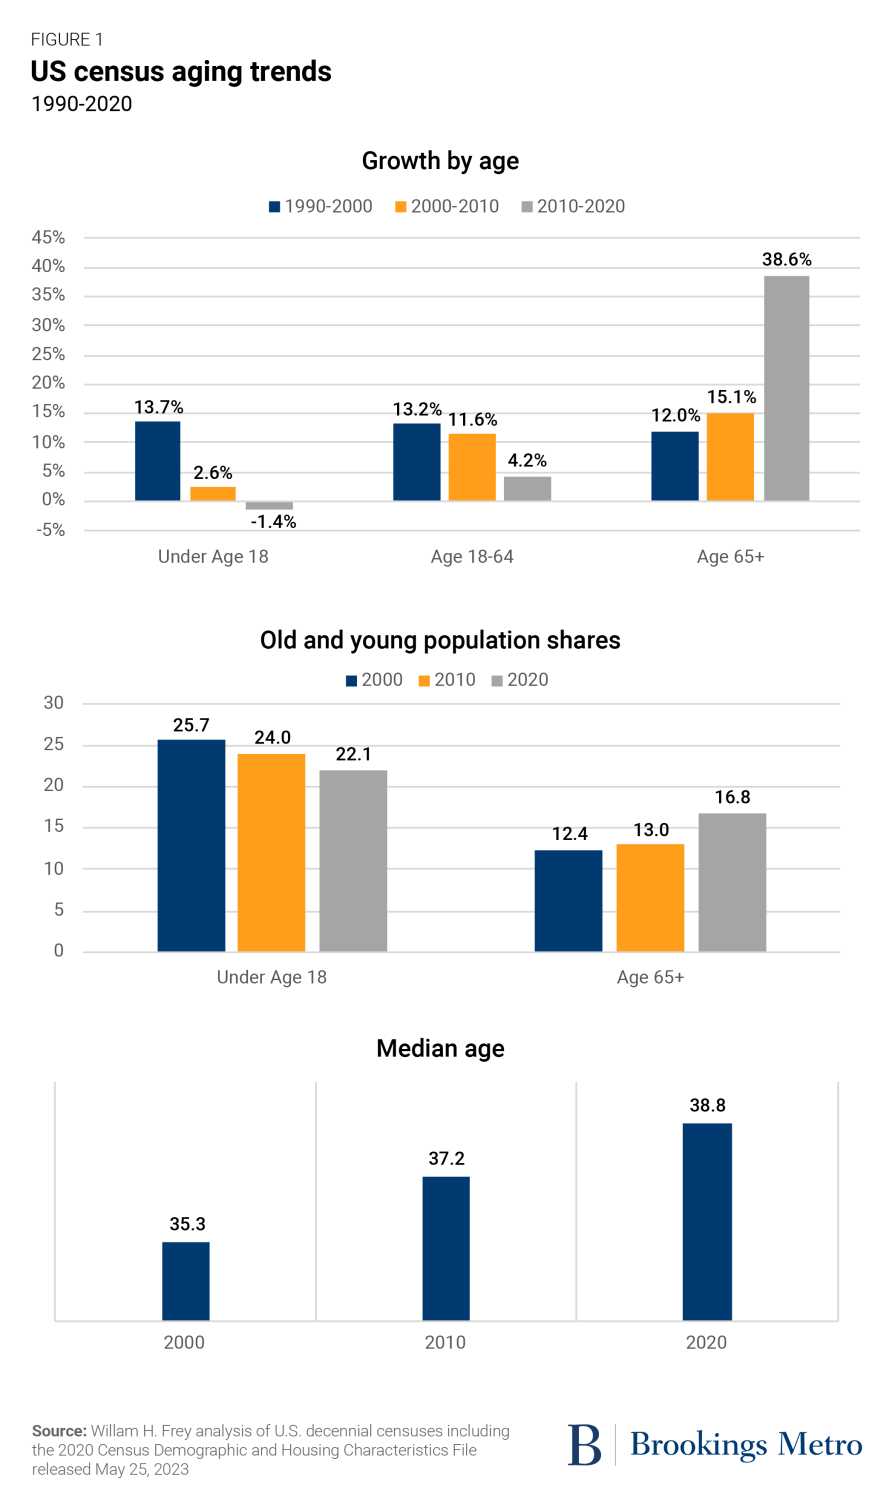
The broad labor force age population (18 to 64) grew at a far slower rate during the 2010s: 4.2%, which is less than half as fast as in the 2000s and about one-third of the growth during the 1990s.
Perhaps more notable, the under-18 population (referred to here as the “youth” population) actually declined in the 2010s, after a small uptick in the 2000s and substantial growth in the 1990s. This decline can be attributable to fewer births (associated with lower fertility and proportionately fewer women in childbearing ages due to the aging population), as well as reduced immigration in the later part of the 2010s.
Together, these trends increased the share of the seniors to one-sixth (16.8%) of the overall population—well above their 12.4% share in 2000 and 9.2% in 1960. Back then, in the midst of the baby boom, the youth population comprised more than one-third (35.8%) of the population—dropping to nearly one-fifth (22.1%) in 2020, after slow growth and then an absolute decline.
Another measure of aging is the population’s median age. In this, the U.S. is approaching 40 (38.8)—up from 35.3 in 2000 and 29.5 in 1960.
Aging patterns differed across states and the 56 major metropolitan areas with populations over 1 million (see downloadable Tables A and B). Although all states and metro areas showed 2010-20 growth in their senior populations, the highest rates tended to be in growing parts of the country: Alaska, Idaho, Colorado, and Nevada, as well as the metro areas of Austin, Texas; Raleigh, N.C.; Houston; Atlanta; and Jacksonville, Fla. These areas are not primarily growing because they attract senior migrants; rather, it is due to the aging-in-place of 50- and 60-somethings that moved there during their younger years.
States and metro areas with large senior population shares also include slow-growing areas with histories of modest growth or declines in their younger populations (Maine, Vermont, and West Virginia, as well as the Pittsburgh, Cleveland, and Rochester, N.Y. metro areas) and areas that are specifically attracting seniors (Florida and the Tucson, Ariz., Tampa, Fla., and Miami metro areas).
There are also geographic variations in youth population shifts. While 27 states and 26 major metro areas registered losses in their under-18 populations during the 2010s, there are notable exceptions. The highest youth growth rates were in North Dakota, Utah, and Idaho, as well as the metro areas of Austin, Texas; Orlando, Fla.; Raleigh, N.C.; and Nashville, Tenn. These are broadly growing areas with population gains from net in-migration during all or part of the 2010s and—in the case of Utah, North Dakota, and Idaho—high numbers of births.
All states except North Dakota and all major metro areas showed a rise in their median age (see downloadable Table C). These ranged from a median age of 31.3 in Utah to 45.1 in Maine; and from 32.8 in metro area Salt Lake City to 42.9 in Pittsburgh. Rankings on median age tend to mirror those of senior population shares—with slow-growing, Northeast, and Midwest areas, along with Florida and several retirement-magnet metro areas, generally ranking higher. But some areas with the lowest 2020 median ages (including Salt Lake City, Houston, and Dallas) still showed notable median age gains from the prior decade, demonstrating that population aging is pervasive.
White populations declined in younger and middle-age groups
Population shifts across the nation’s age structure are hardly “race neutral.” Nationally between 2010 and 2020, the white population registered a decline in age groups below 55, but contributed to gains in the older age groups, particularly in the 65 to 74 group. This can be attributed to the mostly white baby boomer generation entering that age group. And because of the smaller size of nonwhite racial and ethnic groups entering the senior population, white gains out-distanced nonwhite gains for both the 65 to 74 and 75 and over age groups.
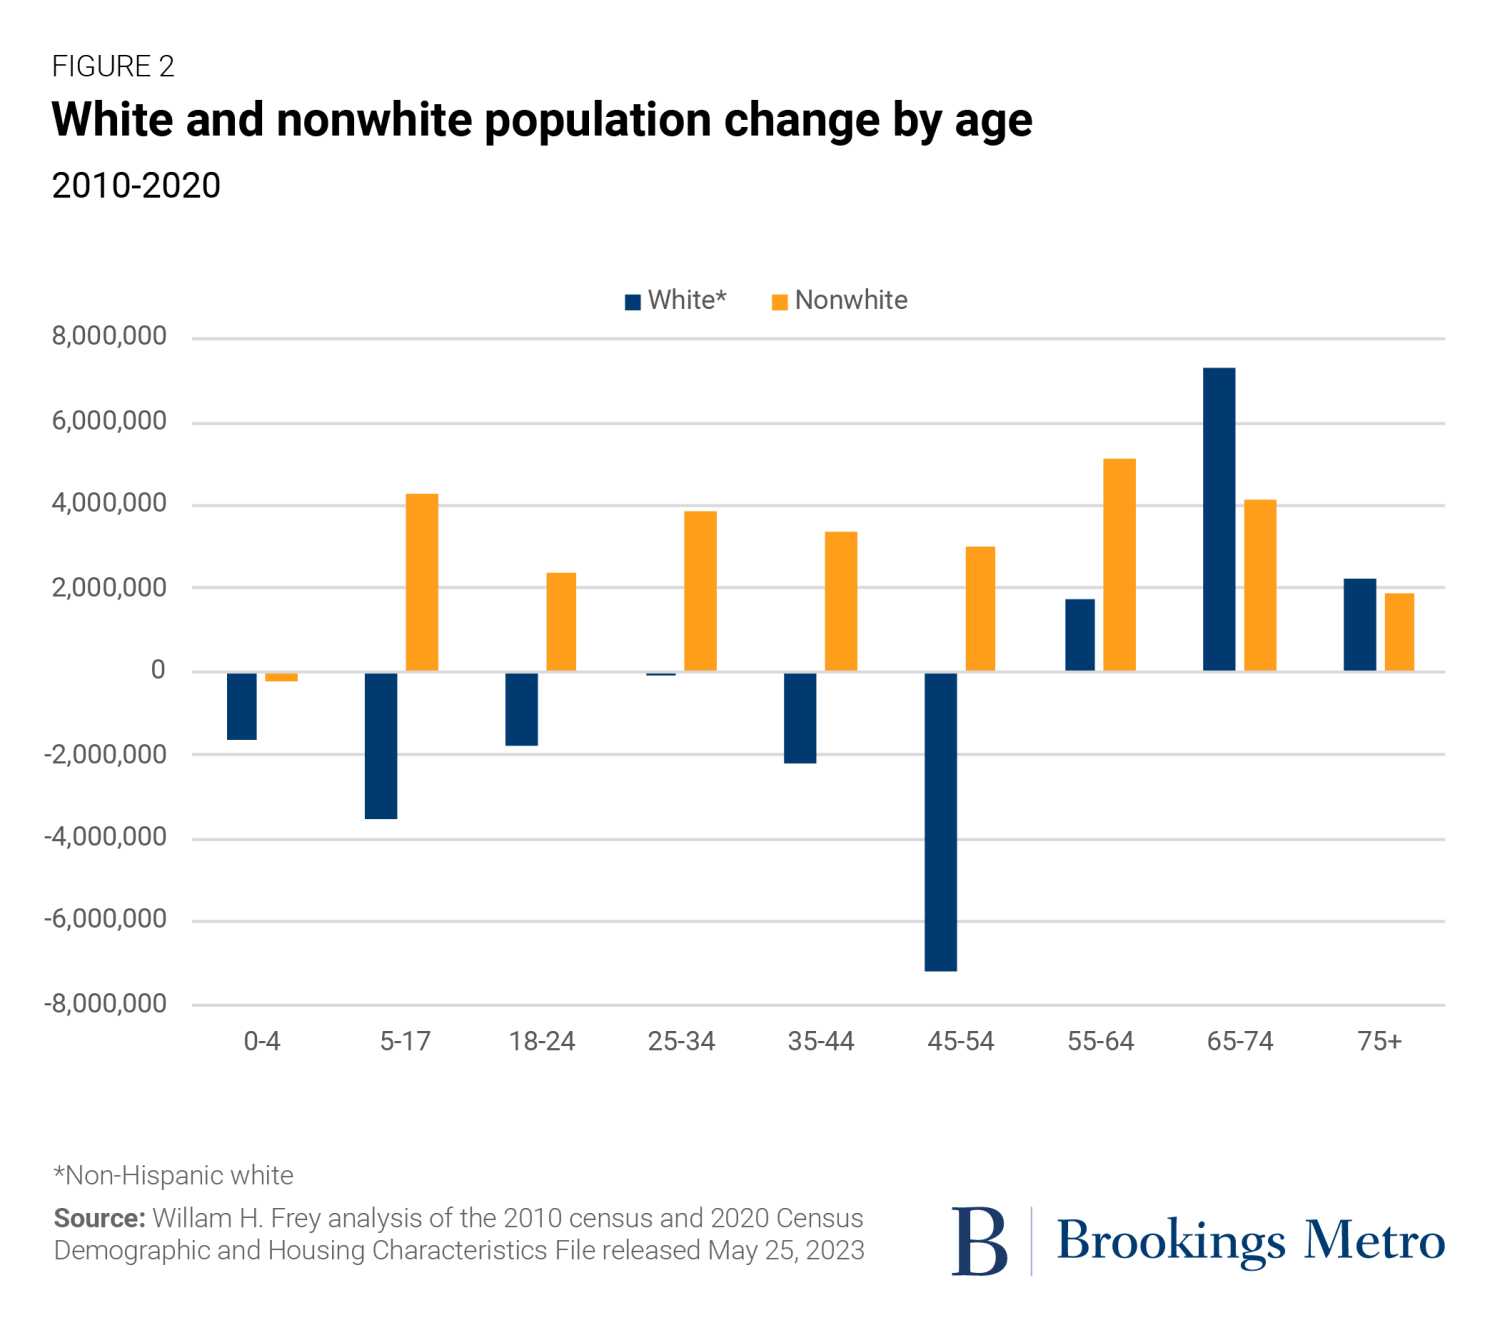
Among most age categories, nonwhite gains are attributable to larger numbers aging into the category (along with new immigrants) compared with the number aging out of the category. In the case of younger groups, a rise in births also contributes, although smaller numbers of births and reduced immigration in the latter half of the 2010s led to a decline in the under-5 population.
White declines in younger and middle-age groups are related to the aging of the white population; the number of white Americans entering these age groups (plus immigration) is smaller than the number aging out of the category.
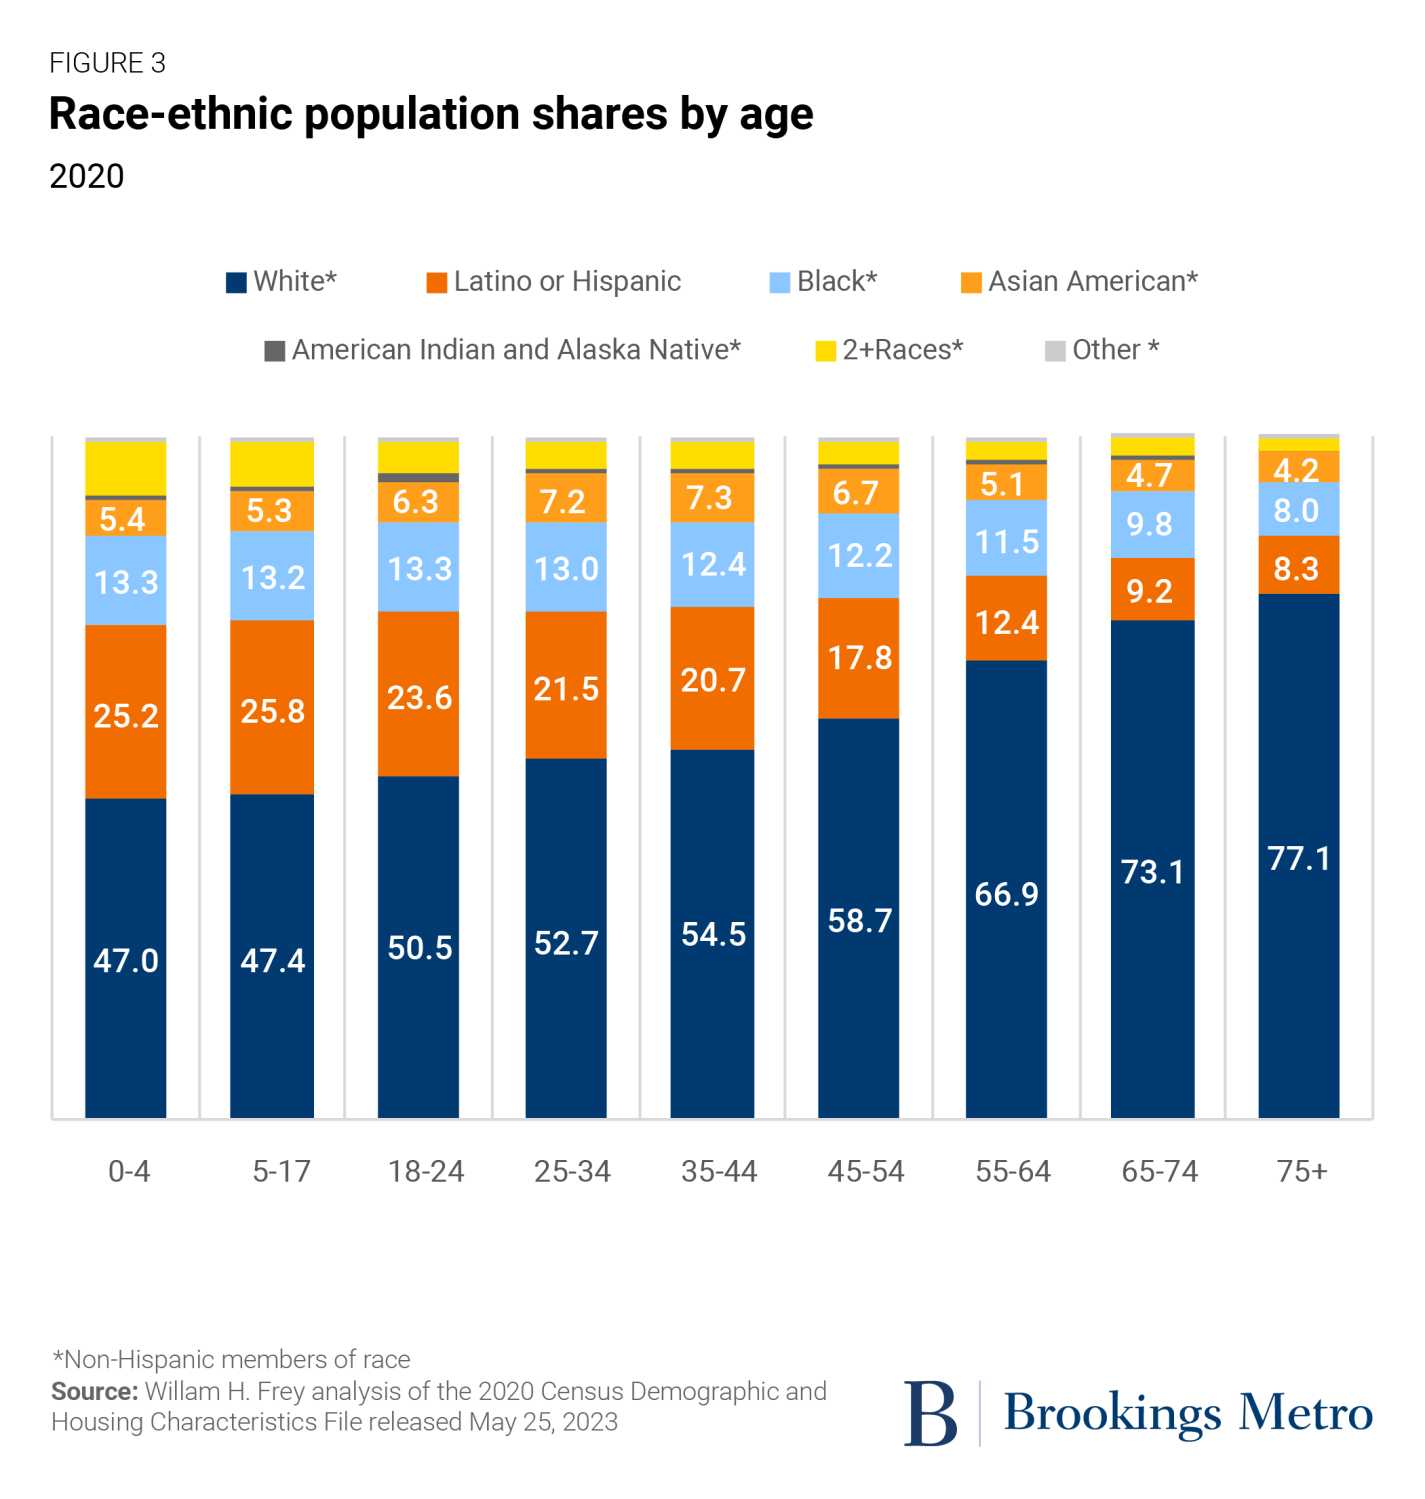
The result of these shifts is a population that has become increasingly diverse at younger ages (see Figure 3 and downloadable Table D). Racial minorities comprise over half of the zero to 4 and 5 to 17 age groups, with Latino or Hispanic Americans representing more than a quarter. In contrast, white Americans comprise about three-quarters of the 65 to 74 and 75 and older age groups. Over the entire age spectrum, white population shares increase with age.
The growing diversity of the younger population began in earlier decades, as racial minorities displayed higher levels of immigration during their primary working ages, leading to rises in the number of minorities in those ages as well as more births (due to the increased number of women in childbearing ages). The 2020 census is the first to show that less than half of U.S. children under age 18 identified as white.
In essence, population growth among racial minorities—especially Latino or Hispanic and Asian Americans—served to counter the aging and now declining white population in youth and prime labor force age groups.
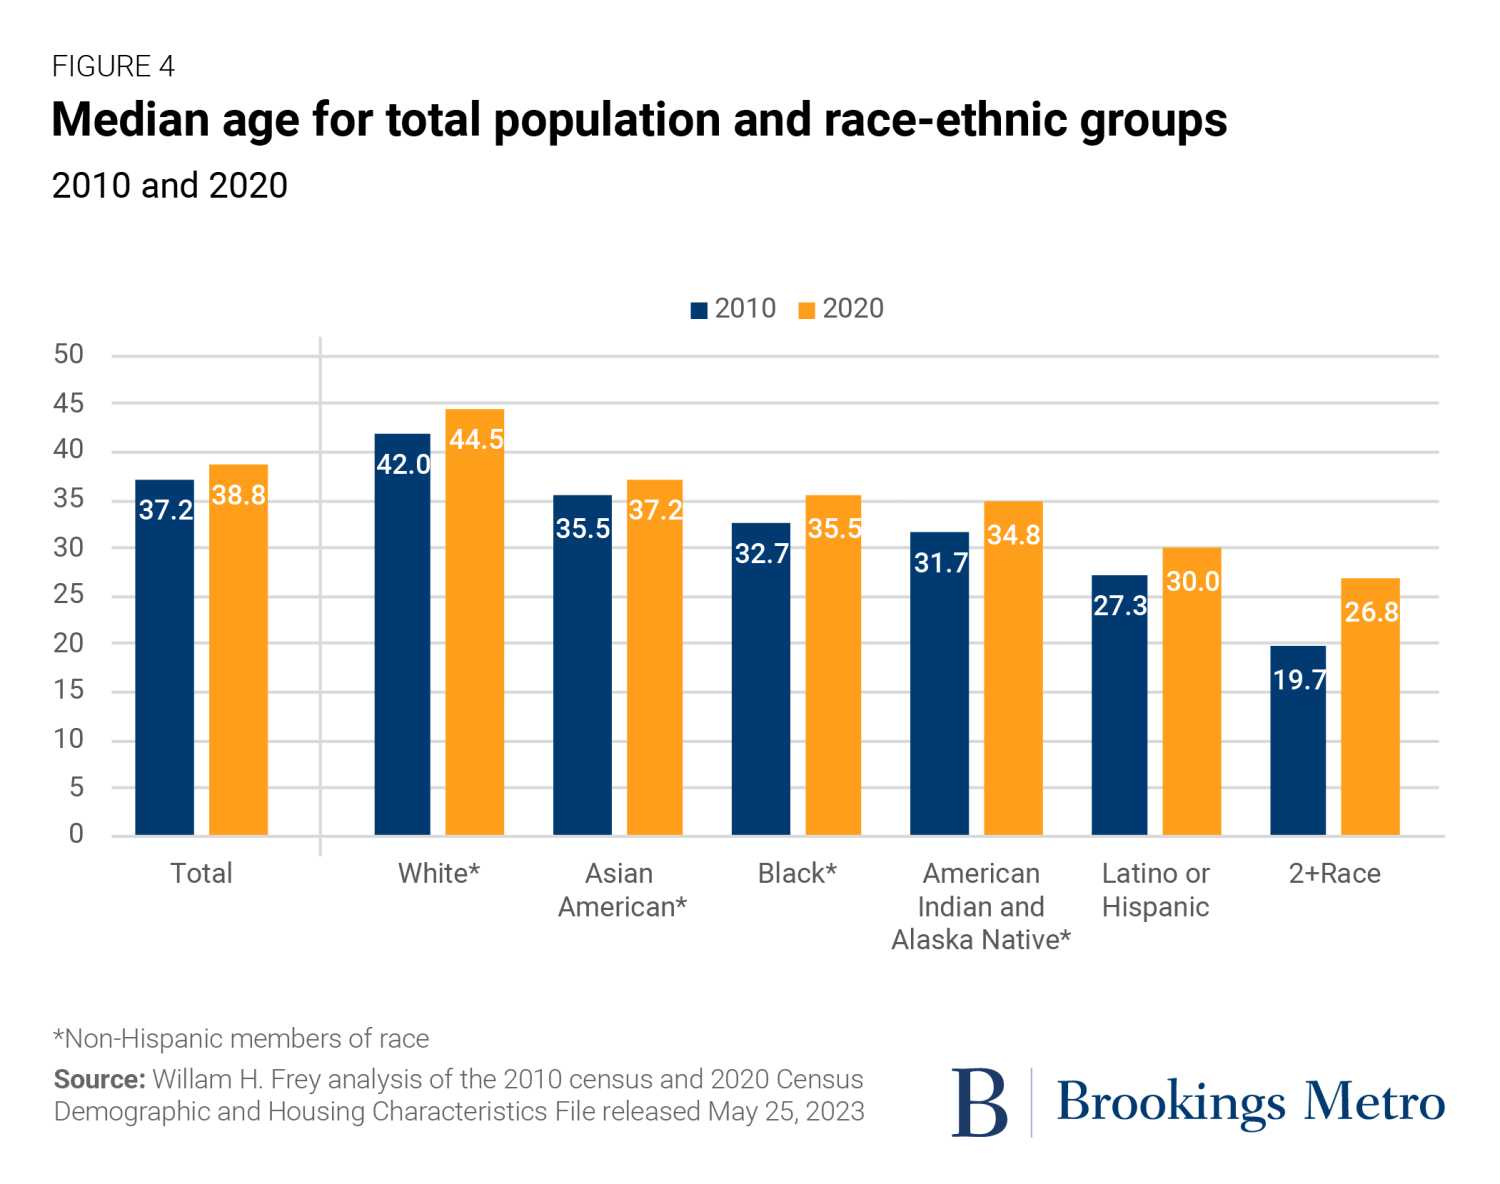
The more pronounced aging of the white population is also evident when comparing median ages across race and ethnic groups (see Figure 4). While the median age of all groups rose between 2010 and 2020, the white population continues to show the highest median age, at 44.5—nearly six years higher than the overall median age and 14 years higher than the Latino or Hispanic median age. This pattern is also true in most states and major metro areas (see downloadable Table E).
Examining the racial gaps between young and old populations
The new census data shows that the nation’s increased diversity—especially among its youth—continues to lead to notable racial differences between young and old age groups.
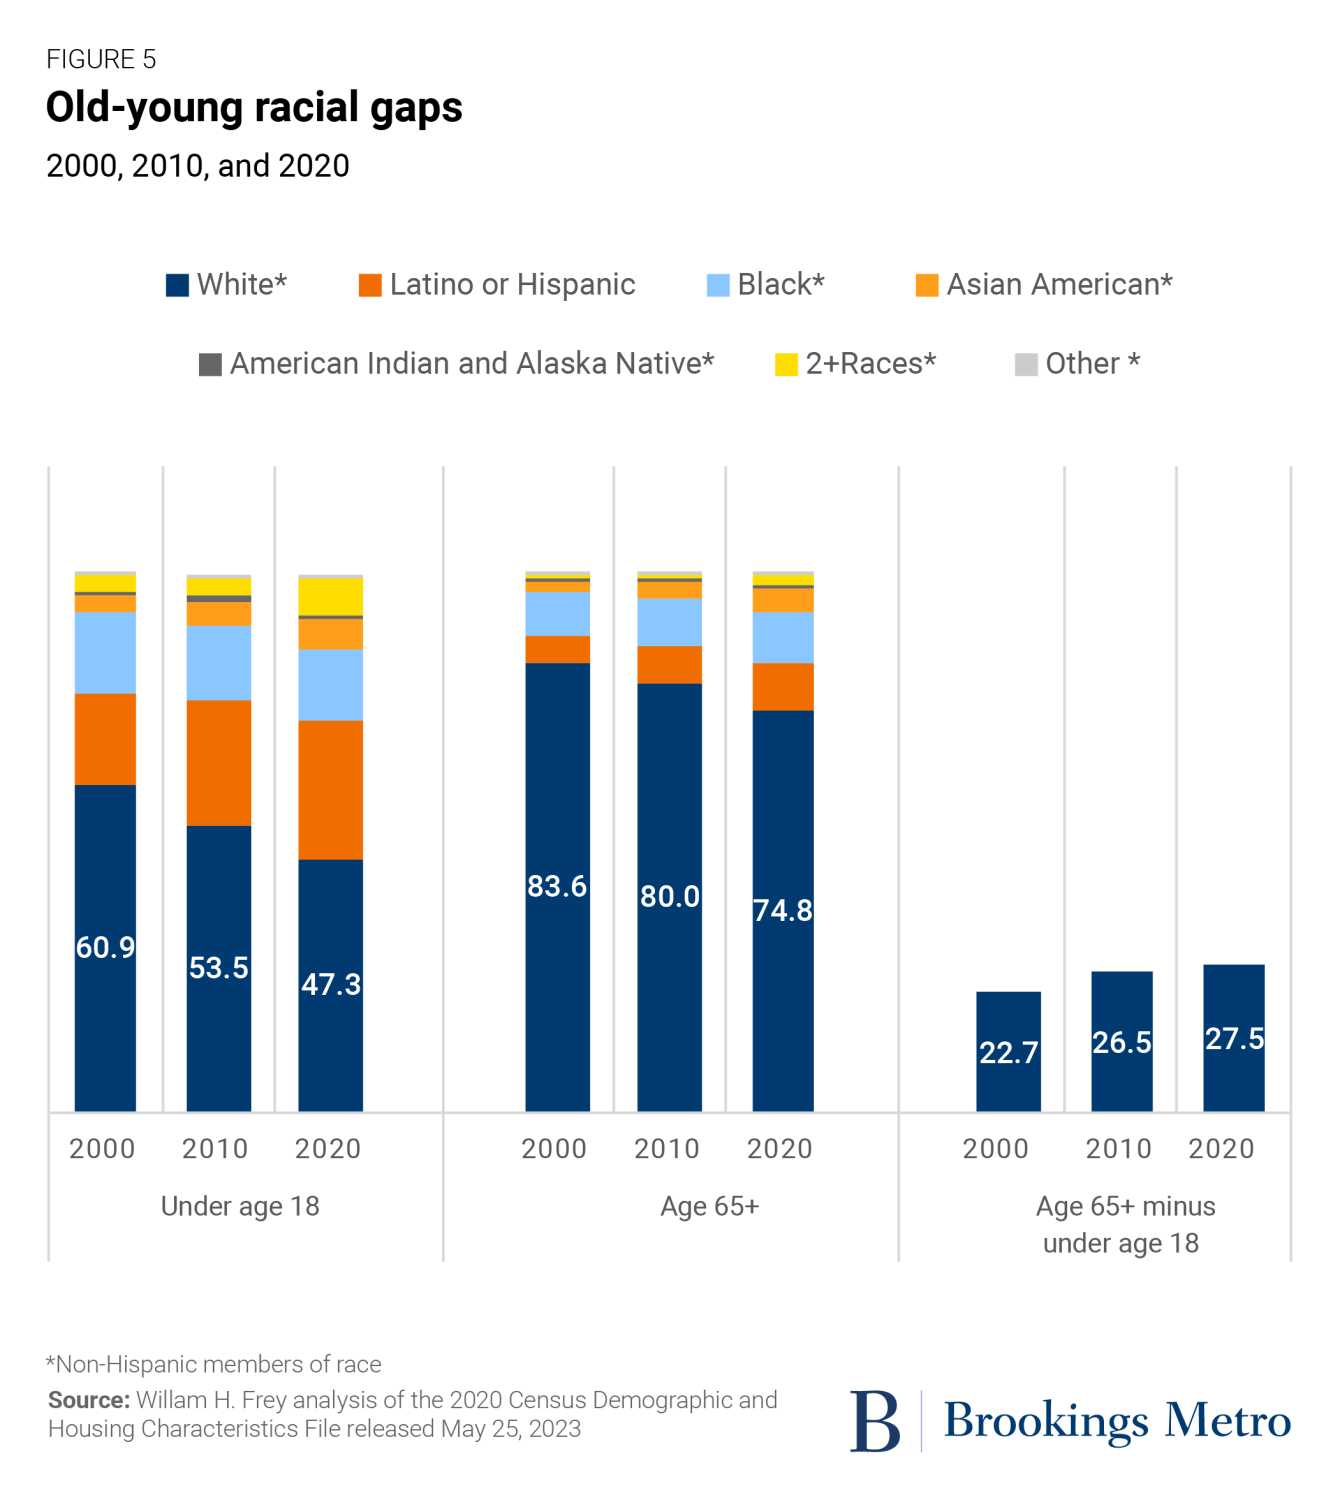
This is apparent in Figure 5, which shows trends in the race-ethnic makeup of the under-18 and 65-and-older populations over the past three censuses. In each, there is a clear gap in diversity between old and young age groups. In 2000, there is a “old-young racial gap” of 22.7%—this is the difference between the older age group’s white share (83.6%) and the younger group’s white share (60.9%). By 2020, although both older and younger age groups became more diverse (with an older white share of 74.8% and a younger white share of 47.3%), the old-young racial gap grew to 27.5%.
These gaps are important indicators of generational disparities on other social and economic dimensions, and more specifically, how communities of color are represented among children and young adults. So it is also useful to examine age-race distributions across states and major metro areas. These are shown in the interactive maps below, which classes states and major metro areas by the value of their old-young racial gap.
Among states, the highest old-young racial gap is in Arizona, where the difference between the white share of the older population and the white share of the younger population is 40.7%. This is a consequence of years of attracting older white retirees as well as younger, more diverse migrants. Other states with notable gaps are Nevada, New Mexico, Florida, California, and Texas. These are among the 24 states with old-young racial gaps greater than 25 percentage points; in total, 39 states register gaps above 20 percentage points. While the places with the largest old-young racial gaps tend to be in the South and West regions, the Northeast Corridor states of Delaware, Rhode Island, Connecticut, Massachusetts, and New Jersey also rank in the top 15. And several Midwestern states such as Minnesota, Illinois, Nebraska, and Kansas rank in the top half (see downloadable Table F).
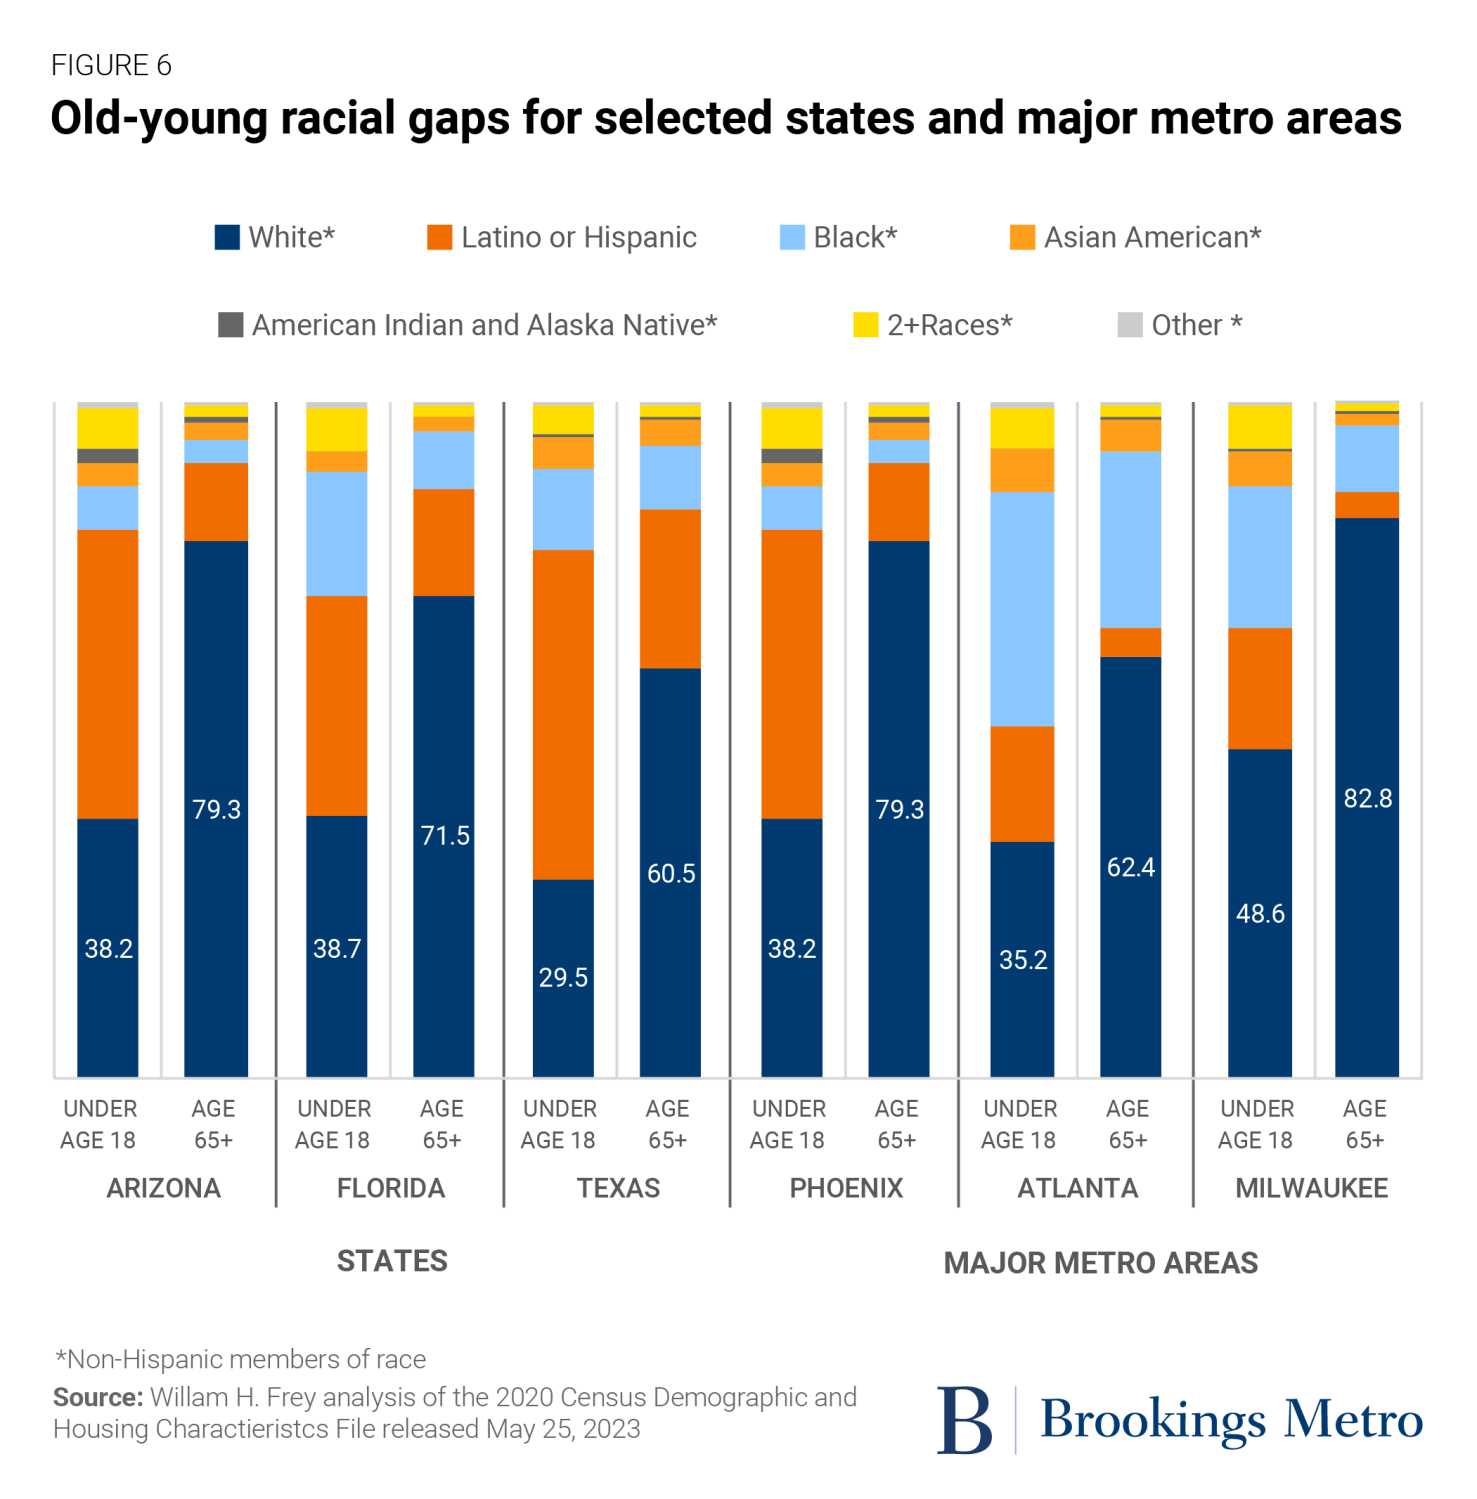
Among the 56 major metro areas, 17 have old-young racial gaps greater than 30 percentage points, and 37 of them have gaps greater than 25 percentage points. While Tucson, Ariz., Phoenix, and Las Vegas lead all others, high-gap metro areas are represented in all regions where different racial mixes prevail. This includes Atlanta, where the Black and Latino or Hispanic populations represent higher youth population shares, and Milwaukee, where the young population is more diverse than the predominantly white senior population.
While the old-young racial gap is larger in coastal states, growing areas, and large metro areas than in other parts of the country, it is still fairly pervasive. The gap exceeds 20 percentage points in 1,242 of the nation’s 3,142 counties, and is over 10 percentage points in more than two-thirds of the 3,142 counties. Most of the others are smaller non-metropolitan counties, many of which are becoming increasingly dependent on racial minority populations for their growth.
An aging nation with a diverse younger population
The newly released 2020 census statistics emphasize that the nation continues to age, in large part due to the ascension of the outsized baby boomer generation into its senior years. At the same time, the statistics show that nonwhite racial minorities are largely responsible for growth in the nation’s young and middle-aged populations.
As indicated in an earlier census release, the small decline in the nation’s youth population would be much larger were it not for the growth of Latino or Hispanic, Asian American, and other nonwhite populations, as well as those who identify as two or more races. The newest census data shows clearly that these minority groups are totally responsible for recent gains in the nation’s prime labor force age population.
More notably, the new statistics make plain that substantial old-young racial gaps exist in much of the country, and are likely to persist in the near term. This is reflected in a cultural generation gap that underlies many aspects of the nation’s social fabric and politics, including views about the recent Supreme Court decision on affirmative action and state proposals to limit teaching about race and diversity in public schools. The newly released census data can be used to bring about a better understanding of the nature of racial-generational shifts that are occurring in all parts of the country.
Author

Related Books
-
Footnotes
- Other than Latino or Hispanic, all racial groups discussed here are non-Hispanic members of those races. Also, racial categories refer to persons identifying with one race alone. Those identifying with moe than one race are classed as “2+ Races”
The Brookings Institution is committed to quality, independence, and impact.
We are supported by a diverse array of funders. In line with our values and policies, each Brookings publication represents the sole views of its author(s).


