This analysis is part of USC-Brookings Schaeffer Initiative on Health Policy, which is a partnership between the Center for Health Policy at Brookings and the University of Southern California Schaeffer Center for Health Policy & Economics. The Initiative aims to inform the national health care debate with rigorous, evidence-based analysis leading to practical recommendations using the collaborative strengths of USC and Brookings.
This analysis looked at an older version of the Senate’s Better Care Reconciliation Act (BCRA). A more recent analysis of the current version of the BCRA is available here.
Much attention has focused on how the recently introduced Senate Republican health care bill – the Better Care Reconciliation Act of 2017 (BCRA) – would impact health insurance premiums, both before and after accounting for lower subsidies, and patient cost-sharing in the individual market. In this analysis, we examine how the law would change people’s total spending on covered health care services, to provide a full picture of health care costs for the average consumer under the BCRA as opposed to current law.
We find that the BCRA would increase total costs for lower-income enrollees in all age groups. For higher-income enrollees, older enrollees would generally experience increases in costs, while younger enrollees would experience reductions in costs, though these reductions would be smaller than the increases experienced by older enrollees.
To construct estimates of the total health care costs (premiums plus out-of-pocket cost-sharing) that an individual market enrollee at different ages and incomes could expect to pay in 2026, on average, under the BCRA and under current law, we rely upon Congressional Budget Office (CBO) estimates of the BCRA. We focus on the year 2026 because CBO provides estimates in that year for individual market insurance premiums at different ages, under both the BCRA and current law. CBO highlights 2026 because it is the last year in the 10-year budget window within which they provide estimates and because it illustrates that law’s effects when fully in effect.
The following policy changes have the largest effects on enrollees’ total costs:
- The BCRA reduces the size of premium tax credits available under the ACA, by tying their value to the cost of a less generous health insurance plan (a plan with an actuarial value of 58 percent, as opposed to the 70 percent actuarial value plans that the ACA tax credits are tied to). The BCRA also adjusts the size of tax credits based on the enrollee’s age and income.
- The BCRA eliminates the ACA’s cost-sharing reduction subsidies that reduce the amount of out-of-pocket spending required for enrollees with incomes below 250 percent of the federal poverty line (FPL).
- The BCRA affects the risk pool in the individual market, and therefore insurance plan premiums before subsidies, primarily by repealing the ACA’s individual mandate, barring enrollment in individual market plans for 6 months for those who did not maintain continuous coverage, introducing a Patient and State Stability Fund, and reducing premium and cost-sharing subsidies.
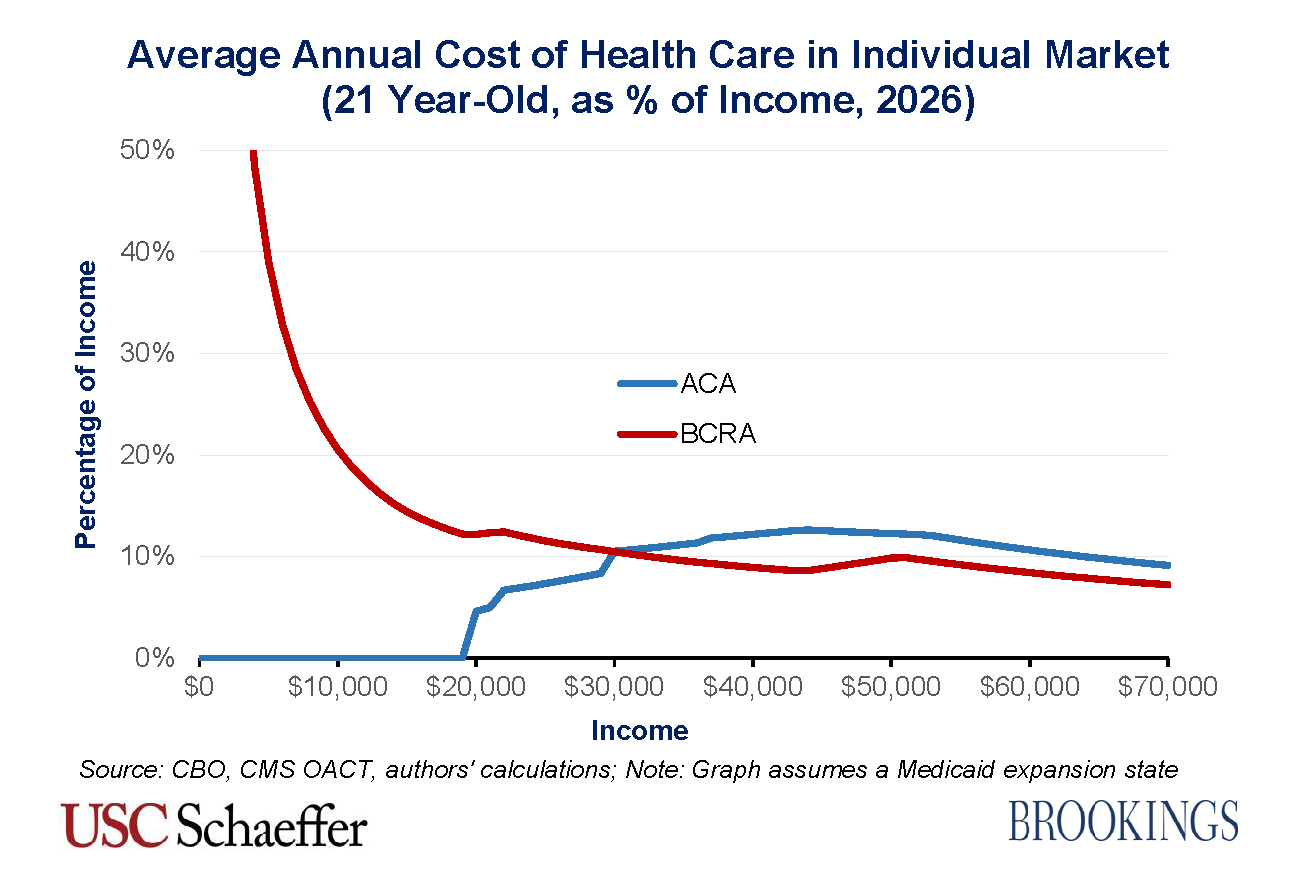
The remainder of this blog highlights this comparison for five different scenarios: a 21-year old individual, a 40-year old individual, a 64-year old individual, and a 64-year old couple.
21 year old

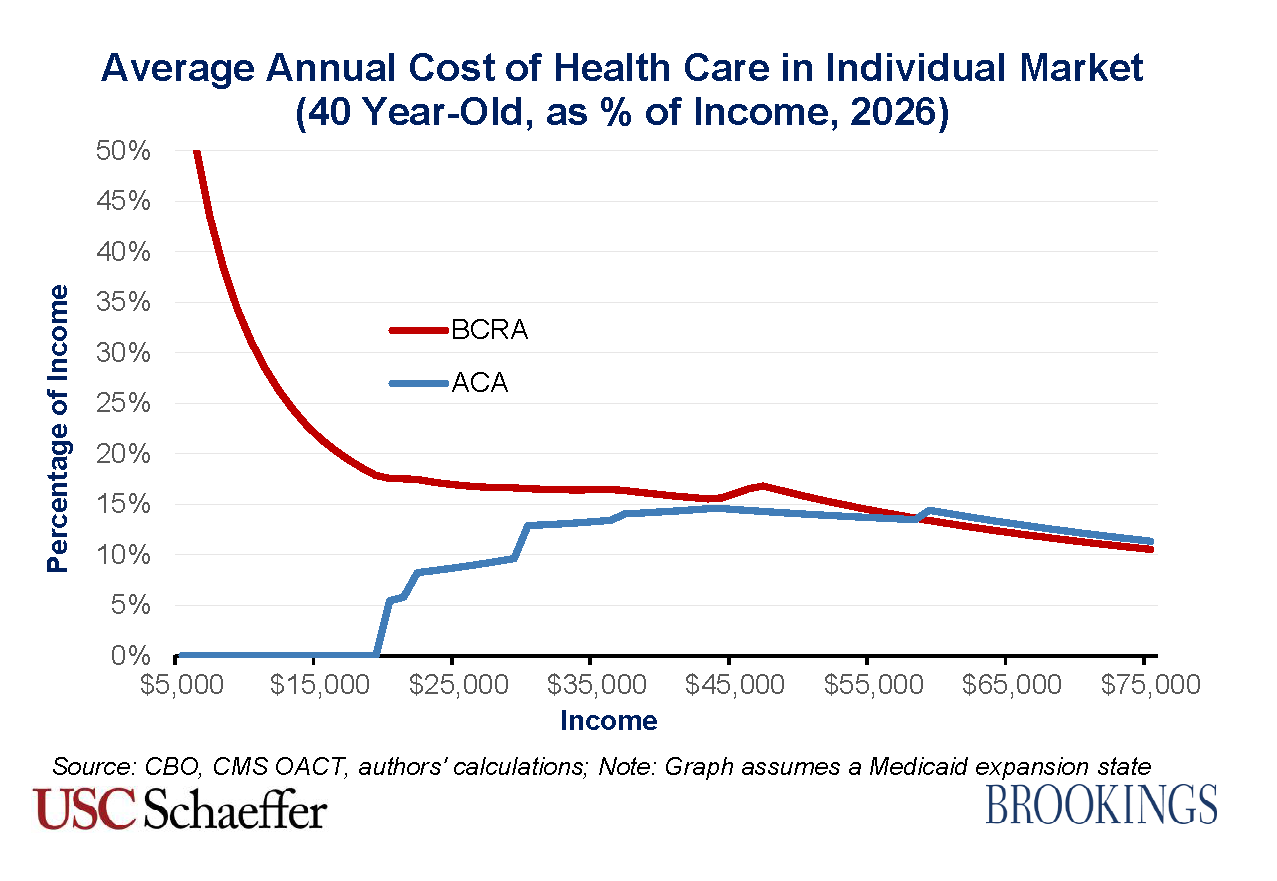
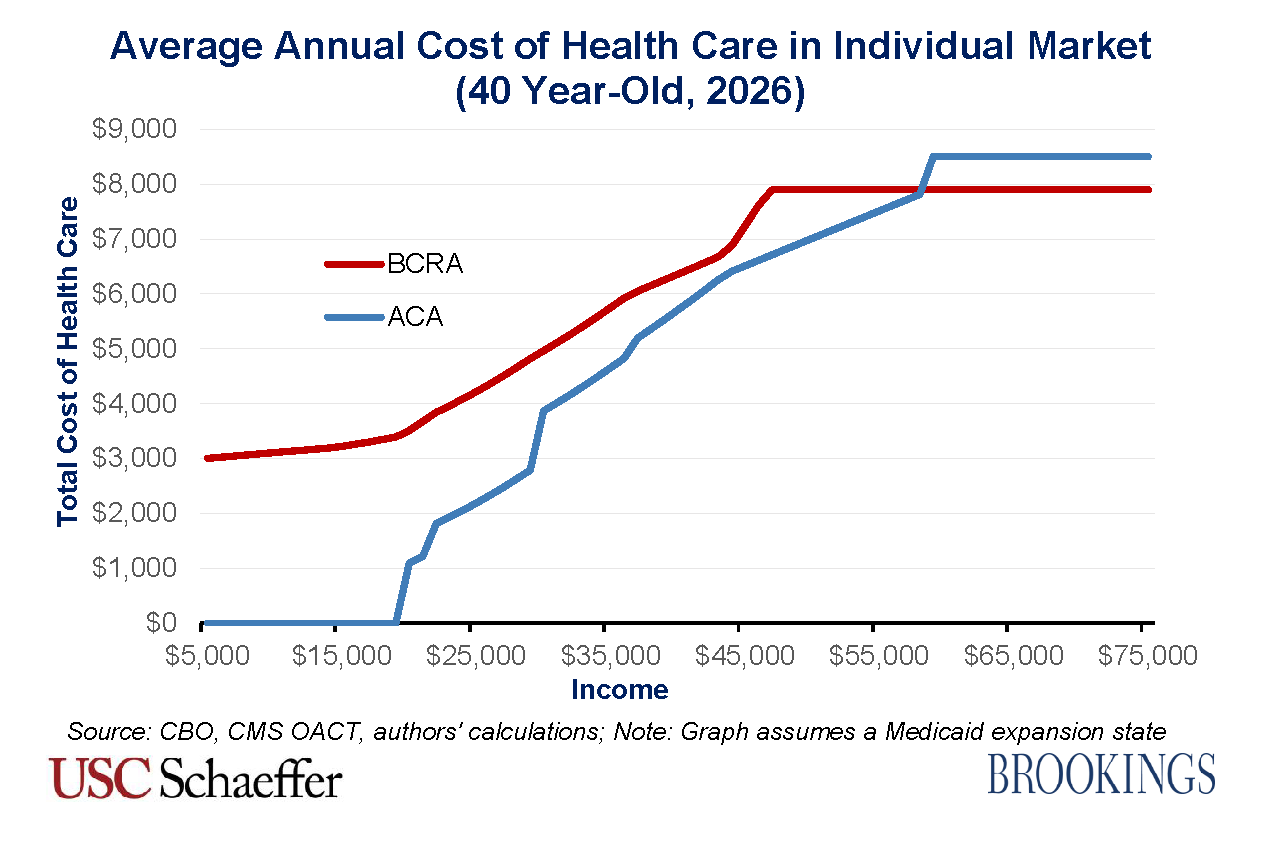
40 year old
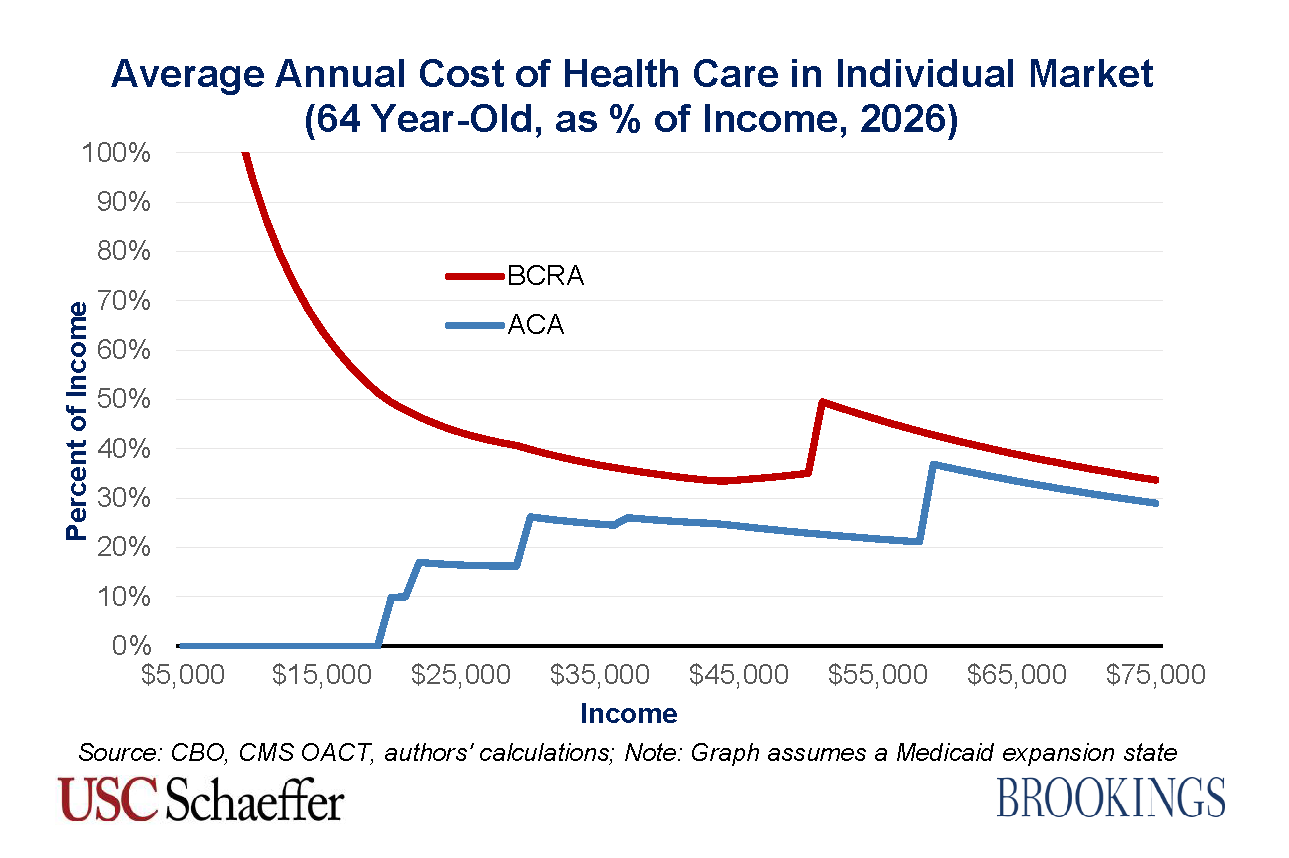
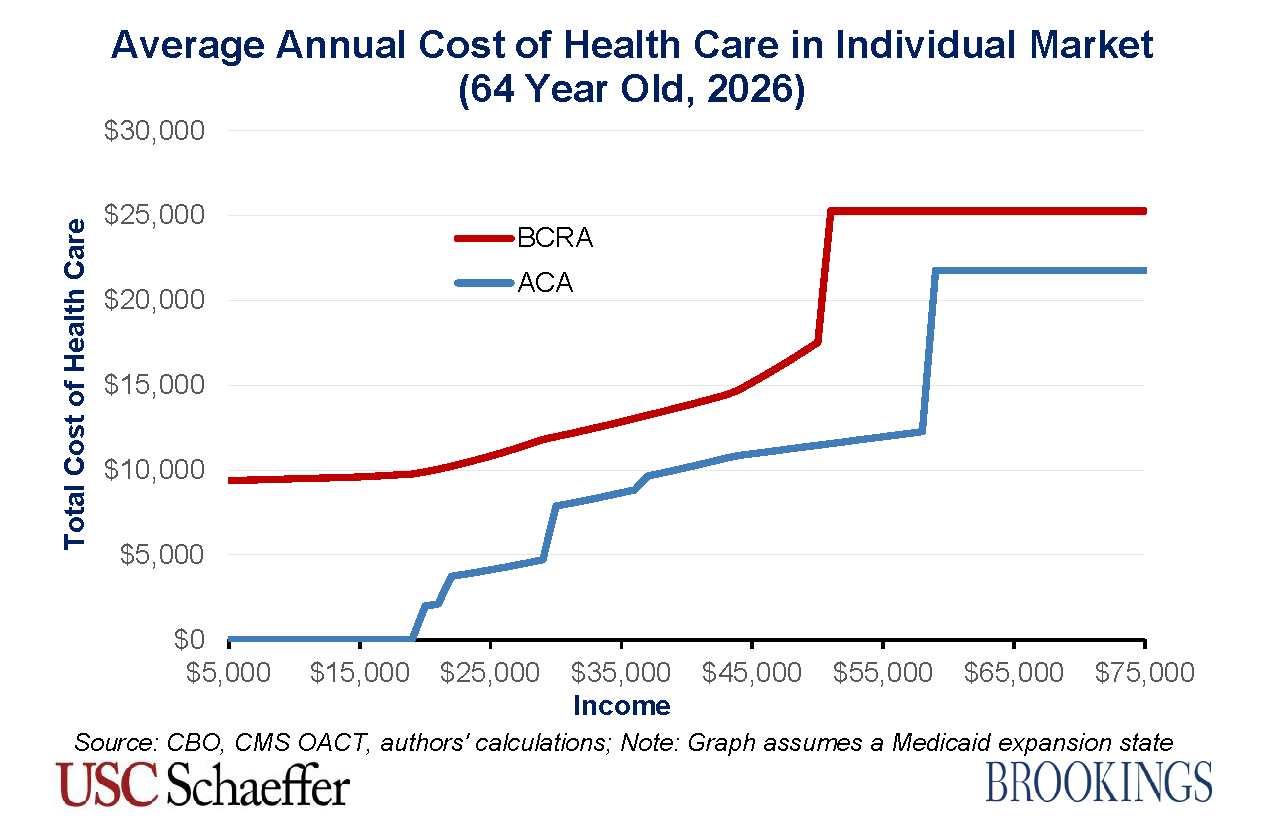
64 year old
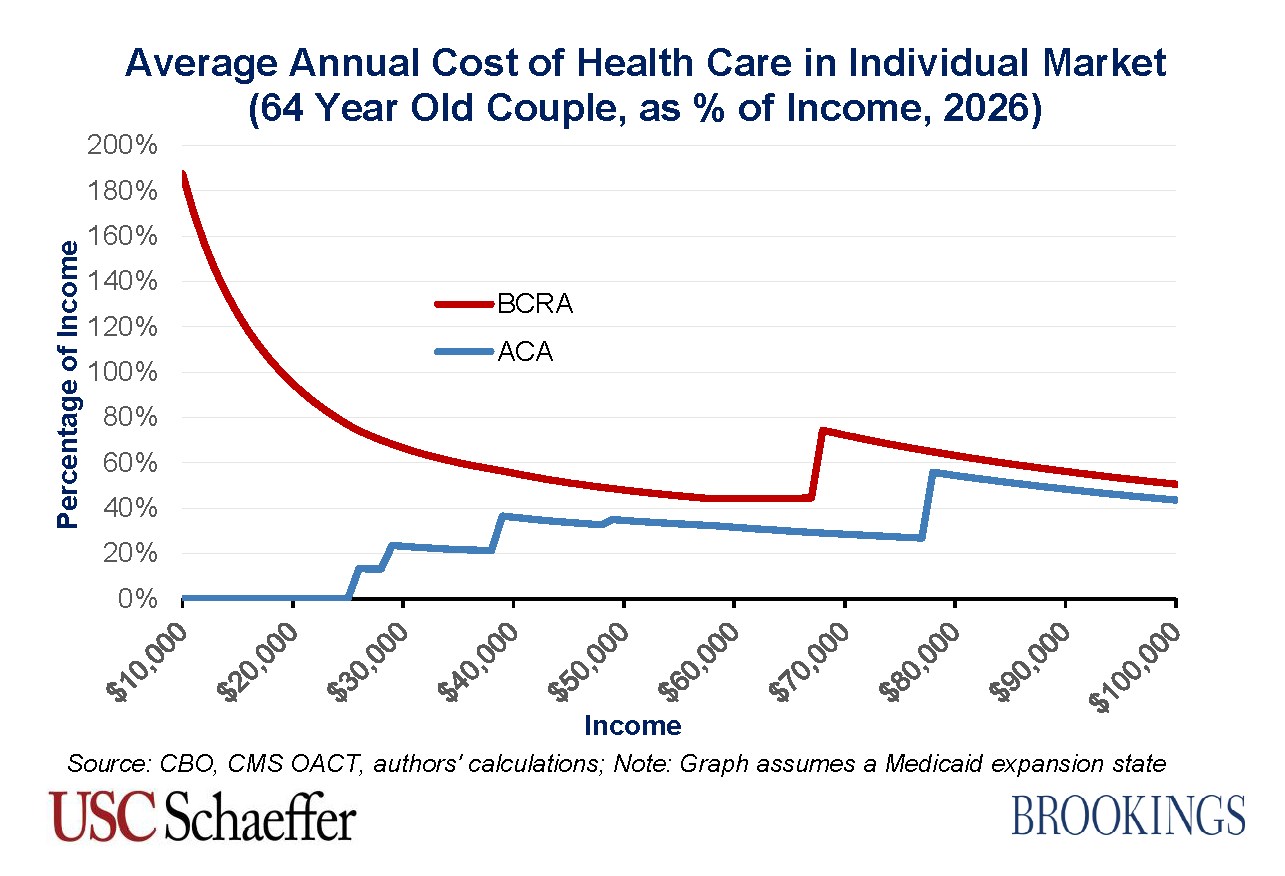
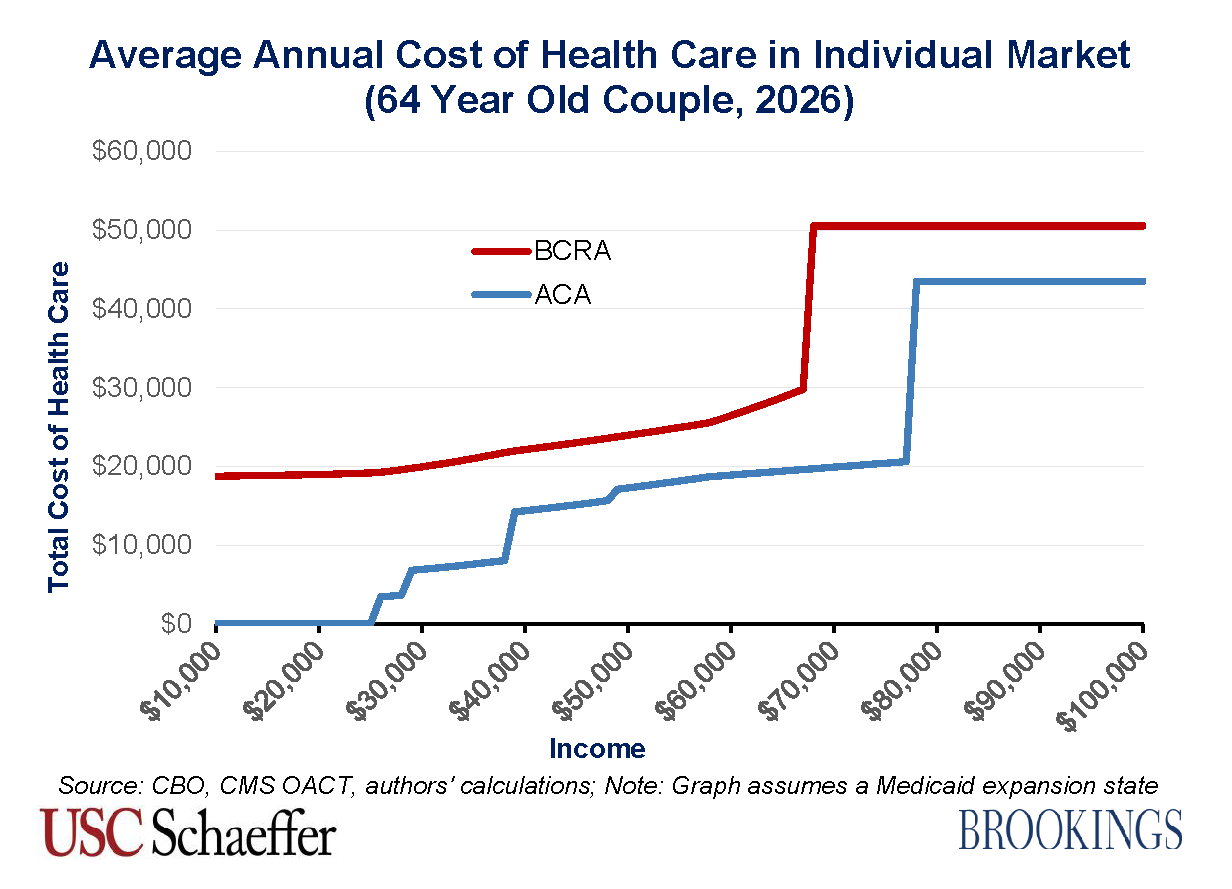
64 year old couple
conclusion
The most striking finding is that the BCRA would lead to a large increase in average annual health care costs for those with lower incomes, whatever their age and family type.
The most striking finding is that the BCRA would lead to a large increase in average annual health care costs for those with lower incomes, whatever their age and family type. The adverse impacts would be particularly pronounced for older enrollees with lower incomes. For example, a 64-year-old couple earning a combined income of $28,000 would go from average annual costs equal to 13 percent of their income under the ACA up to 70 percent of their income under the BCRA. The magnitude of this change stems in large part from the elimination of the ACA’s cost-sharing subsidies, which effectively reduce low-income enrollees’ out-of-pocket costs, and that unsubsidized average out-of-pocket costs are particularly high for a 64 year old couple.
The other major difference in average total costs occurs for older enrollees between 350 percent and 400 percent of the FPL, in which range the ACA offers sizeable premium tax credits but the BCRA does not provide any assistance.
For individual market enrollees younger than their mid-40s with high enough incomes, average annual total health care costs would be lower under the BCRA. However, the reduction in costs for such enrollees is generally much smaller than the increase in costs due to the BCRA for low income and older enrollees.
Methodological Appendix
This appendix explains how the “average annual cost of health care for individual market enrollees” in 2026 – the metric used throughout this analysis – is calculated for enrollees of different ages and incomes. The average annual cost of health care for an individual market enrollee is the average net premium paid plus their average out-of-pocket cost-sharing.
We start with the premiums estimated by CBO in 2026 for a “benchmark” plan for a 21, 40, and 64 year old under both the BCRA and current law. Premium tax credits are tied to the cost of these benchmark plans. Under current law, a benchmark plan has an actuarial value of 70 percent (meaning that it pays for 70 percent of covered health care services, on average). Under the BCRA, a benchmark plan has an actuarial value of 58 percent.
To calculate the net premium paid by an enrollee for a benchmark plan, we take the lower of the gross premium in 2026 estimated by CBO or the relevant percentage of their income specified by the premium tax credit schedules under the BCRA and ACA. In order to estimate the premium tax credit schedules in 2026, we adjust the affordability thresholds specified in the legislative language of both bills for 2014 by the extent to which employer insurance plan premium growth – as estimated by the Office of the Chief Actuary (OACT) at the Centers for Medicare and Medicaid Studies (CMS) – is projected to exceed personal income growth over that time period – as estimated by CBO. To estimate the federal poverty line in 2025 (which is used for 2026 subsidy calculations), we trend forward the levels in 2017 by CBO’s projections of Consumer Price Inflation for all Urban Consumers (CPI-U).
To calculate average out-of-pocket cost-sharing for an enrollee in 2026, we assume that 80 percent of insurance plan premiums are dedicated to claims costs. Under the BCRA, we simply multiply 80 percent of the gross benchmark plan premium by (4.2/5.8) to account for the plan’s 58 percent actuarial value. This approach implicitly assumes that the 5 to 1 premium variation between a 21 year old and 64 year old permitted under the BCRA accurately reflects the differences in claims costs by age.
Since premiums are constrained to vary by less than claims costs under current law, this approach would understate claims spending under the ACA—and thus out-of-pocket spending—for older adults and overstate that spending for younger adults. We thus proceed in two steps:
- First, we infer what CBO expects average per enrollee claims spending to be in 2026 under current law. To do so, we use the current law age curve to compute premiums at each age. We then compute a weighted average claims cost using a projection of the individual market age distribution in 2026 and multiply the resulting average premium by 80 percent. To project individual market enrollment by age in 2026, we base our estimates on tabulations of the 2015 American Community Survey (ACS) by single year of age. We count individuals as having individual market coverage if they report having directly purchased coverage and do not report coverage through an employer, Medicare, Medicaid, TRICARE, or the VA. We exclude individuals age 65 or older because these individuals are unlikely to have individual market major medical coverage. To project this enrollment distribution forward to 2026 under current law, we assume that enrollment in each age cohort grows in accordance with the Census Bureau’s most recent projection of overall population growth in that age cohort.
- Second, we distribute this spending across age groups under the assumption that the relative spending by different age groups matches the 5 to 1 age curve permitted under the BCRA. To do so, we must infer how CBO expects the age curve to change given the allowance of 5 to 1 premium variation. We assume that CBO used the same approach used by two research groups who previously analyzed the effects of this provision. Those groups assumed that the age factors for individuals ages 21 and older would be set equal to twice the age factors under current law minus 1; age factors for individuals under age 21 would be left unchanged. This approach exactly reproduces the ratios between the premiums for the three ages reported by CBO (apart from small differences that can be explained by rounding errors). For these calculations, we use the same individual market age distribution used in the first step.
With these age-specific claims costs in hand, we calculate average out-of-pocket costs associated with a benchmark plan under current law (before incorporating the effects of the ACA’s cost-sharing reduction subsidies) by multiplying those amounts by 3/7, reflecting the ratio of out-of-pocket costs to plan spending under the benchmark plan. For enrollees with incomes at or below 250 percent of the FPL, who receive federal subsidies to assist with cost-sharing, we use a lower ratio to reflect the fact that a portion of out-of-pocket spending is covered by cost-sharing reductions.
Related Content

Authors


The Brookings Institution is committed to quality, independence, and impact.
We are supported by a diverse array of funders. In line with our values and policies, each Brookings publication represents the sole views of its author(s).


Commentary
How the BCRA would impact enrollee costs, according to your age
July 12, 2017