The No Surprises Act (NSA) was enacted in 2022 to protect patients from “surprise” bills for out-of-network care. Under the law, the amount a patient owes for out-of-network emergency care and non-emergency services delivered at in-network facilities cannot exceed the cost-sharing the patient would owe for similar in-network care. The law also created an independent dispute resolution (IDR) process to adjudicate disputes between insurers and providers over payment for affected out-of-network services. IDR is a binding final-offer arbitration process in which each party makes an offer and an arbitrator, called an “IDR entity,” chooses one of those offers to be the final payment amount.
On February 15, the Centers for Medicare and Medicaid Services (CMS) released detailed data on IDR disputes decided during the first half of 2023, the first such data release. We use these data to analyze several aspects of how the IDR process is operating so far, including how much providers and insurers are offering in IDR and what amounts IDR entities are ultimately deciding upon.
Looking across three categories of services, we find that the median IDR decision is at least 3.7 times what Medicare would pay. For the two categories of services where we have estimates of historical mean in-network commercial prices relative to Medicare, the median decision is at least 50% higher than these past prices. Decisions appear closer to the amounts insurers historically paid for out-of-network care. These outcomes reflect the fact that providers are submitting relatively high offers and that IDR entities are selecting the provider’s offer more than three-quarters of the time. And they contrast with Congressional Budget Office (CBO) projections that outcomes would hew close to prior in-network rates.
We also discuss what this experience portends for the overall prices of these services and, in turn, for insurance premiums. This is uncertain because it is unclear whether the outcomes seen so far are representative of what typical providers could obtain in IDR, how disputing parties’ and IDR entities’ behavior may change in the future, and what these outcomes imply for negotiations over in-network prices (and prices for out-of-network services that never reach IDR). Nevertheless, we conclude that there is a realistic possibility that the NSA will raise in-network prices and premiums, the opposite of what CBO predicted at enactment and something that the lawmakers who crafted the law said they wished to avoid.
Background on the IDR process
Under the NSA, after a relevant out-of-network service is delivered, the provider submits a claim and the insurer issues an initial payment (or denial of payment). If the provider is dissatisfied with the insurer’s payment, it may initiate a 30-day open negotiation period. At the conclusion of that period, either party may initiate IDR. In practice, the party initiating IDR is essentially always the provider.
When IDR is triggered, the parties may select an IDR entity by mutual agreement from the list of IDR entities certified by the federal government. If the parties cannot agree, then the federal government randomly selects an IDR entity from the list of certified entities. The IDR entity is charged with collecting evidence and payment offers from the parties and selecting one offer as the final payment amount.
IDR entities are required to consider several factors when choosing between offers. One factor is the qualifying payment amount (QPA), an insurer-specific median of contracted rates for a service, insurance type, and geography in 2019, adjusted for inflation. They must also consider several “additional circumstances”, including: various characteristics of the provider (e.g., quality, experience, or teaching status); each party’s market share; patient acuity; prior contracting efforts and/or prior contracted rates between the parties; and, for air ambulance transports, the type of vehicle and population density at the pickup location. Disputing parties may present (and IDR entities may request) other information, but IDR entities may not consider either the provider’s charges or public program payment rates.
The federal agencies charged with implementing the NSA issued guidance to IDR entities on how to interpret these factors and how to integrate them when making decisions. In general, that guidance directed IDR entities to consider all the evidence before them but assigned a focal role to the QPA. Two rounds of guidance in this vein have now been blocked in court following lawsuits from provider groups. The second round of guidance was blocked in early February 2023. Thus, for most of the period we examine here, IDR entities operated with little substantive guidance on how to reach payment decisions.
For each dispute that proceeds to go to IDR, both parties pay an IDR initiation fee that covers the federal government’s cost of operating the process. That fee was $350 per party during the period covered by the sample of disputes we consider here, but was later reduced to $115 per party. The losing party pays an additional fee to cover the IDR entity’s costs, which averaged $457 for the disputes we analyze here.1
Overview of data and methods
The data published by CMS cover the 83,849 disputes decided from January 1, 2023 to June 30, 2023. Many disputes include more than one line item (service); the total number of line items is 184,526.
CMS released two different line-item-level files, each of which contains different information. The first contains the service code (typically a CPT/HCPCS code) for the line item, information about the identity of the insurer and provider, and limited information about the dispute outcome. The second contains the service code, the geographic region where the service was provided, and full information about the outcome of the dispute, including the dollar amount of the QPA, plan and provider offers, and the final IDR decision. Dollar amounts are suppressed for services with fewer than 10 line items in a geographic region and quarter. There is no shared identifier that can be used to link the two files.
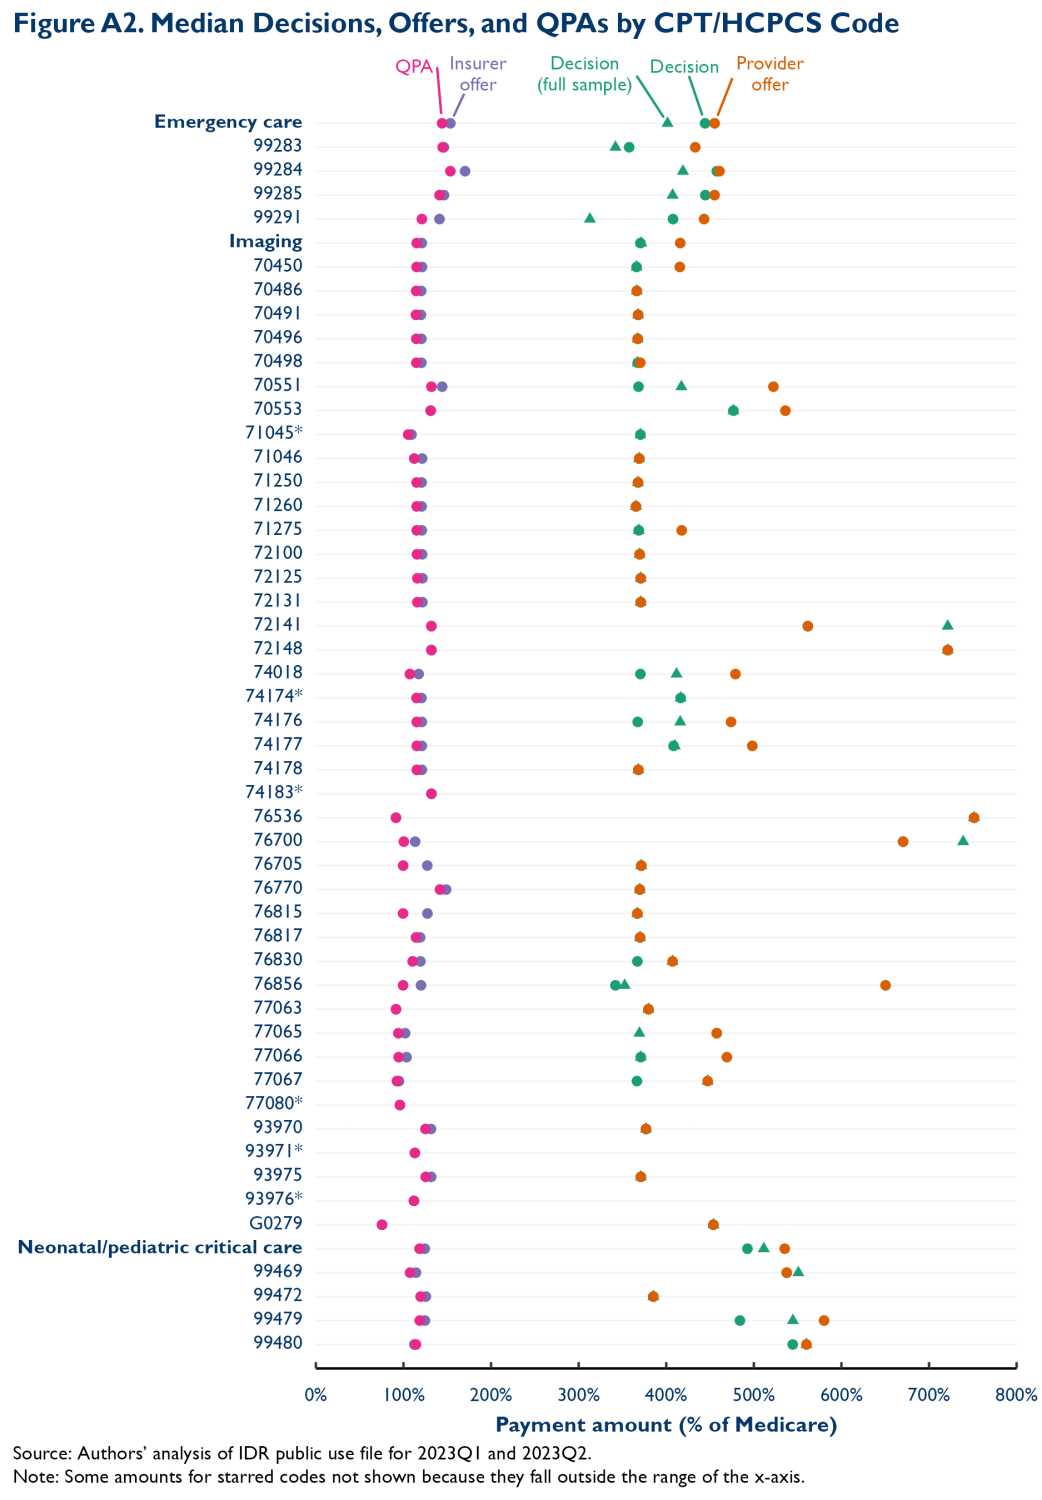
In this analysis, we focus on three types of professional services: emergency care, imaging, and neonatal/pediatric critical care. Within those categories, we identify CPT/HCPCS codes for which: (1) there are at least 200 line items during the first half of 2023; and (2) the payment amount selected by the IDR entity is missing for less than 35% of those line items. We then exclude some imaging codes for which the Medicare rate depends on whether the imaging is performed on one or both sides of the body, which is not possible to ascertain in these data.2 This results in a list of 49 CPT/HCPCS codes that collectively account for 75% of all line items in the data. The full list of included codes is reported in Appendix Figure A2. The methodological appendix provides additional methodological detail.
IDR decisions greatly exceed Medicare rates and prior in-network commercial market prices
We first examine the prices decided upon by IDR entities. In doing so, we exclude the 10% of line items where the IDR decision is missing. Most missing data is due to CMS’ small-cell suppression policy.
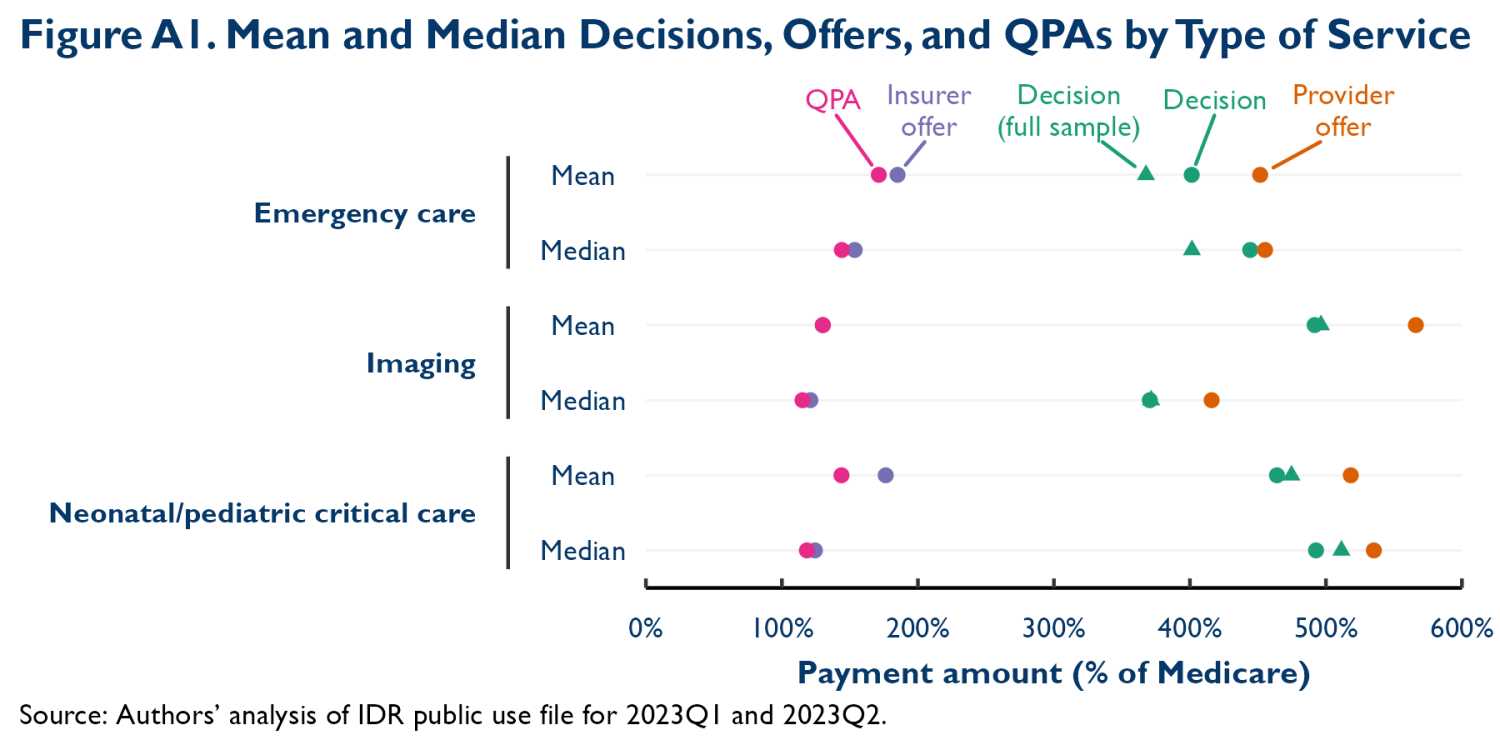
Figure 1 reports median IDR decisions for the three categories of services.3 Median decisions greatly exceed Medicare prices, by a factor of 3.7 or more for all three service types. We report medians rather than means because the data include some extreme outlier decision amounts that we suspect may be data errors. However, Appendix Figure A1 presents mean decisions, which are qualitatively similar.
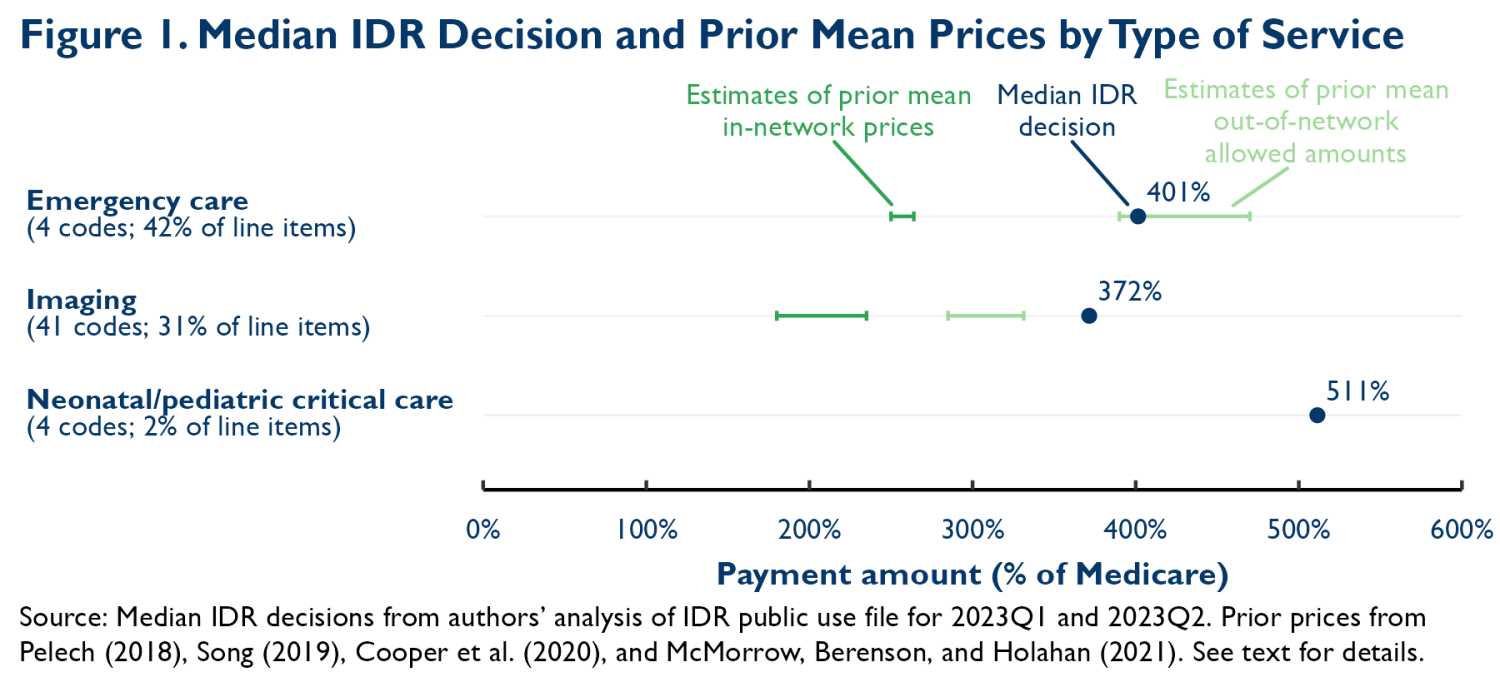
The prices emerging from IDR also appear to greatly exceed estimates of historical mean in-network commercial prices for these services. We examined four studies using data for 2014 or later that reported mean in-network prices for emergency care services, imaging services, or both relative to Medicare’s prices.4 For emergency care, estimates ranged from 2.5 to 2.6 times Medicare’s price. For imaging, estimates ranged from 1.8 to 2.4 times Medicare’s price. For both categories, median IDR decisions relative to Medicare are at least 50% higher than even the top end of these ranges. We are not aware of similar estimates for neonatal/pediatric critical care services, so we cannot make similar comparisons.
Typical IDR decisions appear more similar to the allowed amounts that insurers historically set for the minority of services delivered out-of-network. Two of the studies cited above also examined mean out-of-network allowed amounts relative to Medicare’s prices. For emergency care, those estimates ranged from 3.9 to 4.7 times Medicare’s prices. For imaging services, estimates ranged from 2.9 to 3.3 times Medicare’s prices. We note that the insurer’s allowed amount does not necessarily reflect how much the provider actually collected for these services and that neither the allowed amount nor the IDR decision may reflect any non-pecuniary costs that provider or insurers may incur with respect to out-of-network care. We discuss these issues—and their implications for the NSA’s ultimate effects—in more detail below.
Comparing median decisions, offers, and QPAs
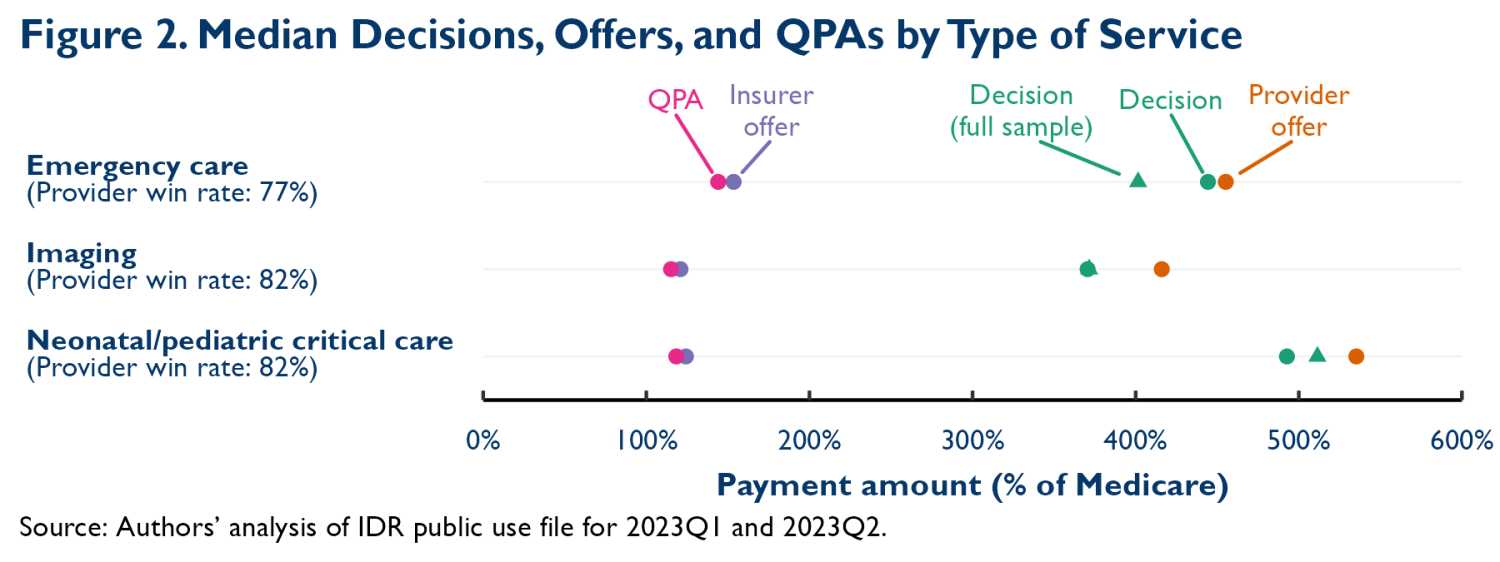
We next examine the parties’ offers and QPAs alongside IDR decisions. In doing so, we limit the sample to line items that report all four relevant payment amounts. This reduces our sample somewhat. Whereas only 10% of line items have a missing IDR decision, 35% are missing at least one payment amount. Around four-fifths of the incremental line items with missing data are from disputes where the provider, insurer, or both failed to respond to the IDR entity, which results in at least one of the parties’ offers and often the QPA being missing. (We do find that median IDR decisions are broadly similar in the two samples, which suggests that the sample with complete data is reasonably representative.)
Figure 2 reports the resulting estimates. They indicate that the high IDR decisions reported above reflect a combination of high provider offers and high provider win rates. Insurer offers, on the other hand, tend to be slightly higher than the relevant QPAs. The QPAs, in turn, are well below the estimates of pre-NSA mean in-network prices presented above. This finding is directionally consistent with prior analyses that found that median in-network prices were lower than mean in-network prices for these services. However, these median QPAs are at least 35% lower than even the low-end estimates of prior mean in-network prices cited above, a larger difference than the 10-20% difference typically observed in prior work.5
Comparing early IDR results to CBO’s projections
The IDR outcomes documented above contrast with some projections of the law’s effects. Notably, CBO anticipated that IDR decisions would hew relatively close to the QPA (since the QPA is one of the key factors IDR entities are required to consider when deciding cases) and that, on average, QPAs would be around 15% lower than mean in-network rates.6 In the disputes we have analyzed here, the QPA has indeed been lower than what mean in-network rates likely would have been absent the law—and by a larger margin than CBO anticipated—but actual IDR decisions have far exceeded the QPA.
Why IDR entities have favored offers far above the QPA (and far above even historical mean in-network prices) is not clear. One hypothesis, which accords with what we have heard anecdotally from some market participants, is that providers are submitting information on pre-NSA out-of-network allowed amounts and that IDR entities are gravitating toward these amounts. Consistent with this hypothesis, IDR decisions are much closer to prior out-of-network allowed amounts than to either the QPA or prior mean in-network prices, as shown in the figures. Another hypothesis is that IDR entities are placing substantial weight on prior contracted rates between the disputing parties, a factor that the law requires IDR entities to consider alongside the QPA. In this vein, it is notable that large investor-backed provider groups have accounted for a large and disproportionate share of IDR cases; practices affiliated with just four such companies (TeamHealth, SCP Health, Envision, and Radiology Partners) generated 74% of line items in our sample.7 These types of firms were historically able to negotiate above-average rates, likely at least partly because they were aggressive in using the threat of surprise billing as leverage. It is unclear, however, that even these firms’ contracted rates were as high as the prices now emerging from IDR. In any case, how IDR entities are making decisions is an area that warrants additional research.
Another question is why QPAs appear to be farther below historical mean in-network rates than might have been expected based on prior comparisons of mean and median in-network rates, including CBO’s. One potential explanation is that the methodology for calculating the QPA under the NSA weights each historical contracted rate equally (regardless of the volume of services delivered under that contract), whereas prior research generally calculated volume-weighted medians (partly due to data limitations). If insurers’ highest-volume contracts also specified the highest prices, then a contract-weighted median could be lower than a volume-weighted one.8 Indeed, some prior work that tried to mimic the lack of volume weighting in the QPA calculation did find that this led to somewhat lower QPAs, albeit not to the degree observed here. A related explanation advanced by some provider groups is that insurers are (contrary to what the law requires) sometimes including rates negotiated with providers in specialties that rarely or never provide the relevant services when calculating QPAs. If these rates tend to be lower, that could also reduce the QPA. Another possibility is that the insurers ending up in IDR simply have unusually low QPAs. One way this could have occurred is if insurers expected offers close to the QPA to prevail in IDR, while providers expected to do better, as this would make reaching agreement outside of IDR difficult.
What these results portend for the overall prices of the relevant services and, in turn, insurance premiums hinges on three unknowns: (1) whether these outcomes are representative of what a typical provider could obtain in IDR; (2) how disputing parties’ and IDR entities’ behavior may change in the future; and (3) perhaps most importantly, what these outcomes imply for negotiations over in-network prices (and prices for out-of-network services that never reach IDR). We close by discussing each in turn.
How representative are these outcomes of what typical providers could obtain in IDR?
The prices a typical provider could obtain by going to IDR might differ from the prices that have emerged from IDR so far. As noted above, physicians affiliated with just four large firms accounted for 74% of line items we analyzed here. These companies’ scale might make it easier for them to assemble evidence that IDR entities find compelling. As discussed above, they may also have had particularly high prior contracted rates and be able to submit evidence of this to IDR entities. On the other hand, IDR entities might be more sympathetic to smaller physician practices than to larger companies, in which case smaller practices might actually do better in IDR than the providers that have heavily used IDR to date; IDR entities are also instructed to consider the provider’s market share, as well as the insurer’s, when making decisions, although it is unclear which direction this would push IDR decisions.
More generally, providers could be selectively initiating IDR when they believe they have a particularly strong case to make, which could make the cases to date unrepresentative along other dimensions as well. However, strong cases may not always be likely to end up in IDR. Where insurers can recognize that providers have a strong case, they might be more willing to agree to a high price outside of IDR in order to avoid the costs associated with IDR, thereby preventing the case from entering IDR.
How might disputing parties’ and IDR entities’ approaches to IDR change in the future?
In light of providers’ high win rates so far, insurers and providers will likely change how they approach IDR going forward.9 Concretely, insurers may raise their offers in hopes of winning more often, providers may raise their offers in hopes of receiving higher prices in the many cases they currently win, or both. Whether this adjustment process will ultimately result in higher or lower prices, on net, is unclear. (It is, however, likely that providers’ win rate will decline as a result of these adjustments.)
IDR entities’ behavior could also change over time for multiple reasons. First, the guidance that the federal government has given to IDR entities could change. Notably, whether the federal government wins its appeal seeking to reinstate its prior guidance to IDR entities could directly affect future IDR decisions. Second, changes in disputing parties’ offer behavior could directly affect what IDR entities view as reasonable. For example, if insurers begin routinely offering amounts well above the QPA, that could lead IDR entities to view the QPA as a less reasonable benchmark and assign it even less weight than they already are, likely increasing prices. Third, because IDR entities can sometimes be chosen by mutual agreement of the parties, they have incentives to behave similarly to other IDR entities (since an IDR entity that is more provider-friendly than the average will be unacceptable to insurers and vice versa). As more information on IDR outcomes becomes available, IDR entities may recalibrate their approaches, although it is not immediately clear how this process might change prices on net.
What do these IDR outcomes imply for in-network (and other out-of-network) prices?
The final—and perhaps most important—question is what the prices emerging from IDR imply for the prices of relevant in-network services (the large majority of relevant services) and out-of-network services that never go to IDR. Economic theory implies that outcomes when providers and insurers fail to reach agreement powerfully influence the prices they negotiate when they do reach agreement; neither providers nor insurers are likely to agree to prices that leave them worse off than they would be absent an agreement. Thus, a central question is how the consequences of going out of network and relying on IDR in the post-NSA world compare to those of going out of network before the NSA.
Our finding that IDR decisions are at least broadly similar to prior mean out-of-network allowed amounts suggests that the amount of money providers can collect when out-of-network might not change dramatically, at least on average. For emergency services, some decline in collections is possible since our estimate of the median IDR decision is near the bottom of the range of estimates of prior out-of-network allowed amounts and providers can no longer balance bill patients in an effort to collect money in excess of the insurer’s allowed amount. For imaging services, on the other hand, collections might increase; while these providers can no longer balance bill, typical IDR decisions have been above prior mean out-of-network allowed amounts and cost-sharing is now limited to what a patient would owe in-network (which was already true for emergency services), making incomplete payment of cost-sharing less likely.
The non-pecuniary consequences of being out-of-network may change more substantially. Indeed, where being out-of-network often required providers to collect larger amounts directly from patients, being out-of-network may have come with substantial hassle and reputational costs for providers. Being out-of-network may also have exposed providers to a risk of sudden cash flow changes since insurers could unilaterally change out-of-network allowed amounts. Avoiding these (and, perhaps, other) costs of being out-of-network is presumably part of why providers were willing to accept in-network prices well below insurers’ typical out-of-network allowed amounts. With these costs now less salient, being out-of-network may now be somewhat more attractive for providers, even if collections are roughly unchanged.
IDR does involve new costs, including fees paid by IDR participants and costs of assembling and submitting evidence to the IDR entity. But because these costs fall roughly equally on providers and insurers, they may have little effect on providers’ and insurers’ relative eagerness to reach network agreements and, correspondingly, on in-network prices. Of course, it is possible that the ability to bear these costs could vary across provider and insurers. On this point, it is notable that IDR has been disproportionately used by relatively large and sophisticated providers. This could be an indication that these types of providers are better able to bear the costs of relying on IDR and, thus, that they may be able to derive more leverage from threatening to rely on IDR, although other providers may “catch up” over time.
On balance, if the IDR decisions seen so far reflect what providers can hope to receive going forward, we believe it is unlikely that being out-of-network has become much less attractive to providers (relative to insurers) than it was before the NSA, and it may have become more attractive, perhaps particularly for non-emergency services. Thus, we see a realistic possibility that the NSA will place upward pressure on in-network (through perhaps not out-of-network) prices for the relevant services and, in turn, premiums, although it is also plausible that these amounts will remain roughly unchanged.10 Either outcome would contrast with CBO’s prediction that in-network prices would converge to the QPA (the expected IDR outcome in CBO’s analysis), thereby reducing in-network prices and premiums. It also appears that lawmakers’ stated goal of eliminating surprise billing without increasing premiums is in real jeopardy.
Methodological Appendix
The main text describes how we identify the CPT/HCPCS codes of interest and define our two main analytic samples. This appendix describes two other aspects of the analysis: (1) how we account for the presence of line items outside the scope of our analysis; and (2) how we assign Medicare rates to line items.
Accounting for out-of-scope line items
Our goal in this analysis is to understand the prices emerging from IDR for specific professional services. However, some of the line items in the data correspond to facility services since facilities can sometimes bill under the same CPT/HCPCS codes. Additionally, multiple services associated with a single episode of care can sometimes be bundled together in a single IDR dispute. In those cases, the payment amount reported for a line item may represent payment for the bundle, not the individual service.
Ideally, we would exclude these line items from our analysis. Unfortunately, the IDR file that reports the payment amounts (which we call the “payment file”) does not include the fields necessary to do so, so we must use a different approach. We first calculate the share of line items for each CPT/HCPCS code that are submitted by facilities or representing a broader bundle in the other IDR file (which we call the “characteristics file”), as this file does include the requisite information. Then, when doing calculations in the payment file, we exclude the largest reported payment amounts from our calculations, with the share excluded equaling the share estimated using the characteristics file. In essence, this approach assumes that the out-of-scope line items all fall at the top of the observed distribution. This is likely a reasonable approximation since most of these line items, particularly those corresponding to facility claims, should have unusually high payment amounts. To the extent that this assumption is incorrect, our estimates will be biased downward and, thus, somewhat conservative.
A complication is that the characteristics file does not directly report whether a line item is a professional or facility claim. Rather, we must infer this from other information on the file. To do so, we first match the National Provider Identifier (NPI) reported for the relevant line item to the National Plan and Provider Enumeration System (NPPES) to obtain the primary taxonomy code for that NPI. Approximately 74% of line items match the NPPES, and virtually all failed matches are line items that lack an NPI. If a line item matches the NPPES and the taxonomy code is an “individual” code, then we consider the line item to be professional. We classify another 15% of line items as professional because they report the exact same provider name as one or more line items that do match the NPPES and all such line items are professional. We then classify an additional 8% of line items as professional based on the name or email domain of the provider;11 for line items with valid NPIs, this procedure would have erroneously assigned professional status in only 0.4% of cases. We are left with 3% of line items unclassified. Manual inspection of these line items suggests that almost all were submitted by facilities, so we assume, conservatively, that all were.
An additional complication is that we cannot exactly align the characteristics file sample used to compute the “exclusion shares” with the payment file sample used for payment calculations. This is because the characteristics file does not consistently report whether a valid payment amount is reported for a line item, so we cannot determine whether that line item will be included in the payment sample. We can, however, come close to aligning the two samples. When computing exclusion shares for analyses that involve only IDR decisions (e.g., the analyses presented in Figure 1), we exclude line items that lack information on whether the provider or insurer offer was ultimately selected since these line items never have a valid IDR decision in the payment file; this results in a characteristics file sample that is only 9% larger than the payment file sample. When computing exclusion shares for analyses that involve all payment amounts (e.g., the analyses presented in Figure 2), we also exclude line items where the IDR entity entered a default decision, as these line items are always missing at least one party’s offer in the payment file, resulting in a characteristics file sample that is 16% larger than the payment file sample.
Our final exclusion shares are virtually identical in both samples. We exclude 11% of emergency care line items and very small shares (less than one percent) of other line items. The exclusion shares are larger for the emergency care line items mainly because the NSA protections only apply to facility billing in emergency situations, so facility claims are overrepresented among those line items.
Assigning Medicare rates
To assign Medicare rates, we begin with the Physician Fee Schedule (PFS) National Payment Amount file published by CMS, which reports payment amounts for each CPT/HCPCS code and each PFS payment locality. For each CPT/HCPCS code of interest, we select the rate that applies to services delivered in a facility. Where applicable, we choose the payment rate applicable to a provider that bills only for the professional component (using modifier 26) since we are interested in the amount Medicare would pay for a professional claim for the service and the technical component is billed by the facility in our setting.12 We reduce these payment rates by 2% to account for sequestration under the Budget Control Act.
For some of the imaging codes we analyze, the professional component of the Medicare rate is subject to a 5% reduction if the service (or a similar service) is performed multiple times on the same patient in the same day. We are unable to observe whether this is the case in our data, so we do not apply this reduction. Because this reduction likely affects a small fraction of line items and the reduction is modest in size, we suspect that this omission has a negligible effect on our results.
The geographic regions reported in the IDR outcome data are March 2020 Core-Based Statistical Areas (CBSAs),13 which do not necessarily align with PFS payment localities. Where a CBSA has counties in multiple different PFS payment localities, we compute a population-weighted average of the locality-specific rates based on the portion of the CBSA’s population that resides in each locality. To calculate those population shares, we use the Census Bureau’s Vintage 2020 county population estimates. Approximately 11% of line items that report a CPT/HCPCS codes of interest and also a valid IDR decision amount do not report a valid CBSA (sometimes, presumably, because the service was not delivered in a CBSA and sometimes because the CBSA was not reported). In these cases, we impute the applicable Medicare rate as the average Medicare rate across line items for the relevant code that do report a valid CBSA.
Supplemental Figures
Authors


Related Content


-
Acknowledgements and disclosures
The authors thank Richard Frank for helpful comments on a draft of this analysis, Paris Rich Bingham for excellent research assistance, and Caitlin Rowley for excellent editorial assistance. All errors are our own.
The Brookings Institution is financed through the support of a diverse array of foundations, corporations, governments, individuals, as well as an endowment. A list of donors can be found in our annual reports published online here. The findings, interpretations, and conclusions in this report are solely those of its author(s) and are not influenced by any donation.
-
Footnotes
- To calculate this estimate, we exclude 9% of disputes where the fee is listed as zero, which are likely cases where the fee was not successfully collected, as well as a very small number of disputes where the fee was not reported.
- We ascertain whether a particular code is subject to special bilateral billing rules using the “bilateral surgery” flag on the 2023Q1 Physician Fee Schedule Relative Value File.
- When aggregating across line items, we weight each line item by its Medicare rate.
- For the two studies that report summary Medicare ratios that average across multiple relevant billing codes, we use that estimate. The other two studies only report estimates for specific CPT/HCPCS codes. For these studies, we extract the simple mean of the Medicare ratios reported for the relevant billing codes.
- Appendix Figure A1 indicates that mean QPAs are somewhat higher than median QPAs, so the differential between mean QPAs and historical mean in-network rates would be somewhat smaller but still larger than the differential between median and mean in-network rates observed in prior analyses.
- CBO reports that it estimated that mean in-network prices in the law’s absence would exceed the QPA by 15-20%. This implies that the QPA would be 13-17% lower than mean counterfactual in-network prices.
- We attribute a line item to one of these firms based on the provider email domain reported for the line item: for TeamHealth, teamhealth.com; for SCP Health, scp-health.com or agshealth.com; for Envision Healthcare, envisionhealth.com; and for Radiology Partners, saparm.com, radalliancerm.com, sonoranrm.com, accessradrm.com, empireradrm.com, iairm.com, smirm.com, mbbrm.com, or redrockrad.com. We treat agshealth.com as an SCP Health domain because AGS Health provides revenue cycle management services to SCP Health and almost all practices that list an agshealth.com domain also frequently list an scp-health.com domain.
- Down-weighting the rates negotiated by larger practices may have been an explicit goal of some lawmakers.
- This follows in Farber’s classic model of final offer arbitration (if the parties are risk neutral, which is likely a reasonable approximation in this instance) since each party’s win rate must be 50% in equilibrium.
- An additional consideration is whether any changes in prices paid for physician services might change what hospitals need to pay physicians (in the form of stipends, medical director fees, or similar payments) to ensure adequate coverage. This could generate offsetting changes in the prices facilities negotiate for their services, which would tend to dampen any effects of changes in physician prices on premiums. This may be particularly likely for non-emergency facility services, where the NSA does not directly regulate out-of-network prices.
- Specifically, we assign professional status if the provider’s name contains one of the following strings: phys; professional; practice; partner; anesthesi; radiolog; plastic; neuro; specialist; crna; md; m.d.; or do. We also assign professional status if the provider’s email domain is one of the domains associated with TeamHealth, Envision Healthcare, SCP Health, or Radiology Partners listed in the main text or one of the following: radpmg.com; soundphysicians.com; vituity.com; brault.us; usacs.com; or r1rcm.com.
- Among the codes we examine, only the imaging codes allow the professional component to be billed separately.
- CMS’ documentation for the IDR file states that the listed geographic regions should include only Metropolitan Statistical Areas, but we observe both Metropolitan and Micropolitan Statistical Areas in the data. CMS does not report which CBSA vintage was used but examining the data suggests that it was the March 2020 vintage.
The Brookings Institution is committed to quality, independence, and impact.
We are supported by a diverse array of funders. In line with our values and policies, each Brookings publication represents the sole views of its author(s).