This analysis is part of USC-Brookings Schaeffer Initiative on Health Policy, which is a partnership between the Center for Health Policy at Brookings and the University of Southern California Schaeffer Center for Health Policy & Economics. The Initiative aims to inform the national health care debate with rigorous, evidence-based analysis leading to practical recommendations using the collaborative strengths of USC and Brookings.
On Monday, the Congressional Budget Office (CBO) published a comprehensive analysis of the Better Care Reconciliation Act (BCRA), Senate Republicans’ Affordable Care Act repeal legislation. While many reactions to the CBO analysis focused on how the BCRA would affect insurance coverage, the bill’s effects on individual market insurance premiums have also received considerable attention.
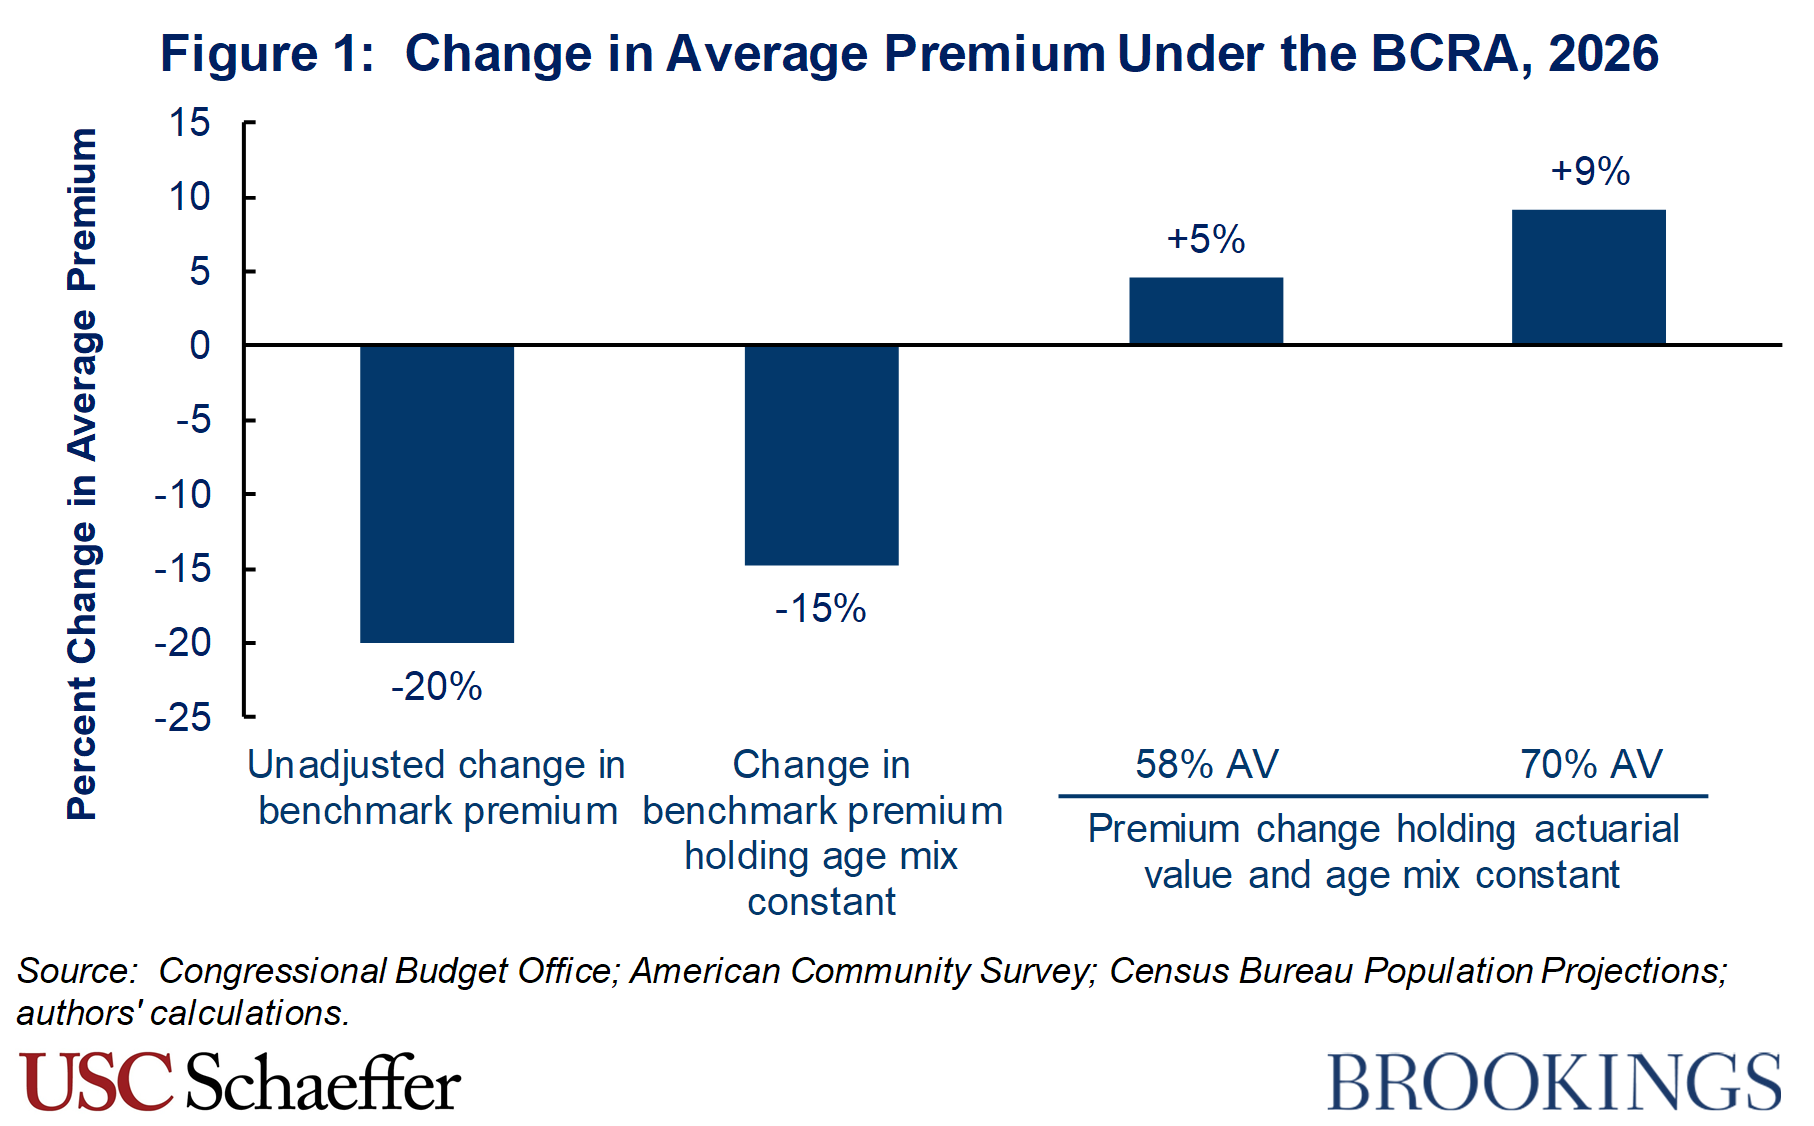
In its report, CBO estimated that the average premium for the “benchmark” individual market plan—the plan used to determine the amount of premium tax credits—would be 20 percent lower under the BCRA than under current law by 2026. This estimate may be of interest if one’s objective is to estimate how the federal government’s cost of providing premium tax credits would change under the BCRA. However, this estimate does not answer the question of greatest interest to enrollees, which is how the BCRA will affect average premiums for a given generosity of coverage and a fixed population of individual market enrollees.
This is the case for two reasons. First, the BCRA substantially reduces the generosity of the benchmark plan, both by directly reducing its actuarial value (AV)—the share of the total cost of covered services that are paid for by the insurance plan, rather than by the individual through cost sharing—and by making it easier for states to narrow the definition of “essential health benefits,” which would narrow the set of services the benchmark plan covers in many states. Second, the BCRA would drive a significant shift in individual market enrollment toward younger individuals. Since younger individuals pay lower premiums, this shift mechanically lowers the average premium.
Other estimates in the CBO report can be used to construct a more informative comparison.[1] When we do so, we find that, on average, the current population of individual market enrollees would pay more for the same level of coverage under the BCRA than under current law. We estimate that average premiums for a plan with a 58 percent AV would be 5 percent higher under the BCRA than under current law, holding the individual market age distribution fixed at what it would be under current law. (Plans with 58 percent AV are roughly equivalent to current bronze plans and would serve as the benchmark plan under the BCRA.) Premiums for a plan with a 70 percent AV would be 9 percent higher under the BCRA than under current law, also holding the age distribution fixed. (Plans with 70 percent AV are also known as “silver” plans and serve as the benchmark plan under current law; they are also the type of plan most commonly purchased by individual market enrollees.) As illustrated in Figure 1, the main reason these estimates differ from the 20 percent estimate featured by CBO is that they hold AV constant.
Importantly, these estimates actually understate the increase in individual market premiums under the BCRA for a plan with a fixed generosity. As noted above, the BCRA would make it easier for states to narrow the definition of essential health benefits, causing individual market plans in many states to cover a smaller set of services, a shift that reduces CBO’s estimates of premiums under the BCRA. However, because of this change, people in these states who wanted to access the same set of services as under current law would either need to purchase supplemental coverage for the affected services or pay for those services out-of-pocket. Unfortunately, CBO does not provide the information needed to incorporate these additional costs into our estimated premium increases.
It is also important to note that our estimates reflect premiums before accounting for subsidies available to people purchasing individual market coverage. The premium subsidies available under the BCRA would be significantly smaller than the subsidies available under current law on average. As a result, average post-subsidy premiums would increase by considerably more than average pre-subsidy premiums.
The remainder of this analysis presents these results in greater detail and briefly discusses the reasons why the BCRA increases individual market premiums when measured on an apples-to-apples basis.
Pitfalls in Interpreting the Benchmark Premium Change in the CBO Report
As noted above, CBO estimates that the average premium for the “benchmark” plan, the plan used to determine the value of the premium tax credit, would be 20 percent lower in 2026 under the BCRA than under current law.[2] For three reasons, however, this estimate must be interpreted with care.
First, CBO predicts that the BCRA will increase the share of individual market enrollment accounted for by younger people, mainly by relaxing limits on how much premiums can vary by age and changing the structure of the individual market subsidies in ways that favor younger enrollees. Because younger people pay lower premiums than older people, this type of compositional shift can cause the average premium for the population that is actually enrolled to fall even if the average premium for a fixed population of enrollees is rising.
Second, the BCRA would reduce the actuarial value of the benchmark plan. Under current law, the benchmark plan is the second-lowest cost silver plan in an individual’s area; silver plans have a 70 percent AV. Under the BCRA, starting in 2020, the benchmark plan would instead be the median plan with a 58 percent AV. The reduction in AV would indeed reduce the benchmark plan’s premiums. But this would occur because the benchmark plan would require enrollees to pay commensurately more out-of-pocket, not because the cost of a given level of coverage had fallen.
Third, the BCRA would reduce the breadth of the services the benchmark plan covers in many states. The BCRA would make it much easier for states to use the Affordable Care Act’s State Innovation Waiver process to modify the set of “essential health benefits” that individual and small group market plans are required to cover, and CBO expects that about half of people would live in states that implemented such a waiver. In response, most individual market insurance plans in these states would likely drop coverage for the services no longer considered “essential” since this would allow them to avoid enrollees with a high demand for those services. This reduction in the breadth of coverage would reduce premiums for the benchmark plan. Similar to the reduction in AV discussed above, however, it would do so only because enrollees would now have to pay for those services separately, not because the cost of a given amount of coverage had fallen.
Because of these factors, CBO’s estimate that the benchmark premium would fall by 20 percent under the BCRA does not reflect how the BCRA would change premiums for a given generosity of coverage and for a fixed population of individual market enrollees. It is therefore of limited use for making apples-to-apples comparisons of how the BCRA affects the cost of health insurance coverage.
Deriving Comparable Estimates of Premiums Under Current Law and the BCRA
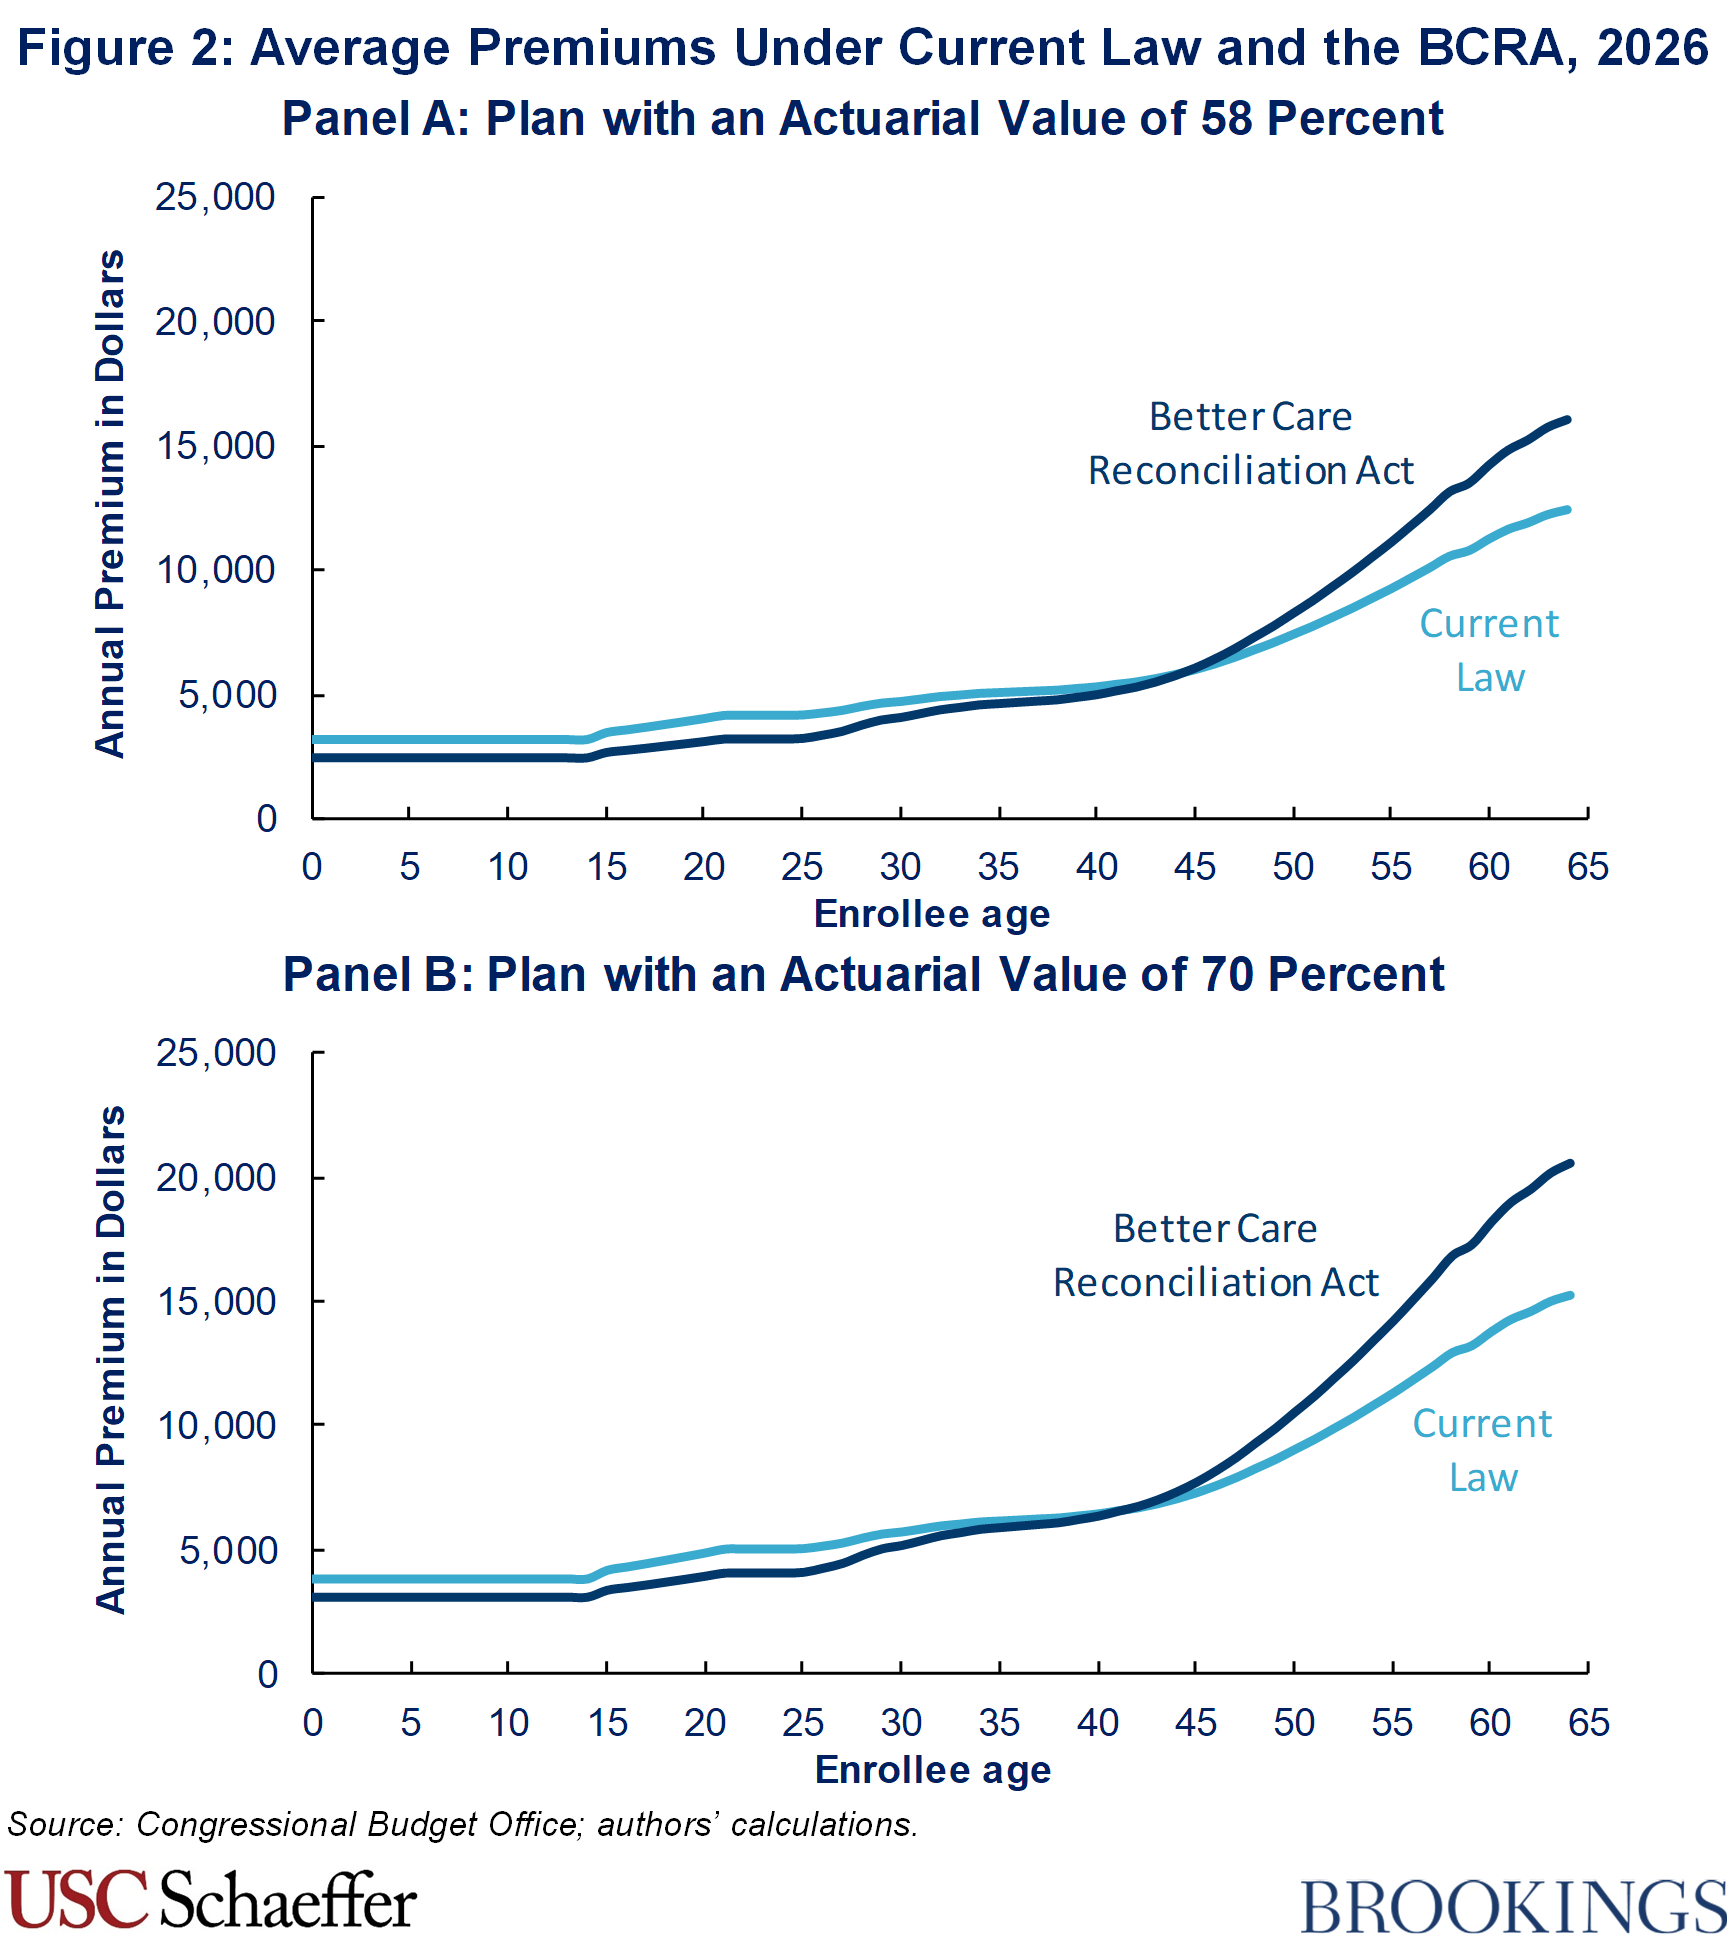
While CBO’s estimate of how the benchmark premium would change under the BCRA does not answer the question of greatest interest, other information in CBO’s analysis can be used to construct a more informative comparison. In particular, Table 5 of the CBO analysis reports average premiums under current law in 2026 for three ages (age 21, age 40, and age 64) and two AVs (60 percent and 70 percent). The CBO table also reports premiums under the BCRA for plans with two AVs (58 percent and 70 percent) and the same three ages in the same year.
We use the estimates from Table 5 to determine CBO’s forecast of average premiums for plans with these AVs to be at all ages under both current law and the BCRA. We then use CBO’s estimates of premiums for a 60 percent AV plan under current law to estimate premiums for a 58 percent AV plan under current law, which facilitates making an apples-to-apples comparison with premiums for a 58 percent AV plan under the BCRA. The appendix describes the details of these calculations (and subsequent calculations).
Figure 2 displays the resulting premiums. As the figure shows, holding actuarial value fixed, premiums rise for older people, but fall for younger people. Notably, the dollar increases in premiums for older individuals are much larger than the dollar decreases in premiums for younger individuals. For example, for 70 percent AV plans, BCRA premiums are more than $3,000 per year higher for all individuals over age 55, while the largest premium declines, which affect individuals ages 21 through 24, amount to only around $1,000 per year. The qualitative pattern is similar for plans with a 58 percent AV. The reason for this pattern of premium changes by age is the Senate bill’s provision increasing the amount by which premiums are permitted to differ between younger and older enrollees.
Ideally, in addition to comparing plans with the same AV, we would also adjust premiums under the BCRA to reflect the fact that CBO expects many states to use the expanded waiver authority provided under the BCRA to modify the definition of essential health benefits in ways that would cause many individual market plans to cover a smaller set of services. For example, we could in principle add enrollees’ out-of-pocket costs for the now-excluded services to our BCRA premium estimates. Alternatively, we could factor in the cost of purchasing a “rider” that provided coverage for the now-excluded services; that approach would tend to lead to even higher estimates since riders would likely be very expensive (if they were available at any price), reflecting the fact that the people purchasing them would tend to be those with a strong demand for those particular services. Unfortunately, we are unable to implement either approach because CBO does not provide quantitative information on the scope of the changes to essential health benefits that it expects states to make under the BCRA.
The final step in our analysis is to use the age-specific premiums reported in Figure 2 to estimate average premiums for the population of individual market enrollees projected to enroll under current law. Doing so requires knowing CBO’s projection of the individual market age distribution under current law, but CBO does not publish these projections. As a proxy, we use estimates of individual market enrollment by single year of age from the American Community Survey (ACS) for 2015, projected forward to 2026 using population projections from the Census Bureau. While only an approximation of CBO’s actual estimates, having CBO’s actual age distribution would be very unlikely to change the qualitative results of this analysis. Indeed, as we discuss in the appendix, alternative approaches would, if anything, strengthen our main findings.
Table 1 reports the resulting weighted average premiums under current law and the BCRA. The most important columns are columns 3 and 4, which show how premiums change for a plan of a given actuarial value, holding the individual market age distribution fixed at what it would be under current law. As shown in the table, average premiums for a 58 percent AV plan would rise by about $280 per year (5 percent). Average premiums for a 70 percent AV plan would rise by $692 per year (9 percent).

The finding that average premiums actually rise under the BCRA, holding actuarial value and the enrolled population fixed, contrasts with the unadjusted decline in the benchmark premium featured in the CBO report (and reproduced in column 1 of the table). Part of the reason for this difference is that the unadjusted change reported by CBO incorporates changes in the age distribution of individual market enrollment; as shown in column 2, holding the age distribution fixed modestly attenuates the premium decline. The larger factor, however, is the decline in the actuarial value of the benchmark plan under the BCRA, as illustrated by the large difference in results between column 2, which compares benchmark plans, and columns 3 and 4, which hold actuarial value constant. The role of changes in plan generosity in driving the decline in the benchmark premium would be even larger if we were able to account for the reductions in the breadth of services covered by the benchmark plan in the CBO estimates.
Why Do Premiums Rise Under the BCRA?
The results presented above demonstrate that CBO projects that the BCRA would increase premiums for individual market coverage, on average, when measured on an apples-to-apples basis. This conclusion should not be surprising in light of the policy changes included in the BCRA.
Most importantly, the BCRA would repeal the individual mandate, which CBO has previously predicted would reduce enrollment among healthier individuals, thereby necessitating premium increases of around 20 percent.[3] The reductions in individual market subsides under the BCRA likely drive further enrollment declines that further exacerbate adverse selection in the individual market and necessitate further premium increases.
CBO expects the premium increases from these provisions to be partially offset by funding made available through the State Stability and Innovation Program created by the BCRA.[4] CBO predicts that the bulk of these funds would be devoted to reducing individual market premiums, likely primarily by financing reinsurance programs that compensate insurers for a portion of the claims costs of high-cost enrollees. The funding available for this program dwindles over time, however, and CBO’s estimates imply that this program would reduce premiums by only around 4 percent in 2026, so it is unsurprising that premiums nevertheless rise significantly on net.[5] (The BCRA provides no funding for this program after 2026, so this offsetting effect on premiums would disappear entirely in subsequent years.)
If anything, the reduction in individual market premiums in our estimates is somewhat smaller than one would expect taking into account the BCRA’s provisions related to the individual mandate and subsidies, and the relatively small amount of funding available for reinsurance in 2026. This discrepancy likely reflects the fact, noted above, that we are unable to account for the reduction in the breadth of services covered by individual market plans under the BCRA in constructing our estimates and therefore understate the actual premium increases for comparable insurance coverage under the BCRA.
Methodological Appendix
This appendix provides additional methodological detail on the calculations in the main text.
Deriving premiums for all ages: We use the premiums reported for the three specific ages given in Table 5 of the CBO report to impute premiums at all ages. For current law, these calculations are straightforward because the “age curve” that determines how premiums vary with age is specified in regulation.[6] For the BCRA, however, we must infer how CBO expects the age curve to change in response to the BCRA’s provision that would allow states to increase the degree to which premiums vary by age (which CBO predicts that most states would implement). We assume that CBO used the same approach used by two research groups who previously analyzed the effects of this BCRA provision. Those groups assumed that the age factors for individuals ages 21 or older would be set equal to twice the age factors under current law minus 1; age factors for individuals under age 21 would be left unchanged.[7] This approach exactly reproduces the ratio between the premiums for the three ages reported by CBO (apart from very small differences that can be explained by rounding errors), giving us confidence that CBO did indeed use this approach in constructing the age curve that would apply under the BCRA.
Adjusting premiums for differences in AV: As described in the main text, we adjust the premiums that CBO reports for a plan with a 60 percent AV under current law to reflect an AV of 58 percent. We do so as follows. First, we assume that 80 percent of individual market premiums reflect claims costs that would be affected by changes in actuarial value. Second, we adjust for changes in utilization associated with changes in cost sharing using a price elasticity of -0.2, a conventional value. These parameters imply that the premium for a plan with a 58 percent AV would be 3.4 percent (=0.8*[1 – {0.58/0.60}*{1 + -0.2*ln(0.42/0.40)}]) lower than the premium for a plan with a 60 percent AV.
Estimating the individual market age distribution under current law: We base our estimates of the individual market age distribution under current law on tabulations of the 2015 ACS by single year of age. We count individuals as having individual market coverage if they report having directly purchased coverage and do not report coverage through an employer, Medicare, Medicaid, TRICARE, or the VA. We exclude individuals age 65 or older because these individuals are unlikely to have individual market major medical coverage. To project this enrollment distribution forward to 2026 under current law, we assume that enrollment in each age bin grows in accordance with the Census Bureau’s most recent projection of overall population growth in that age bin.
We investigated alternative sources of data on the on the individual market age distribution. Estimates from the Current Population Survey generated nearly identical results. Estimates using the National Health Interview Survey (NHIS) and Marketplace administrative data both suggest modestly larger adjusted premium increases. While we believe there are reasons to prefer the NHIS-based estimates, we have elected to use the ACS estimates in the interest of being conservative.
[1] We undertook a similar exercise after CBO analyzed the initial version of the AHCA.
[2] CBO projected that the reduction would in be larger in some years of the ten-year budget window and smaller (or non-existent) in others. We focus on 2026 for the purposes of this analysis because it reflects the effects of the legislation when fully in effect and because that is the year for which CBO provides detailed information on premiums by plan type and age.
[3] It is unclear whether CBO’s estimate of the effect of repealing the individual mandate adjusts for changes in individual market age mix or plan generosity. It is possible that a portion of CBO’s estimate of the effect of repealing the individual mandate reflects these factors.
[4] As noted earlier in this analysis, we focus on changes in premiums before considering changes in subsidies paid directly to individuals. However, the reinsurance programs supported by the State Stability and Innovation Program are also, in effect, subsidies to individual market enrollment. A true “pre-subsidy” premium increase under the BCRA should exclude this effect, which would make the premium increase under the BCRA even larger.
[5] CBO’s estimate of the BCRA, together with its March 2016 baseline projections, imply that 18 million people will be enrolled in the individual market in 2026 under the BCRA. Under the conservative assumption that the average premium in the individual market will be the average benchmark premium reported in Table 1, individual market premium revenue will total $109 billion in 2026. The BCRA appropriates $4 billion for these purposes in 2026, of which CBO expects three-quarters will be devoted to reducing individual market premiums. Accounting for the requirement for states to provide matching funds equal to 35 percent of total program costs, this implies a total outlay for these purposes of $4.6 billion for the 2026 plan year. This would generate a 4.2 percent reduction in premiums if those amounts are fully passed through to consumers in the form of lower premiums.
[6] Because this analysis concerns 2026, we use the age curve that the Centers for Medicare and Medicaid Services (CMS) finalized for plan years 2018 and later. This age curve differs from the age curve in effect for the 2017 plan year for individuals under the age of 21.
[7] We are uncertain whether CBO exactly matched the approach used by other researchers or whether it modified the age factors that apply to children. If the age rating approach under the BCRA were implemented in practice, those factors would likely need to be modified in order to avoid setting premiums too low for children’s coverage. Since it would likely be within HHS’ authority to make such an adjustment, it is possible that CBO assumed that such an adjustment would occur in making its projections. If CBO did make such an adjustment, then the AV- and age-adjusted premium increase under the BCRA policy regimes would be larger than we report here.
Related Content

Related Books


Authors


The Brookings Institution is committed to quality, independence, and impact.
We are supported by a diverse array of funders. In line with our values and policies, each Brookings publication represents the sole views of its author(s).


Commentary
How would the Senate’s health care bill affect individual market premiums?
Thursday, June 29, 2017