Recent fatalities involving self-driving vehicles appear to be making people nervous about self-driving vehicles. When asked in a survey undertaken by researchers at the Brookings Institution how likely they are to ride in a self-driving car, only 21 percent of adult internet users said they are inclined to do so, compared to 61 percent who are not.
The support for self-driving cars is down a bit from other surveys over the past year. For example, Northeastern University/Gallup undertook a mail survey of 3,297 U.S. adults from September 15 to October 10, 2017 and found 25 percent were likely to ride in a self-driving car and 54 percent were unlikely. In January 2018, Reuters/Ipsos completed a survey of 2,592 adults, finding 27 percent were comfortable riding in a self-driving car and two-thirds were uncomfortable.
In addition, our numbers are significantly less positive than what a May 2017 Pew Research Center poll revealed. It showed stronger enthusiasm for driverless cars, with 44 percent saying they would ride in one if given a chance, while 56 percent would not (but their analysis eliminated the “don’t know” or “no answer” response).
The Brookings survey was an online U.S. national poll undertaken with 2,066 adult internet users from July 8 to 10, 2018. It was overseen by Darrell M. West, vice president of Governance Studies and director of the Center for Technology Innovation at the Brookings Institution and the author of The Future of Work: Robots, AI, and Automation. Responses were weighted using gender, age, and region to match the demographics of the national internet population as estimated by the U.S. Census Bureau’s Current Population Survey.
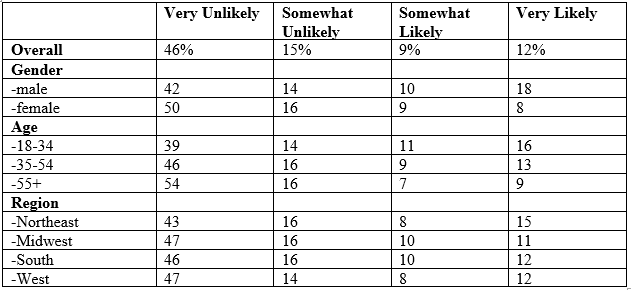
Would ride in self-driving car
The survey asked how likely a person was to ride in a self-driving car. Forty-six percent are very unlikely, 15 percent are somewhat unlikely, nine percent are somewhat likely, 12 percent are very likely, and 18 percent don’t know or gave no answer.
There are significant differences by gender and age. For example, men (28 percent) are more likely than women (17 percent) to say they would ride in a self-driving car. Young people aged 18 to 34 (27 percent) are most likely to ride in a self-driving car, compared to those 55 or over (16 percent).
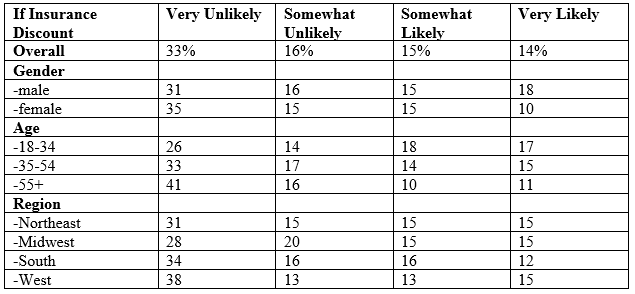
If an insurance company offered a 10 percent insurance rate discount to ride in a self-driving car due to its increased safety, 29 percent say they are likely to do so, 49 percent are not, and 22 percent do not know or give no answer. This eight percentage point increase over the 21 percent number with no discount suggests ridership can be increased through insurance incentives.
There are differences by gender and age. Men (33 percent) are more likely than women (25 percent) to say they would ride in a self-driving car if given an insurance discount. Young people aged 18 to 34 (35 percent) are the most likely to do so compared to those aged 55 and over (21 percent).
A drop in favorability
We asked how favorable people were to self-driving cars, and 20 percent say they are favorable, while 59 percent are unfavorable.
But these levels were less favorable than what a Morning Consult survey found between March 29 and April 1, 2018. In that poll, researchers discovered 32 percent were favorable to self-driving cars and 57 percent were unfavorable.
Benefits to senior citizens and the visually-impaired
Higher percentages of individuals see benefits of self-driving cars for senior citizens and the visually impaired. When asked how helpful these vehicles would be for these groups, 42 percent thought they would be helpful to senior citizens and 40 percent said they would be helpful to the visually impaired. These groups are likely beneficiaries of self-driving cars because these vehicles will provide enhanced mobility for people who have few options now with human-operated transportation.

Views about safety
We wanted to see how the provision of positive factual information about U.S. highway safety would affect people’s views. For example, around 40,000 Americans die in highway accidents each year, and it is estimated that 90 percent of highway fatalities involve human error, distraction, or intoxication.
After telling people about the number of Americans dying in highway accidents each year, we asked if they thought self-driving cars will reduce the number of accidents. Twenty-three percent said yes, while 55 percent indicated no.
We also told them that 90 percent of accidents involve human error, but the response was similar. Twenty-seven percent said they thought self-driving cars would be helpful in reducing accidents, while 51 percent did not.
The lowness of the positive numbers demonstrates that even the provision of favorable information regarding the safety benefits of self-driving cars over those of human-operated ones does not move many people in a more positive direction.
Role of government
Fifty-four percent believe the government very much should regulate self-driving cars, 26 percent think it should somewhat regulate these vehicles, 9 percent feel the government should not regulate very much, and 11 percent say they don’t know or give no answer.
Forty-seven percent believe the national government should not be supportive in allowing self-driving cars on highways, 27 percent believe it should be supportive, and 26 percent do not know or give no answer.
Thirty percent feel states and localities should allow tests rides of self-driving cars on highways in order to perfect the technology, 45 percent do not, and 25 percent are uncertain.
Survey Questions and Answers
1. How favorable are you to self-driving cars?
- 43% very unfavorable
- 16% somewhat unfavorable
- 8% somewhat favorable
- 12% very favorable
- 21% don’t know or no answer
2. If you had the chance, how likely are you to ride in a self-driving car?
- 46% very unlikely
- 15% somewhat unlikely
- 9% somewhat likely
- 12% very likely
- 18% don’t know or no answer
3. Right now, around 40,000 Americans die in highway accidents each year. Do you think self-driving cars will reduce the number of highway accidents?
- 37% definitely no
- 18% possibly no
- 10% possibly yes
- 13% definitely yes
- 22% don’t know no answer
4. It is estimated that 90 percent of highway accidents involve human error. Given that situation, do you think self-driving cars will reduce the number of highway accidents?
- 33% definitely no
- 18% possibly no
- 13% possibly yes
- 14% definitely yes
- 22% don’t know or no answer
5. How helpful do you think self-driving cars will be to visually impaired people who are not able to drive themselves?
- 22% very unhelpful
- 13% somewhat unhelpful
- 18% somewhat helpful
- 22% very helpful
- 25% don’t know or no answer
6. How helpful do you think self-driving cars will be to senior citizens who are not able to drive themselves?
- 23% very unhelpful
- 14% somewhat unhelpful
- 20% somewhat helpful
- 22% very helpful
- 21% don’t know or no answer
7. If an insurance company offered you a 10 percent insurance rate discount to ride in a self-driving car due to its increased safety, how likely would you be to ride in it?
- 33% very unlikely
- 16% somewhat unlikely
- 15% somewhat likely
- 14% very likely
- 22% don’t know or no answer
8. Do you think states and localities should allow test rides of self-driving cars on their highways in order to perfect the technology?
- 30% definitely no
- 15% possibly no
- 14% possibly yes
- 16% definitely no
- 25% don’t know or no answer
9. How supportive do you want the national government to be in allowing self-driving cars on highways?
- 30% very unsupportive
- 17% somewhat unsupportive
- 13% somewhat supportive
- 14% very supportive
- 26% don’t know or no answer
10. How much should the government regulate self-driving cars?
- 54% very much
- 26% somewhat
- 9% not very much
- 11% don’t know or no answer
Gender:
- 52.2% male, 47.8% female in sample
- 47.9% male, 52.1% female in target population
Age:
- 10.4% 18-24, 15.1% 25-34, 17.2% 35-44, 17.6% 45-54, 22.6% 55-64, 16.9% 65+ in sample
- 13.9% 18-24, 19.4% 25-34, 17.8% 35-44, 18.3% 45-54, 16.4% 55-64, 14.2% 65+ in target population
Region:
- 15.2% Northeast, 28.5% Midwest, 34.6% South, 21.6% West in sample
- 18.0% Northeast, 22.0% Midwest, 36.4% South, 23.6% West in target population
Survey Methodology
This online survey polled 2,066 adult internet users in the United States from July 8 to 10, 2018 through the Google Surveys platform. Responses were weighted using gender, age, and region to match the demographics of the national internet population as estimated by the U.S. Census Bureau’s Current Population Survey.
In the 2012 presidential election, Google Surveys was the second most accurate poll of national surveys as judged by polling expert Nate Silver. In addition, the Pew Research Center undertook a detailed assessment of Google Surveys and found them generally to be representative of the demographic profile of national internet users. In comparing Google Survey results to its own telephone polls on 43 different substantive issues, Pew researchers found a median difference of about three percentage points between Google online surveys and Pew telephone polls. A 2016 analysis of Google Surveys published in the peer-reviewed methodology journal Political Analysis by political scientists at Rice University replicated a number of research results and concluded that “GCS [Google Consumer Surveys] is likely to be a useful platform for survey experimentalists.”
This research was made possible by Google Surveys, which donated use of its online survey platform. The questions and findings are solely those of the researchers and not influenced by any donation. For more detailed information on the methodology, see the Google Surveys Whitepaper.
Related Books


Related Content


Author

The Brookings Institution is committed to quality, independence, and impact.
We are supported by a diverse array of funders. In line with our values and policies, each Brookings publication represents the sole views of its author(s).


Commentary
Brookings survey finds only 21 percent willing to ride in a self-driving car
July 23, 2018