Fifty-seven percent of respondents are positive about their online shopping experiences, according to a survey undertaken by researchers at the Brookings Institution. But when asked which provides a better shopping experience, 40 percent cite actual stores, 26 percent say online websites, and 34 percent are unsure.
The survey was an online U.S. national poll undertaken with 2,102 adult internet users between November 12 and 14, 2018. It was overseen by Darrell M. West, vice president of Governance Studies, director of the Center for Technology Innovation at the Brookings Institution, and the author of The Future of Work: Robots, AI, and Automation. Responses were weighted using gender, age, and region to match the demographics of the national internet population as estimated by the U.S. Census Bureau’s Current Population Survey.
Online Shopping
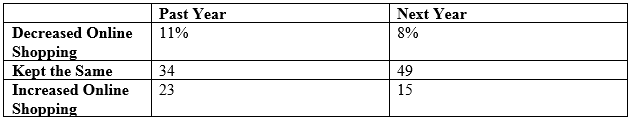
Twenty-three percent say they increased their online shopping over the past year and 15 percent indicate they plan to increase their online shopping in the next year.
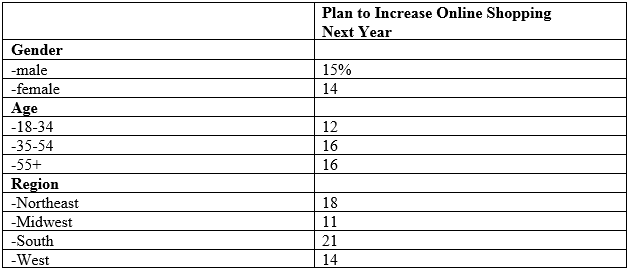
There are differences by age and region. Those 35 and older (16 percent) are more likely than those 18 to 34 (12 percent) to say they will increase their online shopping next year. People in the South (21 percent) and Northeast (18 percent) were more likely than in the Midwest (11 percent) to say they plan to do so. There were no gender differences in planned online shopping behavior.
Online shopping recommendations
Some e-commerce sites give personal recommendations of things to buy. When asked if they find these shopping recommendations helpful, 36 percent said they were unhelpful, 24 percent found them helpful and 40 percent were unsure.
Importance of home delivery
Forty-six percent say home delivery is very important to their shopping decisions, 27 percent believe it is somewhat important, 10 percent claim it is not very important, and 17 percent are unsure.
Mixed views about drone delivery
People have mixed views about having online goods delivered to their homes via unmanned autonomous drones. When asked about this, 48 percent are negative, 23 percent are positive, and 29 percent are unsure.
Traffic congestion by delivery trucks
Many do not believe that delivery trucks increase traffic congestion in their community. Forty-six percent say these trucks have not increased congestion, 30 percent say the vehicles have increased congestion somewhat, 9 percent say they have done so a lot, and 15 percent are unsure.
Handling of consumer data
The survey asked how people feel about the way online shopping websites handle consumer data. Forty-three percent are negative, 16 percent are positive, and 41 percent are unsure.
Online information being hacked
Twenty-six percent say they or an immediate family member have had their online shopping or credit card information hacked or stolen in the past year, 52 percent have not, and 22 percent are unsure.
Survey Questions and Answers
1. In the past year, have you decreased, kept the same, or increased your online shopping?
- 11% decreased
- 34% kept the same
- 23% increased
- 32% don’t know or no answer
2. In the next year, do you plan to decrease, keep the same, or increase your online shopping?
- 8% decrease
- 49% keep the same
- 15% increase
- 28% don’t know or no answer
3. Overall, how would you rate your recent online shopping experiences?
- 8% very negative
- 5% somewhat negative
- 34% somewhat positive
- 23% very positive
- 30% don’t know or no answer
4. In general, which do you think provides a better shopping experience?
- 40% actual stores
- 26% online websites
- 34% don’t know or no answer
5. Some e-commerce sites give you personal recommendations of things to buy. How helpful do you find these shopping recommendations?
- 17% very unhelpful
- 19% somewhat unhelpful
- 16% somewhat helpful
- 8% very helpful
- 40% don’t know or no answer
6. How important is home delivery to your shopping decisions?
- 10% not very important
- 27% somewhat important
- 46% very important
- 17% don’t know or no answer
7. How would you feel about having online goods delivered to your home via an unmanned autonomous drone?
- 31% very negative
- 17% somewhat negative
- 13% somewhat positive
- 10% very positive
- 29% don’t know or no answer
8. How much do you think delivery trucks increase traffic congestion in your community?
- 46% not very much
- 30% somewhat
- 9% a lot
- 15% don’t know or no answer
9. How do you feel about the way your online shopping websites handle your consumer data?
- 19% very negative
- 24% somewhat negative
- 10% somewhat positive
- 6% very positive
- 41% don’t know or no answer
10. In the past year, have you or an immediate family member had your online shopping or credit card information hacked or stolen?
- 52% no
- 26% yes
- 22% don’t know or no answer
Gender:
- 54.3% male, 45.7% female in sample
- 47.9% male, 52.1% female in target population
Age:
- 7.2% 18-24, 14.0% 25-34, 17.8% 35-44, 22.5% 45-54, 21.3% 55-64, 17.2% 65+ in sample
- 13.9% 18-24, 19.4% 25-34, 17.8% 35-44, 18.3% 45-54, 16.4% 55-64, 14.2% 65+ in target population
Survey Methodology
This online survey polled 2,102 adult internet users in the United States November 12 to 14, 2018 through the Google Surveys platform. Responses were weighted using gender, age, and region to match the demographics of the national internet population as estimated by the U.S. Census Bureau’s Current Population Survey.
In the 2012 presidential election, Google Surveys was the second most accurate poll of national surveys as judged by polling expert Nate Silver. In addition, the Pew Research Center undertook a detailed assessment of Google Surveys and found them generally to be representative of the demographic profile of national internet users. In comparing Google Survey results to its own telephone polls on 43 different substantive issues, Pew researchers found a median difference of about three percentage points between Google online surveys and Pew telephone polls. A 2016 analysis of Google Surveys published in the peer-reviewed methodology journal Political Analysis by political scientists at Rice University replicated a number of research results and concluded “GCS [Google Consumer Surveys] is likely to be a useful platform for survey experimentalists.”
This research was made possible by Google Surveys, which donated use of its online survey platform. The questions and findings are solely those of the researchers and not influenced by any donation. For more detailed information on the methodology, see the Google Surveys Whitepaper.
Related Content


Author

The Brookings Institution is committed to quality, independence, and impact.
We are supported by a diverse array of funders. In line with our values and policies, each Brookings publication represents the sole views of its author(s).


Commentary
Brookings survey finds 57 percent are positive about their online shopping experiences
November 29, 2018