Editor’s Note: This post is part of a discussion on the net benefits of low and no-carbon electricity technologies. Discussants include Charles Frank, a nonresident senior fellow in Global Economy and Development at Brookings and Amory Lovins, cofounder and chief scientist of the Rocky Mountain Institute.
In my last two blogs, I dealt with assumptions about capacity factors, capital costs, nuclear costs, and avoided capacity costs. In this article I attempt to deal with Mr. Amory Lovins’ remaining criticisms.
Natural Gas Prices. Mr. Lovins asserts that my “natural-gas analysis omits price volatility.” In fact, my results are tested against a wide range of natural gas prices. The rankings do not change unless the gas price is three to four times higher than it is today in the U.S. In theory, Mr. Lovins is correct, some increase in the price of natural gas is appropriate to take account of volatility. In practical terms, however, this adjustment is minimal for the U.S. The value of a call option hedge, with a strike price of $10/mmbtu or more, is a very small percentage of the cost of natural gas.
Methane Leakage. Mr. Lovins correctly asserts that my paper does not deal with the problem of methane leakage from natural gas production, transmission, storage, and distribution. The Environmental Protection Agency (EPA) published a greenhouse gas inventory in 2014 that measured fugitive methane and CO2 emissions for natural gas systems and coal mining. Using the EPA data to take account of fugitive methane and CO2 emissions, the net benefits for wind, solar, hydro and nuclear improve a little, and for gas combined cycle deteriorate a little, but the effect is modest.
Some critics say the EPA inventory is too low, others say too high. However, the EPA data seem to be the best available. Furthermore, new EPA requirements for capture or flaring of methane leaked during well completion, which take full effect in 2015, and tighter regulation of the maintenance of equipment, could further reduce fugitive emissions.
Wind and Solar Balancing and Cycling Costs. The introduction of highly variable wind and solar output into an electricity system increases the costs of system balancing (i.e. the use of spinning reserves to control voltage fluctuations) and cycling (i.e. the costs of start-ups, shutdowns and ramping of fossil fuel plants to compensate for fluctuations in wind and solar output). Based on a review of the literature there seems to be agreement among many, but not all, researchers that the additional balancing and cycling costs are modest, but difficult to calculate precisely, so I used a very low figure of $2.70 per MWH for the additional cycling and balancing costs of wind and solar. There is not really any significant disagreement between Mr. Lovins and myself on this point.
Expected Life of Wind Plants. Mr. Lovins maintains that I have further “disadvantaged wind by using a 20-year expected life, rather than the industry-standard 25, thus increasing its annual capital charge by one-fourth.” An increase from 20 to 25 years increases the capital charge by 9 percent, not one fourth – a consequence of the mathematics of compound interest. A typical wind turbine is designed for a 20-year life. Yes, the 20-year design life can be extended, or a new turbine can be designed for a 25-year life, but at a cost that needs to be taken into account.
Nuclear Construction Times. Mr. Lovins asserts I should have used a 9.4 year construction time for nuclear, the average for plants completed between 2008 and 2014 as reported by the World Nuclear Industry Status Report. I used a 5 year construction period as reported by the International Energy Agency based on an engineering assessment. The average of 9.4 years is inappropriate to use in a cost-benefit analysis. It is driven by financing difficulties and political interventions, causing completion times greater than 30 years in several countries.
Overall Results. Incorporating all of the changes that I have made, the results, assuming displacement of base-load coal plants, are as follows:
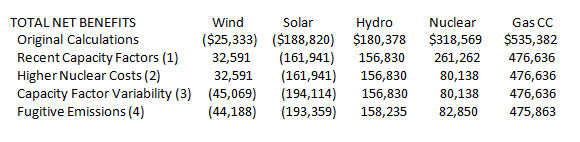
These results are cumulative. The last row includes the combined effect of (1) more recent Energy Information Administration (EIA) capacity factor data, (2) Nuclear Energy Institute rather than EIA nuclear data, (3) taking account of higher on-peak capacity factors for wind and solar and greater variability of wind and solar production by applying Japanese ratios to U.S. data, and (4) fugitive emissions based on EPA data. Taking all changes into account, my main conclusions are strengthened. Wind continues to rank number four and, by a large margin, solar number five. Gas combined cycle continues to rank number one by a large margin, although nuclear drops from two to three.
Conclusion. Mr. Lovins suggestions, and similar suggestions of others, helped improve the quality of my analysis. Still others have complained that my assumptions are too favorable to wind and solar – that my cycling and balancing costs are too low and that I did not take account of increases in carbon dioxide emissions caused by cycling, land costs for wind and solar, or transmission costs to support wind or solar projects away from demand centers.
When I started drafting the working paper, I did not anticipate the robustness of the results. I went where the data took me. I will further improve the data in whatever way I can, regardless of whether they strengthen or weaken my current conclusions. If future technological change makes wind or solar economically competitive, I hope to be among the first to recognize it.


Commentary
Alternative Energies Debate—All Things Considered on the Net Benefits of Low and No-Carbon Electricity Technologies
September 11, 2014