The following brief is part of Brookings Big Ideas for America–an institution-wide initiative in which Brookings scholars have identified the biggest issues facing the country and provide ideas for how to address them.

Economically speaking, are we better off than we were ten years ago? Twenty years ago? When asked such questions, Americans seem undecided, almost schizophrenic, with large majorities saying that the country is heading “in the wrong direction,” even as they tell pollsters that they are optimistic about their personal financial situations and the medium-term economic outlook.
In their thirst for evidence on this issue, commentators seized on the recent report by the U.S. Census Bureau, which found that real median household income rose by 5.2 percent in 2015, as an indicator that “the middle class has finally gotten a raise.” Unfortunately, that conclusion puts too much weight on a useful but flawed and incomplete statistic. Among the more significant problems with the Census’s measure are that (1) it excludes taxes, transfers, and nonmonetary compensation like employer-provided health insurance; and (2) it is based on surveys rather than more complete tax and administrative data, with the result that it has been surprisingly inconsistent with the official national income numbers in recent years. Even if income data are precisely measured, they exclude important determinants of economic well-being, such as the hours of work needed to earn that income.
On this question, a recently published article by Charles Jones and Peter Klenow proposes an interesting new measure of economic welfare. It is by no means perfect, yet it is considerably more comprehensive than median income, taking into account not only growth in per capita consumption but also changes in working time, life expectancy, and inequality. Moreover, as the authors demonstrate, it can be used to assess economic performance both across countries and over time. This chapter reports some of their results and extends part of their analysis (which ends before the Great Recession) through 2015.[1]
The bottom line: According to this metric, Americans enjoy a high level of economic welfare relative to most other countries, and the level of Americans’ well-being has continued to improve over the past few decades despite the severe disruptions of the financial crisis and its aftermath. However, the rate of improvement has slowed noticeably in recent years, consistent with the growing sense of dissatisfaction evident in polls and politics.
Cross-country welfare comparisons
The Jones-Klenow method can be illustrated by a cross-country example. (Comparisons over time will be discussed in greater detail below.) Suppose that a researcher wanted to compare the economic welfare of citizens of the United States and France in a particular year—following the paper, 2005 will be the sample year.
In 2005, as the authors observe, real GDP per capita in France was only 67 percent that of the United States, and real consumption per capita (a more direct measure of living standards) was only 60 percent as high, making it appear that Americans were economically much better off than the French on average. However, that comparison omits other relevant factors of economic well-being. Jones and Klenow choose to focus on three such factors: leisure time, life expectancy, and economic inequality. The French take long vacations and retire earlier, and so they typically work fewer hours; they enjoy a higher life expectancy at birth (80 years in 2005, compared to 77 in the United States), which presumably reflects advantages with respect to health care, diet, lifestyle, and the like; and their income and consumption are somewhat more equally distributed than is the norm in the United States. Because of these mitigating differences, comparing France’s per capita GDP or consumption with that of the United States overstates the gap in economic welfare.
Related Books


How much do these other factors matter? To quantify their effect in a single measure, the authors formalize the following question: If someone had to choose between switching places with a random person living in the United States—with its consumption, inequality, life expectancy, and leisure—or a random person living in France, how much would U.S. consumption have to change before he or she would be equally happy with either outcome?[2] To answer this question, Jones and Klenow use detailed data for each country to convert the factors into “consumption equivalents,” using a simple model of household preferences and some plausible assumptions about, for example, the relative value of leisure and consumption.[3] At the end of this exercise, they estimate that, in units of consumption equivalents, in 2005 a randomly chosen French citizen was actually about 92 percent as well off, on average, as a randomly picked U.S. citizen, despite the large gap between the two countries in consumption per capita.[4]
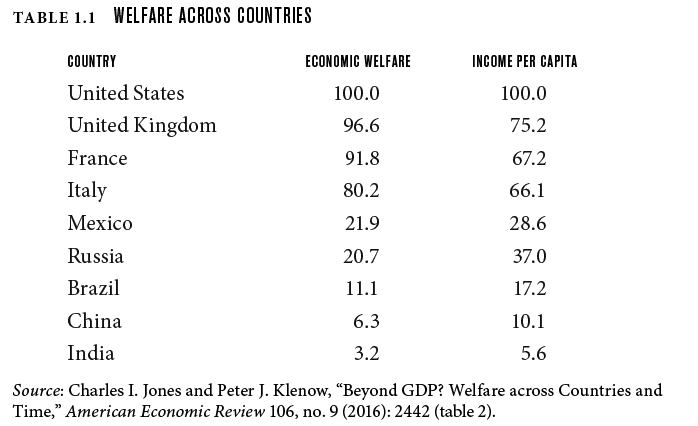
Similar calculations can be used to compare the United States and other countries. Table 1.1 shows the Jones-Klenow estimates of economic welfare, as well as income per capita, in a number of selected countries in the early to mid-2000s. (The exact years of comparison vary based on data availability.) U.S. values are set to 100, so the entries in table 1.1 should be interpreted as percentages of the U.S. level.
Table 1.1 confirms the conventional view that, broadly measured, American living standards are comparable to those of the richest Western European nations but much higher than the living standards in emerging market economies. For example, this calculation puts economic welfare in the United Kingdom at 97 percent of U.S. levels, but estimates Mexican well-being at 22 percent. Interestingly, this comparison shows that Western European countries such as the United Kingdom, France, and Italy are considerably closer to the United States in terms of economic welfare than differences in per capita income or consumption would suggest, reflecting the fact that Western European countries do relatively well on the other evaluated criteria (namely, leisure, life expectancy, and inequality). For emerging and developing economies, however, differences in income or consumption per person generally understate the advantage of the United States, according to this measure, largely due to the greater levels of inequality and lower life expectancies in those countries.
Improvements in economic well-being over time
The Jones-Klenow measure can also assess an economy’s performance over time. Since the Jones-Klenow published results cover only the period before the 2007–9 financial crisis and the Great Recession, publicly available data are needed to estimate U.S. results through 2015 based on the Jones-Klenow computer program available online.[5] Where the published and the estimated results overlap, they are comparable.[6] (Obviously, however, Jones and Klenow are not responsible for either the assumptions that the authors of the chapter made to determine their results or the accuracy of their calculations.)
Table 1.2 shows the results for the 1995–2015 period and for two subperiods. The first two columns report the annual growth rates of per capita GDP and of the data-based estimates of the Jones-Klenow measure of economic welfare. Also shown in the table below and displayed in figure 1.1 is the decomposition of the economic welfare growth estimates into four components: changes in life expectancy, consumption, leisure, and consumption inequality.[7]

Table 1.2 shows that economic welfare improved at quite a rapid pace over the two decades before the crisis (1995–2007), at more than 3 percent per year, notably faster than the growth rate of per capita GDP, at about 2 percent.[8] As shown by the four rightmost columns of table 1.2 and graphically in figure 1.1, the gains in welfare were driven primarily by increases in per capita consumption and by improvements in life expectancy, which rose by 2.3 years over the period, from 75.8 to 78.1 years. Rising consumption inequality subtracted between 0.1 and 0.2 percentage points from the annualized growth rate in welfare during the precrisis period, and changes in leisure/work hours per person (which were stable) made only a very small contribution.
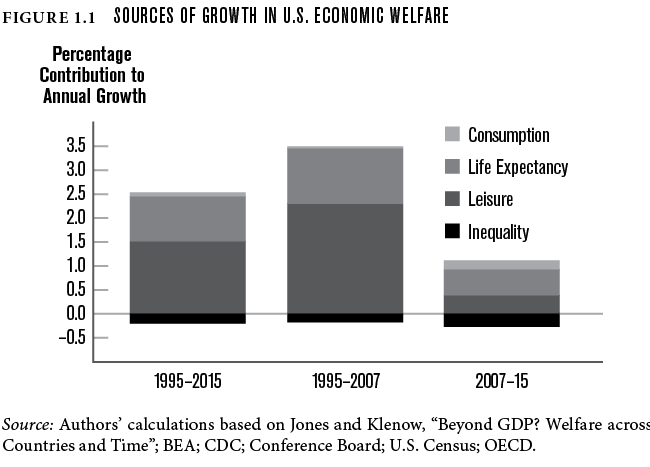
What about the more recent period (2007–15)? As can be seen in the table and the accompanying figure, economic well-being has continued to improve (growth in welfare is positive), but the pace of improvement has slowed considerably, to just about 0.9 percent per year. The biggest reason for the slowdown is the decline in the growth rate of per capita consumption to only about 0.4 percent per year since 2007—about the same as the growth rate of per capita GDP. In other words, disappointing economic growth, including the slow improvement in consumer spending power, is the dominant reason for the decline in the pace of welfare gains, even by this broader measure. Life expectancy has continued to improve since 2007, adding about a half percentage point to welfare growth; however, the contribution from this source is less than in the precrisis period, a difference that accounts for about 0.6 percentage points of the slowdown.[9] The longer-term trend toward inequality continued and intensified slightly after 2007, subtracting about a quarter percentage point from welfare growth.[10]
Conclusions
This analysis presents several conclusions:
- Broad economic indicators like GDP, disposable income, and median household income are important measures of economic welfare, but inherently are incomplete. Jones and Klenow have provided a concrete example of how to construct a more comprehensive measure of economic well-being from existing data.
- According to the Jones-Klenow measure, as of the early to mid-2000s, the United States had the highest economic welfare of any large country. However, several Western European countries, including the United Kingdom and France, came close to the United States when differences in leisure, life expectancy, and inequality are taken into account. In terms of welfare, emerging market and developing economies were further behind the United States than per capita income or consumption figures indicate, largely because of greater inequality and shorter life expectancies in those countries.
- Longer-term trends in economic welfare in the United States are mostly positive. According to our extension of the Jones-Klenow analysis, U.S. economic welfare has increased at about 2.3 percent per year since 1995, for a cumulative gain in two decades of 60 percent. Gains in income and consumption per capita and in life expectancy are the major reasons for improved welfare. Increased inequality of consumption has subtracted about 0.2 percentage points a year from the welfare measure since 1995.
- Since 2007, economic welfare in the United States has continued to improve, according to our calculation. However, the pace of improvement has slowed markedly relative to the precrisis era, reflecting slower economic growth, some slowdown in the rate of improvement in life expectancy, and continuing increases in inequality.
- This measure confirms that life in America is good, compared to other countries and to the country’s own past, and is still improving. But there has been a significant slowdown in the pace of improvement that requires attention from policymakers.
Methodologically, the lesson from Jones and Klenow’s research is that economic welfare is multidimensional. Their approach is flexible enough that in principle other important quality-of-life changes could be incorporated—for example, the 63 percent decrease in total emissions of six of the most common pollutants from 1980 to 2014 and the decline in crime rates. We need better measures of how well Americans are being served by the economy, and frameworks such as this one are a promising direction.
[1] Jones and Klenow build on earlier work. See for example Fleurbaey and Gaulier (2009).
[2] To state the obvious, this comparison is assumed to be made based only on the four factors considered. We’re ignoring (among many other things) cultural preferences, like a taste for fresh baguettes or a consuming interest in the National Football League.
[3] They report that the results are not much changed by moderately varying their assumptions. Note that they are making the usual economist’s assumption that leisure is a “good,” which may underweight some positive psychological and social benefits of work. Note also that high levels of inequality are a negative in this framework only because, holding constant the average level of consumption, a person in a very unequal country has a high chance of living in poverty; this risk is assumed not to be compensated for by the fact that, in an unequal country, there is also a higher probability of having a very high living standard. “External” effects of inequality—the possibility that people prefer to live in more-equal society, whatever their own personal living standard—are not included here.
[4] In other words, the Jones-Klenow calculation implies shifting from the United States to France is economically equivalent to losing 8 percent of average consumption.
[5] For recession periods, their method has the problem that it can’t differentiate “voluntary” leisure, such as vacations or earlier retirements, from cyclical unemployment. So, interpretation of their measure for a period of high cyclical unemployment, like 2008 or 2009, would be problematic. Our extension of their results below mitigates this problem by making comparisons between the pre-crisis period and 2015, a year in which cyclical unemployment was closer to normal levels.
[6] Jones and Klenow use detailed micro-level surveys for some analyses, but for comparing broader sets of countries they instead used more easily available macro data. (They refer to these as their “micro” and “macro” approaches.) Where there is an overlap, they find that the two sets of results correspond closely. For data availability reasons we use “macro” data for the United States in constructing Table 2. Differences with the Jones-Klenow results reflect data revisions, different sample periods, minor adjustments in assumptions, and in two cases, a switch to U.S.-specific data sources: We pull our consumption data from the National Income and Product Accounts instead of the Penn World Tables, and our life expectancy data from the Center for Disease Control instead of the World Bank.
[7] Since the CDC has not published life expectancy numbers for 2015, for our calculation we assume that it stayed at its 2014 level of 78.8 (which was also its level in 2012 and 2013). Regarding inequality, the OECD estimate of the Gini coefficient for U.S. disposable income that we use only goes through 2014, so we impute the 2015 number based on the 10-year average relationship between the OECD figure and the Gini coefficient for (pre-tax, pre-transfer) income produced by the Bureau of the Census. Following Jones and Klenow, we impute the consumption Gini coefficient for the US based on cross-country evidence on the relationship between Gini coefficients for disposable income and consumption.
[8] For the period 1980-2007, Jones and Klenow find that the growth rate of welfare was 3.11 percent per year (Table 9, p. 2455). Using more detailed micro data, they calculate a growth rate of 3.09 percent for 1984-2006 (Table 3, p. 2445).
[9] The Jones-Klenow calculation does not include inequality in life expectancy, which in principle could be incorporated. Chetty et al. (2016) showed that, between 2001 and 2014, life expectancy rose considerably more for people in the upper portion of the income distribution than in the lower portion; Case and Deaton have pointed out the relative increases in mortality among US white men with lower education. Another issue is how to treat the reduction in hours of work, which, as shown in Table 2, contributes about 0.2 percentage points to welfare growth since 2007. We might discount some of this as reflecting remaining cyclical influences or structural factors, particularly the absence of good job opportunities for less-educated, prime-age men. However, retirements and the aging workforce account for a substantial part of the decline in hours worked. Finally, note that our data on life expectancy go only through 2014 (footnote 5), so that any more recent improvement on that dimension has been missed.
[10] Using detailed micro data, Jones and Klenow report (Table 3, p. 2445) that increasing consumption inequality subtracted about 0.24 percentage points from welfare growth annually over the 1984-2006 period. In addition, increasing inequality in leisure subtracted another 0.08 percentage points.
Read more in the Brookings Big Ideas for America series »
Comments are now closed for this post.
Related Content


Authors


The Brookings Institution is committed to quality, independence, and impact.
We are supported by a diverse array of funders. In line with our values and policies, each Brookings publication represents the sole views of its author(s).


Commentary
Are Americans better off than they were a decade or two ago?
October 19, 2016
Traditional proxies of economic welfare, such as real median household income, provide an incomplete picture of economic well-being. This chapter describes an alternative, more comprehensive approach, developed by Charles Jones and Peter Klenow, that translates per capita consumption, leisure, life expectancy, and inequality into equivalent units of consumption, making it easy to compare economic well-being in the United States to that of the rest of the world. Jones and Klenow find with this method that many developed nations, such as those in Western Europe, have welfare levels much closer to that of the United States than traditional measures suggest, while developing or emerging nations fare more poorly relative to the traditional measures. Jones and Klenow also compare the United States to itself over time, an analysis that this chapter extends through 2015. Based on this analysis, Americans’ well-being has improved considerably over the past few decades, but the rate of improvement has slowed in recent years.