Since its implementation in June 2012, over 580,000 immigrants from 195 different countries have applied to the Deferred Action for Childhood Arrivals (DACA) program, which offers work authorization and temporary protection from deportation to unauthorized immigrants who came to the U.S. as children. Although the expansion of DACA and the creation of a sister program, Deferred Action for Parents of Americans and Lawful Permanent Residents (DAPA), have been suspended due to legal battles, hundreds of thousands of immigrants have applied for – and many have received – protection through these programs.
In a new study released by the Metropolitan Policy Program at Brookings, Audrey Singer, Nicole Prchal Svajlenka, and Jill Wilson take a look at the implementation of the DACA program. The report’s authors examine not only the people running and facilitating the application process for potential beneficiaries of DACA, but also who the applicants are—and where they came from.
Countries of origin influence immigrants’ decisions on DACA
DACA applicants’ countries of origin vary in how they assist applicants. For example, Mexican consulates in the United States have held more than 5,000 DACA information sessions and have worked closely with potential applicants to become a vital source of information and trust. However, unauthorized immigrants from Asian communities tend to highly value legal status and privacy—meaning there is less media coverage of the issue within the community, less of a collective experience for unauthorized Asian immigrants, and a reticence to reach out for information about the program.
What are the top countries of origin for DACA applicants?
The country and culture of birth for many eligible immigrants has played a large role in their decision to apply for the program. This becomes evident when comparing the estimates of eligible applicants to the percentage of the population who actually applied for DACA.
Here are the five countries where most DACA applicants were born:
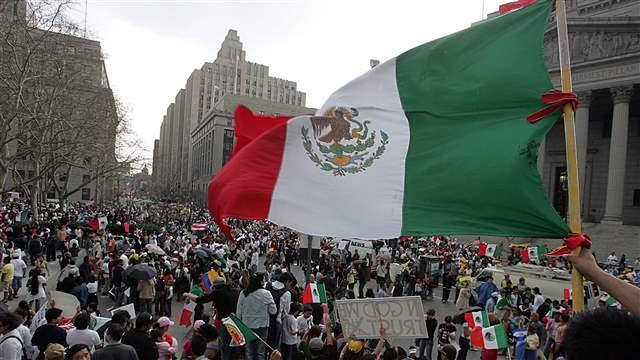
1. Mexico
77% of DACA applicants were from Mexico, while only an estimated 65% were DACA eligible.
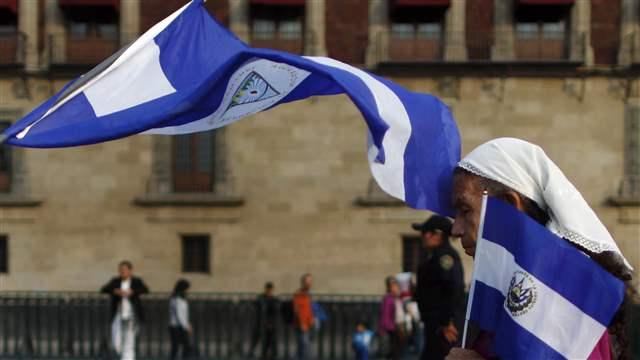
 2. El Salvador
4% of DACA applicants were from El Salvador, and an estimated 4% were DACA eligible.
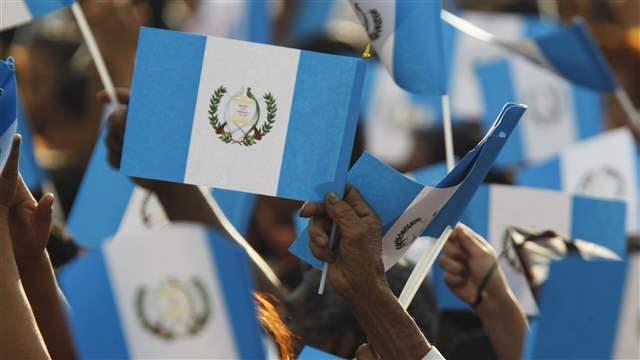
 3. Guatemala
3% of DACA applicants were from Guatemala, and an estimated 3% were DACA eligible.
 4. Honduras
3% of DACA applicants were from Honduras, while only an estimated 2% were DACA eligible.
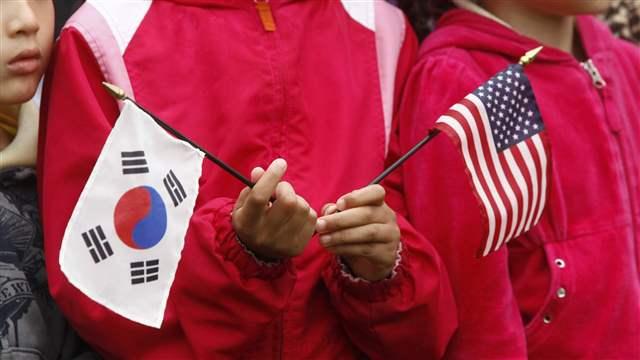
 5. South Korea
1% of DACA applicants were from South Korea, but an estimated 3% were DACA eligible.

Going forward, need to ensure sufficient resources for applicants
For many who are eligible for DACA, there is a lengthy and complex process to obtain protection.
As Singer, Svajlenka, and Wilson note, the biggest challenge going forward with the program is ensuring that sufficient and coordinated resources are being directed to potential applicants. Singer has also written previously on the acceptance rates for DACA and how that affects potential applicants. In the current study, the authors discuss the fears and perceptions about the realities and potential pitfalls of DACA and DAPA and the need for concentrated efforts to get people through two programs that the authors note are “ultimately integration programs.”
To learn more about DACA and its implementation, read the report, “Local Insights from DACA for Implementing Future Immigrant Programs.”
Nicholas Buchta contributed to this post.


Commentary
Top 5 countries of origin of DACA immigrants
June 9, 2015