
The COVID-19 pandemic’s effects on urban population shifts have not completely subsided. But recently released Census Bureau estimates suggest a trend toward demographic revival for most of the nation’s largest metropolitan areas and urban core counties. Population losses in these places are subsiding and, in some cases, turning into gains that are approaching pre-pandemic levels. Migration patterns, especially a continued rise in post-pandemic immigration from abroad, have contributed to these shifts.
The new Census Bureau data for counties and metropolitan areas provide annual estimates through July 2023, permitting an examination of the factors contributing to population shifts for the two years after the peak pandemic year of 2020-21—a historic down year for the nation’s overall population growth as well as for cities and metropolitan areas.
Earlier this year, the Census Bureau released data that suggested greater growth nationally and in several states. Now, the newly released data provides updated information for counties and metropolitan areas.1
This analysis examines how recent urban growth patterns have shifted from the peak pandemic period and now signal a trend toward demographic revival. This includes reduced out-migration and smaller population losses in major metropolitan areas such as New York, Los Angeles, and Chicago, as well as shifts from sharp losses to gains in urban core areas such as San Francisco and Washington, D.C. While natural increase (the excess of births minus deaths) has improved almost everywhere, changing domestic migration patterns and especially a rise in international migration served to benefit population change in large metropolitan areas and their urban core counties.
Major metro areas experienced positive population shifts
Figure 1 provides an overview of growth trends across the metropolitan to non-metropolitan population spectrum since 2010. Of special interest are growth trends in major metropolitan areas—a composite of the 56 metro areas with populations exceeding 1 million. While these areas started to show declining growth patterns even before the peak pandemic year (part of a broad population dispersal), they registered an absolute population loss as a group for the year July 2020 to July 2021—the first in at least 30 years. This was clearly the result of Covid-related shifts toward virtual work and the avoidance of close personal interactions.
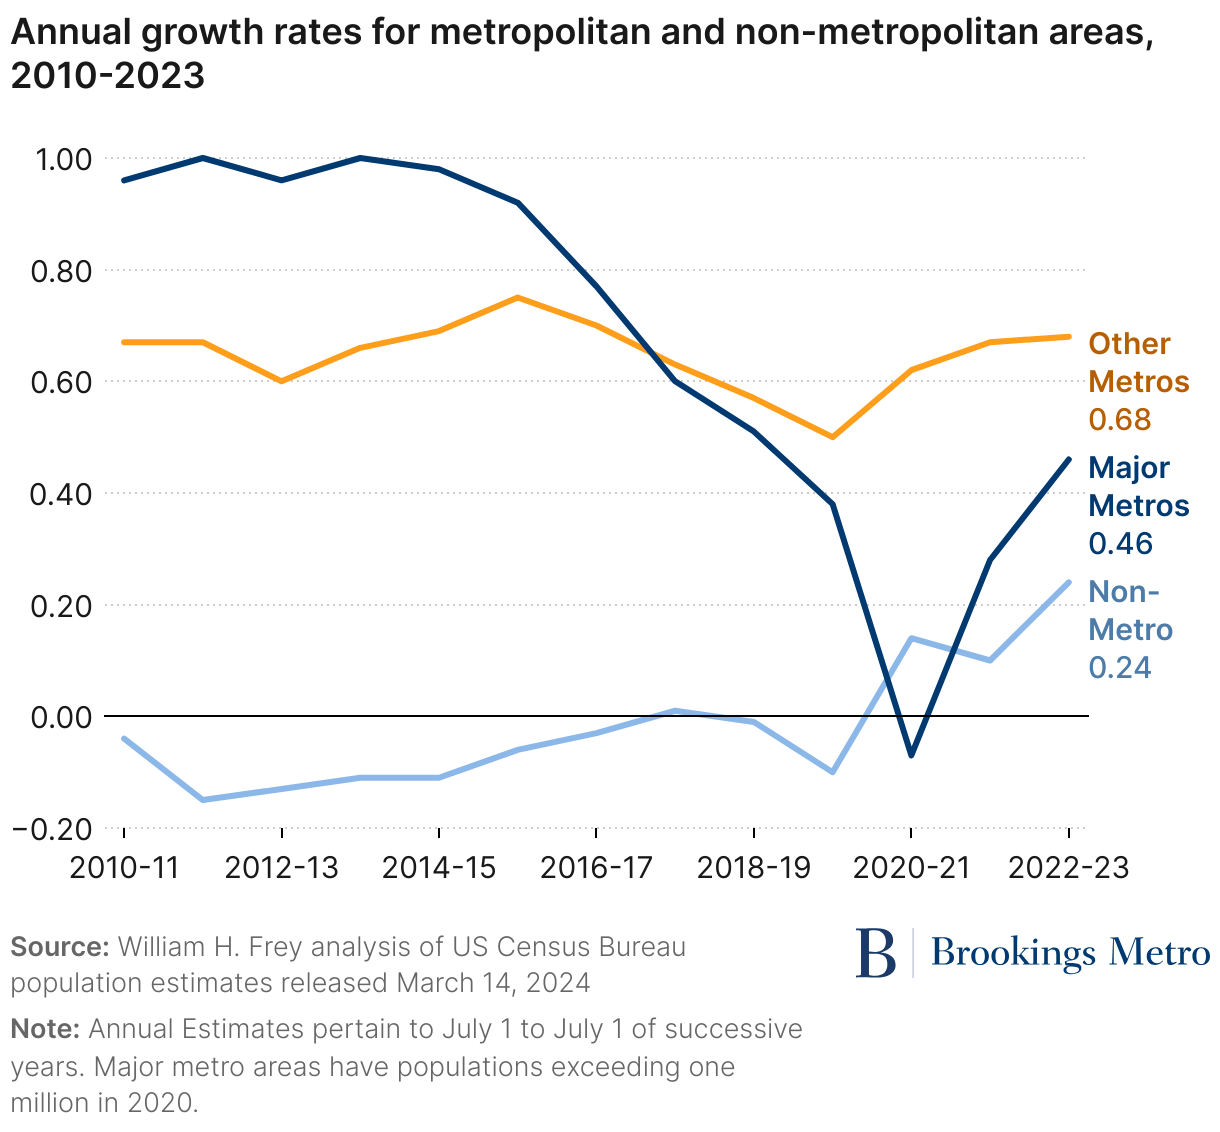
The new Census Bureau data shows that for these major metropolitan areas, a demographic recovery is in the offing. As a group, major metro area growth rates rebounded from a 0.07% decline in 2020-21 to increases of 0.28% in 2021-22 and 0.46% in 2022-23. In total numbers, these percentages reflect a shift from losing 138,385 residents in 2020-21 to gaining 527,358 residents in 2021-22 and 870,471 in 2022-23.
In contrast, smaller metropolitan areas overall showed a growth uptick in 2020-21, which continued through the most recent two years. Among the nation’s 331 smaller metro areas, only 88 showed population declines in 2022-23, compared with 117 in 2020-21.
Non-metropolitan areas—the aggregation of counties that lie outside of metro areas—continued a pattern of population gains since the pandemic, which is a sharp reversal of their negative or miniscule gains for most years in the 2010s decade. Among the nation’s 1,958 non-metropolitan counties, 949 lost population in 2022-23, compared with 1,003 in 2020-21. Yet, despite recent gains, the nation’s aggregate non-metropolitan population growth rate still lags those of major and smaller metropolitan areas.
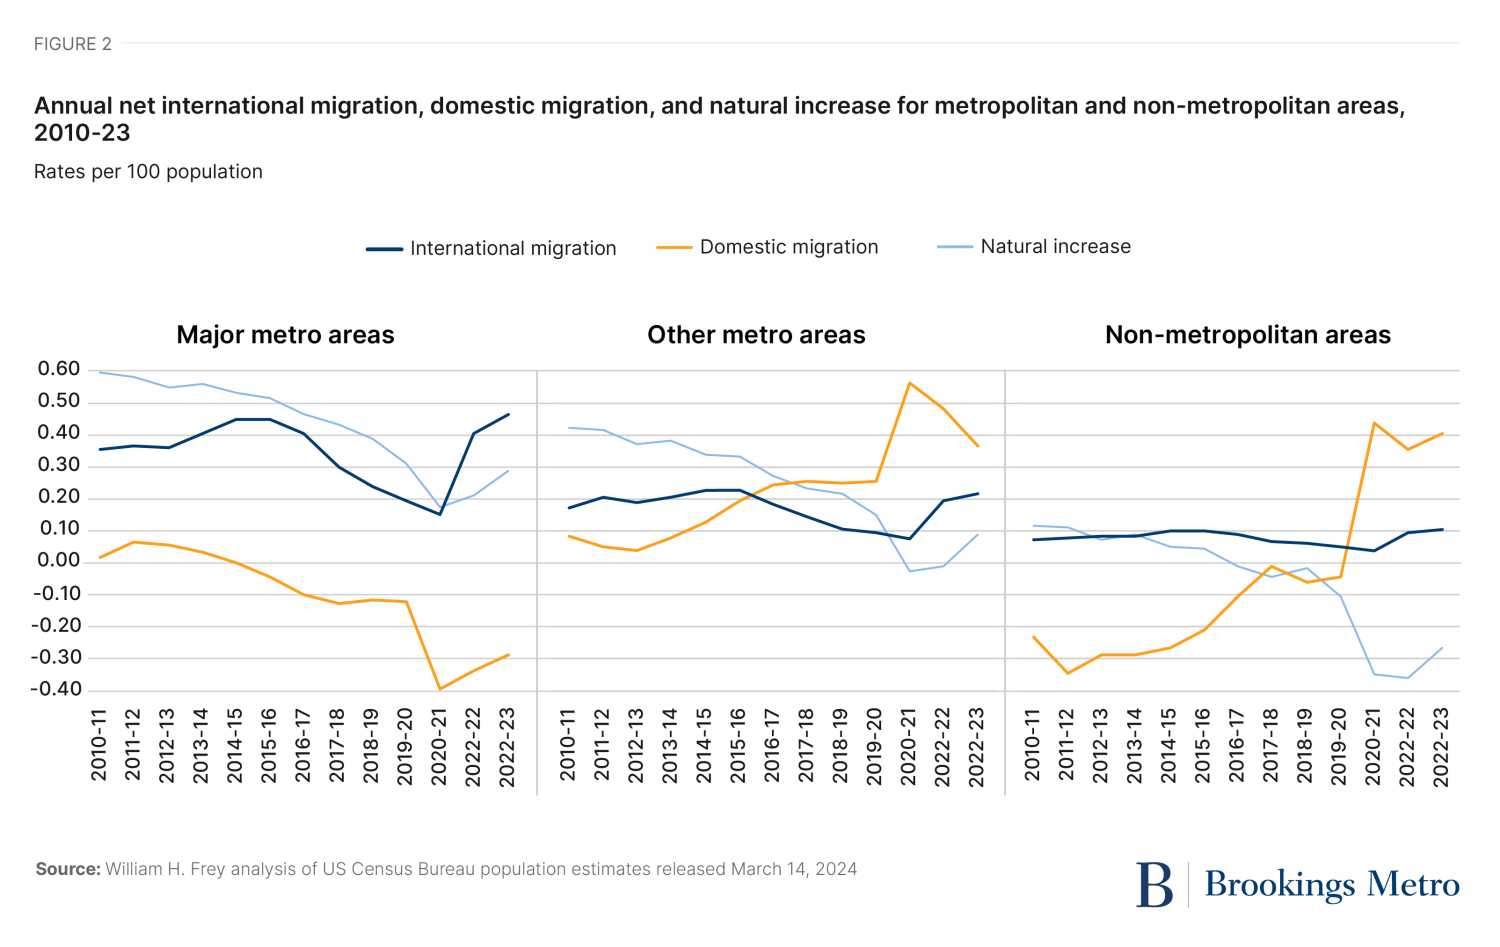
Figure 2 depicts the components of population change: immigration from abroad, domestic migration, and natural increase. It shows that domestic migration was the primary contributor to recent population shifts. This is especially the case for major metro areas, which registered domestic migration gains early in the 2010s before a wider dispersion to smaller areas took place. Yet it was in the peak pandemic year (2020-21) when domestic migration in these areas took a sharp dip, as many residents departed for smaller metro areas and non-metropolitan areas.
This pattern reversed course over the past two years as the exodus from major metro areas tapered off. At the same time, immigration from abroad rose notably from low levels in the late 2010s and the peak pandemic year, contributing substantially to the major metro area growth uptick. Also contributing was the rise in natural increase, as deaths declined and births rose in the post-pandemic period.
In smaller metro areas, domestic migration was still higher than in pre-pandemic years, yet it slowed somewhat in 2021-22 and 2022-23. What kept these areas’ growth going was the rise in immigration from abroad in both years and a shift from seeing more deaths than births to seeing more births than deaths in the past year.
The major demographic player in non-metropolitan areas was domestic migration. Prior to the pandemic, these areas saw overall out-migration. However, in-migration to these areas rose sharply in the peak pandemic year and remained high in the two years since. This rise in domestic migration more than offset these areas’ sharp pandemic-related rise in natural decrease (the excess of deaths over births). And while immigration from abroad rose as well, the recent high levels of domestic migration was the major contributor to post-pandemic non-metropolitan growth.
Most major metro areas showed stronger growth in the post-pandemic years
While not all major metro areas followed the broad demographic recovery patterns discussed above, most did. Among these 56 areas, 40 did better demographically in 2022-23 than in the prior year, with smaller population losses, greater gains, or flips from losses to gains. And 40 areas also did better in 2022-23 than in 2020-21: 12 showed smaller losses, 21 showed greater gains, and seven flipped from losses to gains. (See downloadable Table A.)
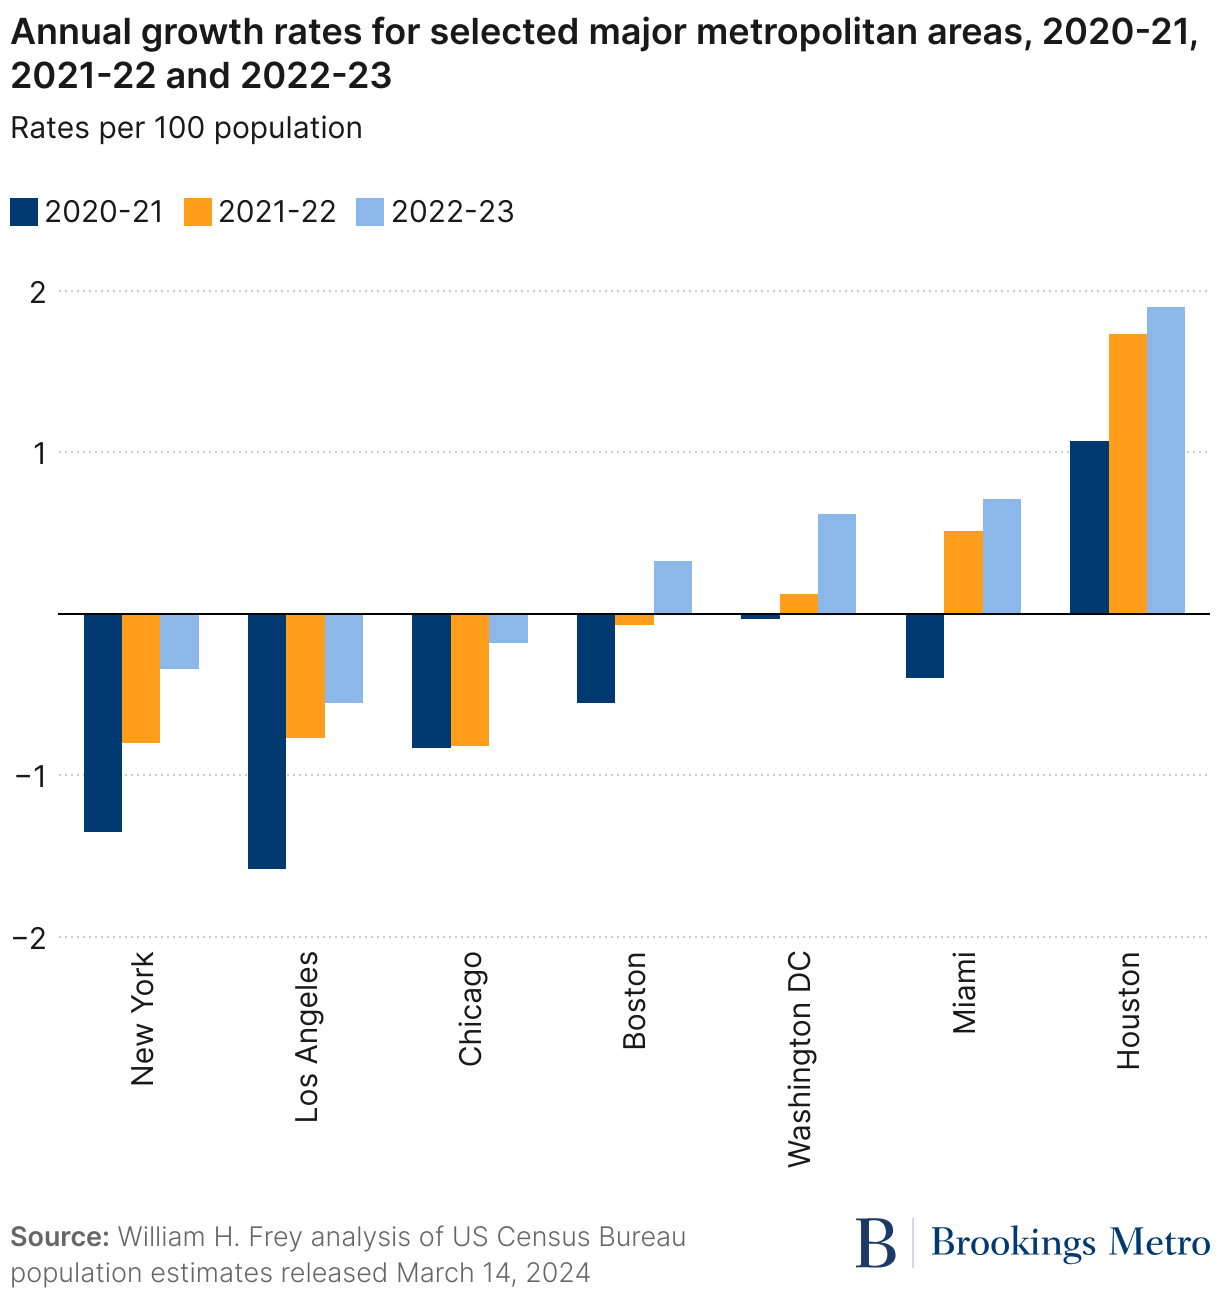
Seven of the 10 largest U.S. metro areas did better in 2022-23 than in both previous years (see Figure 3). In New York, Los Angeles, and Chicago—the nation’s three largest metro areas—substantial 2020-21 population declines became reduced considerably by 2022-23. In Boston, 2020-21 population declines were reduced in 2021-22, then shifted to gains in 2022-23. In Washington, D.C. and Miami, 2020-21 declines shifted to gains in the following two years. And in Houston, 2020-21 gains continued to rise.
Positive post-pandemic population shifts were not unique to the very largest metro areas; they occurred in all regions of the country. Among other metro areas that flipped from population losses to gains in 2022-23 were Louisville, Ky.; Milwaukee; Minneapolis-Saint Paul; Seattle; and Providence, R.I. Among those that that showed increasing gains were Charlotte, N.C.; Cincinnati; Columbus, Ohio; Denver; Indianapolis; and Jacksonville, Fla.
The recent data also shows a narrowing of growth levels between areas that gained the most residents and those that lost the most in the past year. This suggests a softening of pandemic-era domestic migration patterns that saw many Americans move away from coastal and interior metro areas and into urban magnets in the South.
Seven of the 10 major metro areas with the greatest population gains showed smaller gains in 2022-23 than in the previous year: Dallas; Atlanta; Orlando, Fla.; Tampa, Fla.; Austin, Texas; Phoenix; and San Antonio. Each of these also attracted fewer domestic migrants than in the previous year (see downloadable Table B).
In contrast, 18 of the 20 major metro areas with greatest population losses lost fewer people in 2022-23 than in 2021-22, led by Los Angeles, New York, Chicago, New Orleans, San Francisco, and Pittsburgh. Most of these lost fewer domestic migrants than in the previous year.
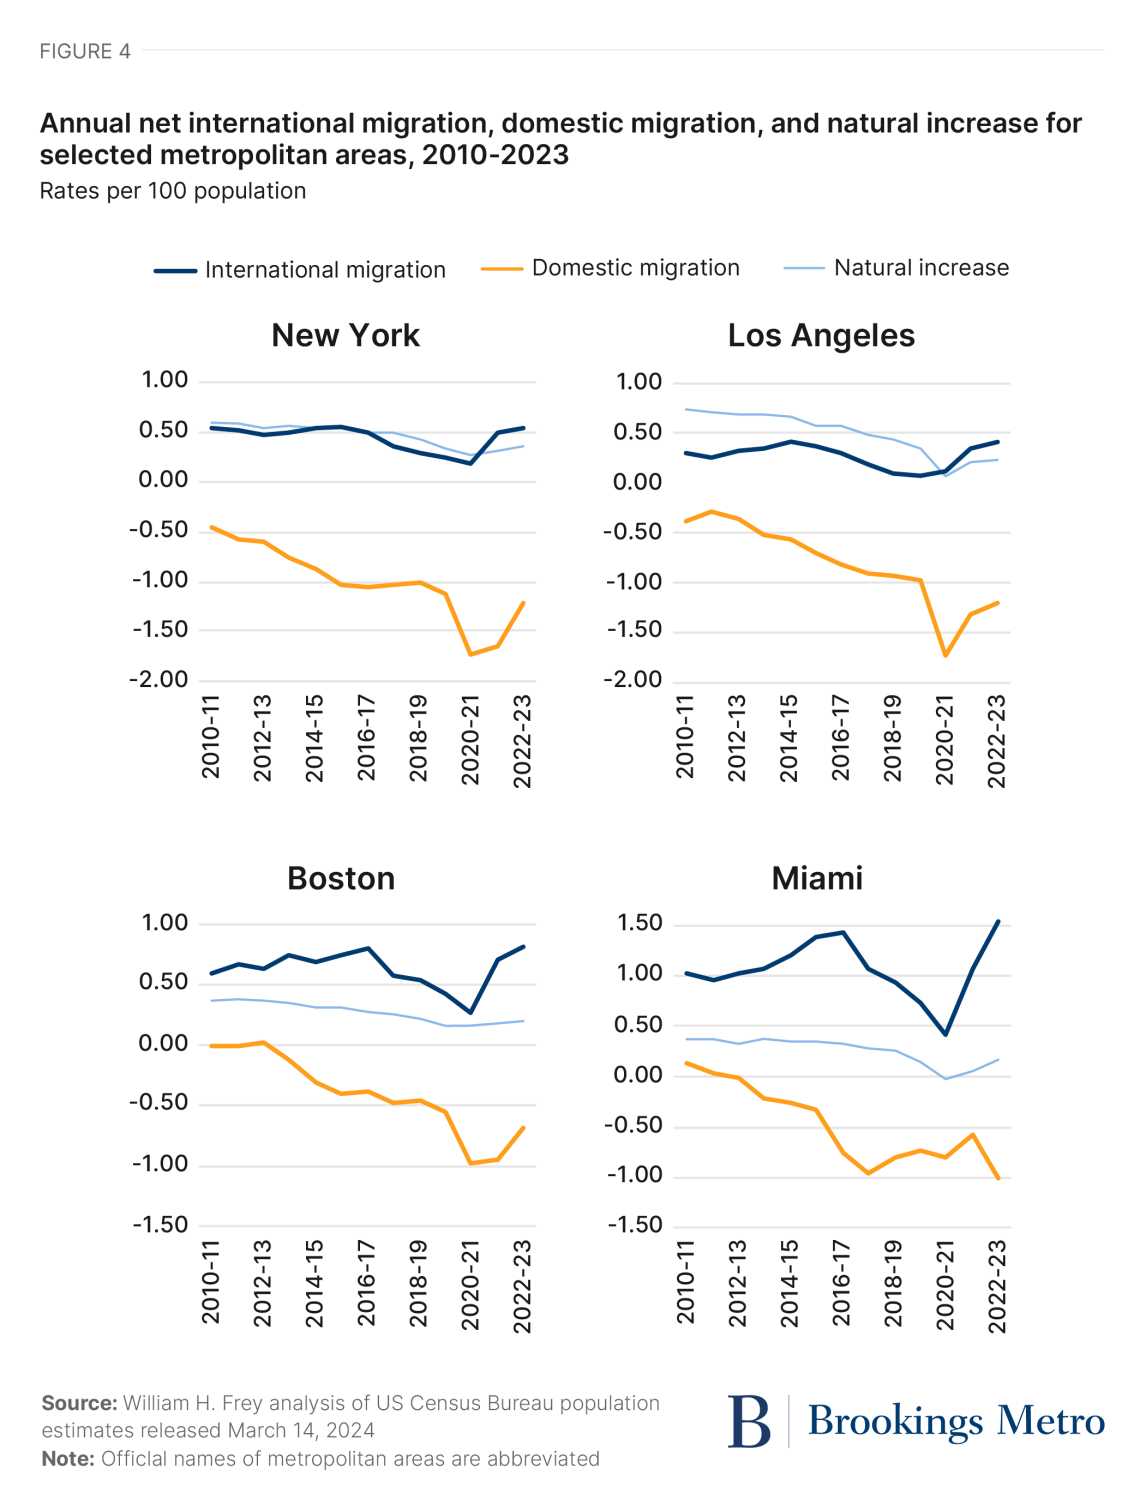
Recent shifts toward smaller population losses or greater gains in 2022-23 in most areas reflect some combination of immigration, domestic migration, and natural increase—and usually all three. Figure 4 depicts trends impacting four areas: New York, Los Angeles, Boston, and Miami. In each, peak pandemic year surges in domestic out-migration exerted a substantial impact on those areas’ population losses. Since then, lower domestic out-migration contributed much to the gains, as did rises in natural increase. But in several areas—especially Miami and Boston—immigration from abroad made a primary contribution.
Urban core counties show signs of a comeback
Just as major metro areas registered sharp population losses in the peak pandemic year of 2020-21, this was also the case for urban core counties in metropolitan areas, which often contain the primary cities of those areas. Figure 5 displays recent growth trends of three classes of counties located within metropolitan areas, based on a Brookings typology: urban core, inner suburbs, and outer suburbs.2
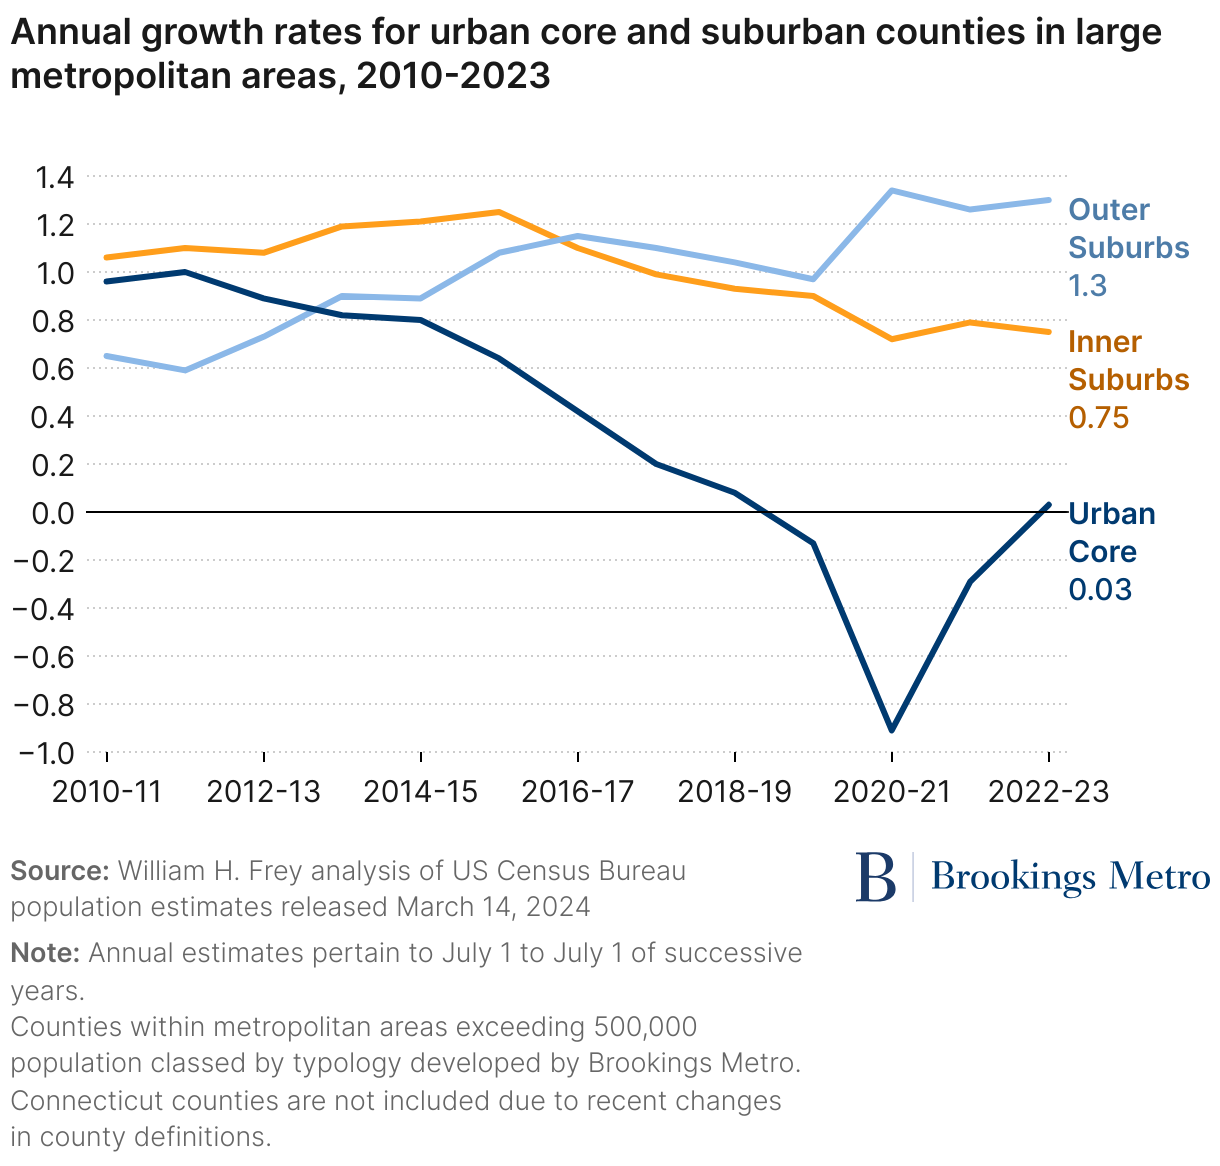
Annual trends since 2010 show uneven change within urban core counties. At the beginning of the decade, in the aftermath of the 2007-09 Great Recession, many cities and urban cores displayed unusual growth spurts, as many young adults were “stranded” economically and geographically, unable to find jobs and afford mortgages to move to suburban and smaller-sized places. Urban core growth levels began to decline by mid-decade as the economy and suburban housing market picked up, leading to a population dispersion to inner and then outer suburbs (see Figure 5).
Then, the COVID-19 pandemic hit and the exodus from urban cores picked up. As shown in Figure 6, urban core populations declined by 0.91% in 2020-21. This was followed by a smaller decline of 0.29% in 2021-22, and most recently a modest gain of 0.03% in 2022-23—the first positive growth since 2018-19. Even inner suburbs witnessed a growth slowdown in 2020-21, and have stayed at similar levels since. Only the outer suburbs showed meaningful population gains during the peak pandemic year—well above those registered in the 2010s.
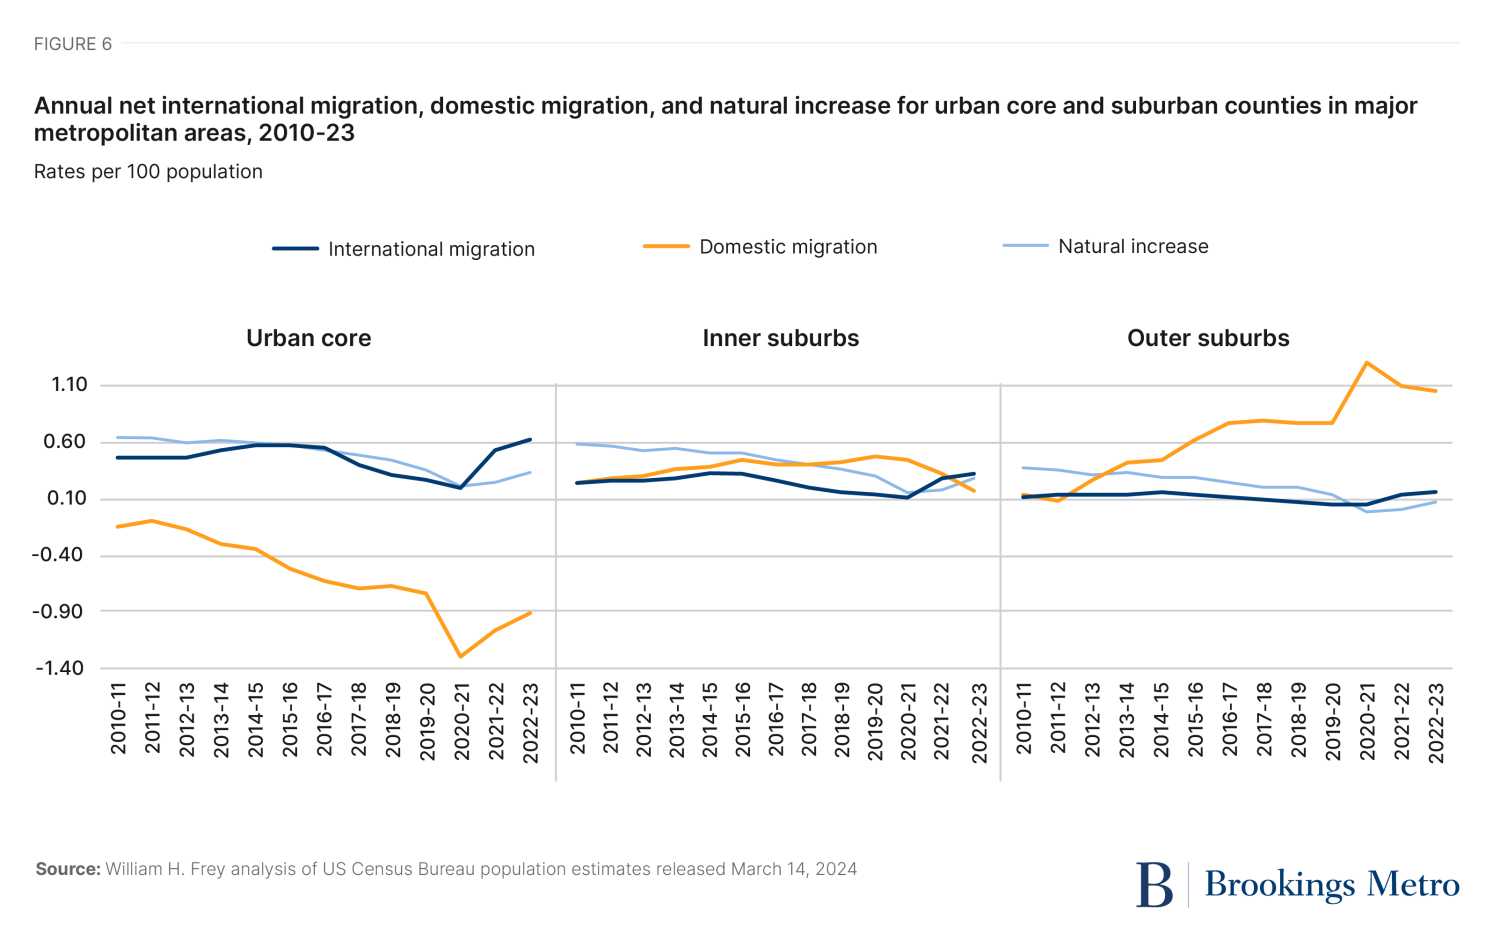
As with major metro areas’ population losses to smaller and non-metropolitan areas, the primary demographic component contributing to the peak pandemic year’s urban core downturns was domestic migration. In both cases, this out-migration was, to some degree, enabled by remote work technologies. While already negative in the years prior, out-migration from urban cores increased considerably in 2020-21.
Still, domestic out-migration modestly eased up in the following two years as some residents returned to cities. And although natural increase in urban core counties also rose, immigration from abroad made a major contribution to their recent gains.
Immigration also contributed to recent growth in the inner suburbs, which—along with rising natural increase—helped to counter smaller post-pandemic domestic in-migration. In the outer suburbs, a rise in domestic migration was the primary reason for continued growth
Urban core population shifts are widespread
In the aggregate, the urban core shifts discussed above reflect fairly widespread patterns among individual counties. An examination of 38 such counties located in major metro areas shows that 28 of them did better demographically in 2022-23 than in 2021-22, and 34 of them did better than in 2020-21. Among the latter, 17 had smaller population losses, four had greater population gains, and 13 flipped from losses to gains (see downloadable Table C).
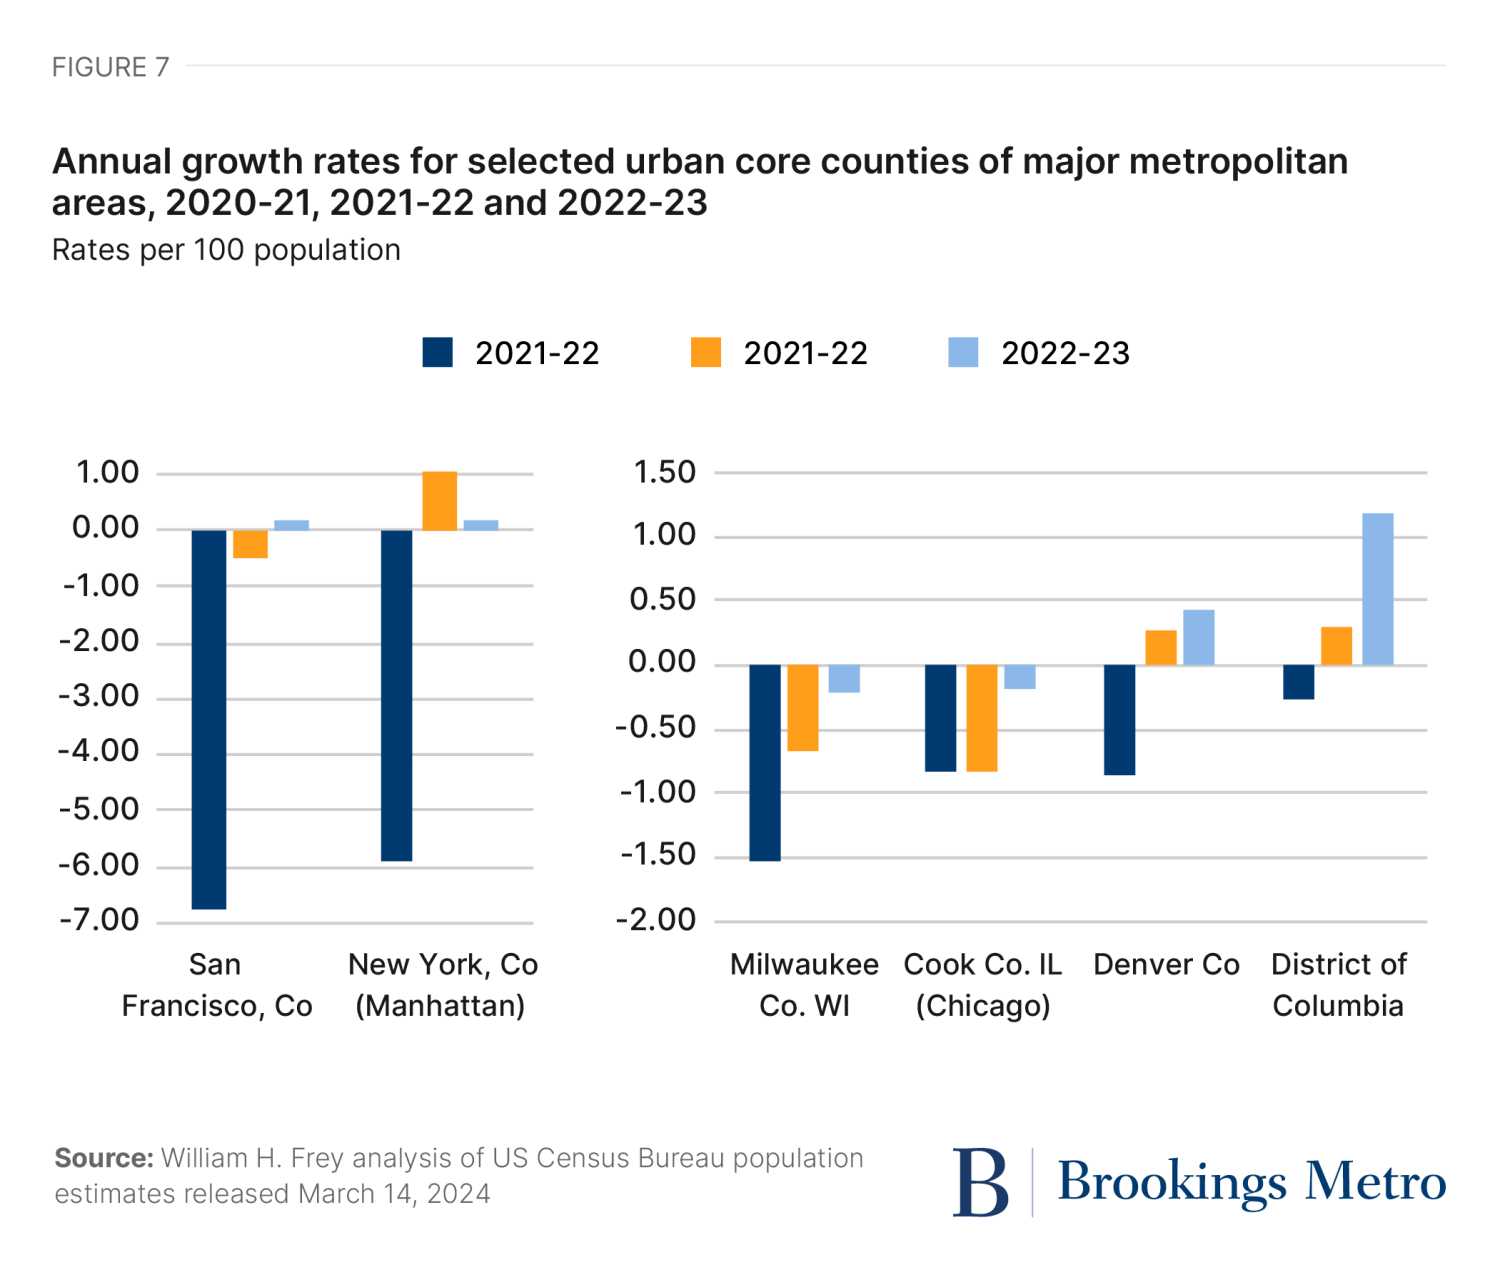
Two primary examples of such counties are San Francisco County (the city of San Francisco) and New York County (the borough of Manhattan). Both were highly profiled symbols of pandemic-related flight, not only in terms of population but also employment, retail, etc. Yet both have also come back demographically from their sharp 2020-21 population declines of 6.7% and 5.9%, respectively. Four other counties reflect the experiences of the majority of urban core counties: Milwaukee County and Cook County (home to Chicago), which showed lower population losses in the past two years; and Denver County and Washington, D.C., which shifted from losses in 2020-21 to gains in the past two years.
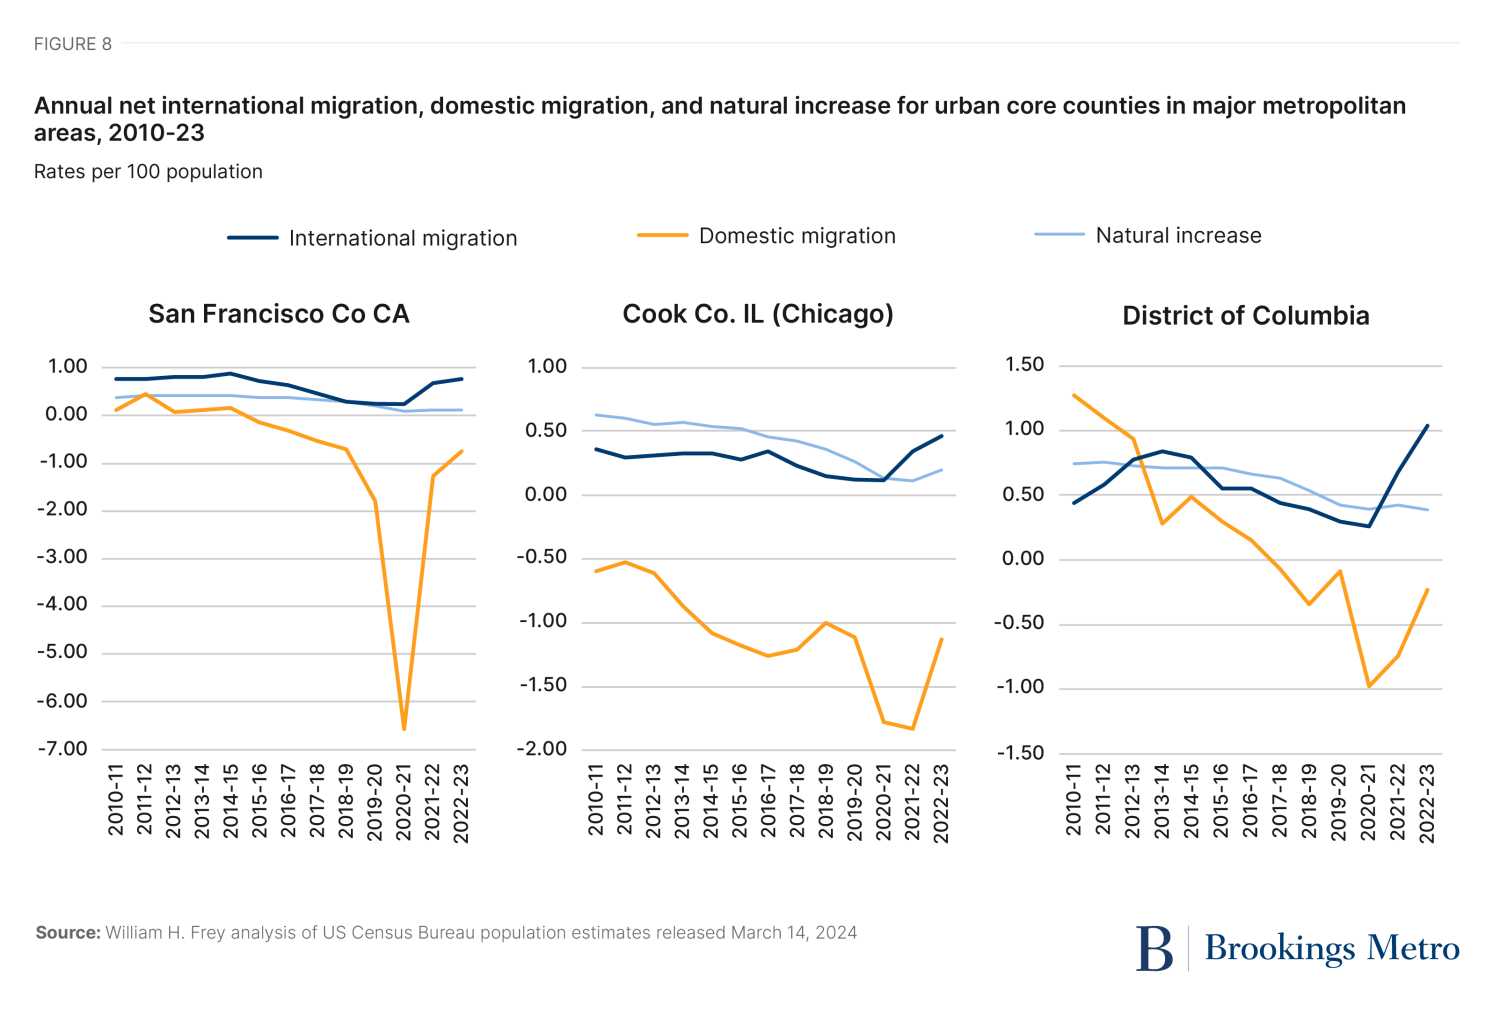
A look at the components of change for three of these areas illustrates the importance of domestic migration in contributing to sharp peak pandemic year declines, and the importance of all three components toward their subsequent demographic improvements (see Figure 8 and downloadable Table D). The sharp peak pandemic year domestic migration dip—and then rebound—is most apparent in San Francisco, but also evident in Cook County and Washington, D.C. Yet in the years that follow 2020-21, the rise in international migration makes a bigger impact than that of rising natural increase.
The role of immigration in large metro area population gains
The discussions above make clear that domestic migration was a key driver of population losses or slower growth for most major metropolitan areas and their core counties during the peak pandemic year. The strong pushes and pulls associated with the avoidance of proximity to others and quick expansion of remote work led to extreme one-year movement patterns away from urban areas and cities. A rise in deaths and somewhat lower number of births in this unusual year also contributed.
While both of these demographic components—domestic migration and natural increase—are beginning to revert to pre-pandemic patterns, the rise in immigration from abroad was a unique and demographically welcome contributor to reduced losses and increased gains in many major metro areas and their urban core counties. And in the future, it is likely to be a substantial contributor to many of these areas that serve as major immigrant destinations.
As revealed in an earlier census release, net international migration to the U.S. rose considerably in 2021-2022 and 2022-2023, from the almost historically low levels in the peak pandemic year and only modest levels in the late 2010s. And as it rose, the greatest beneficiaries were major metro areas.
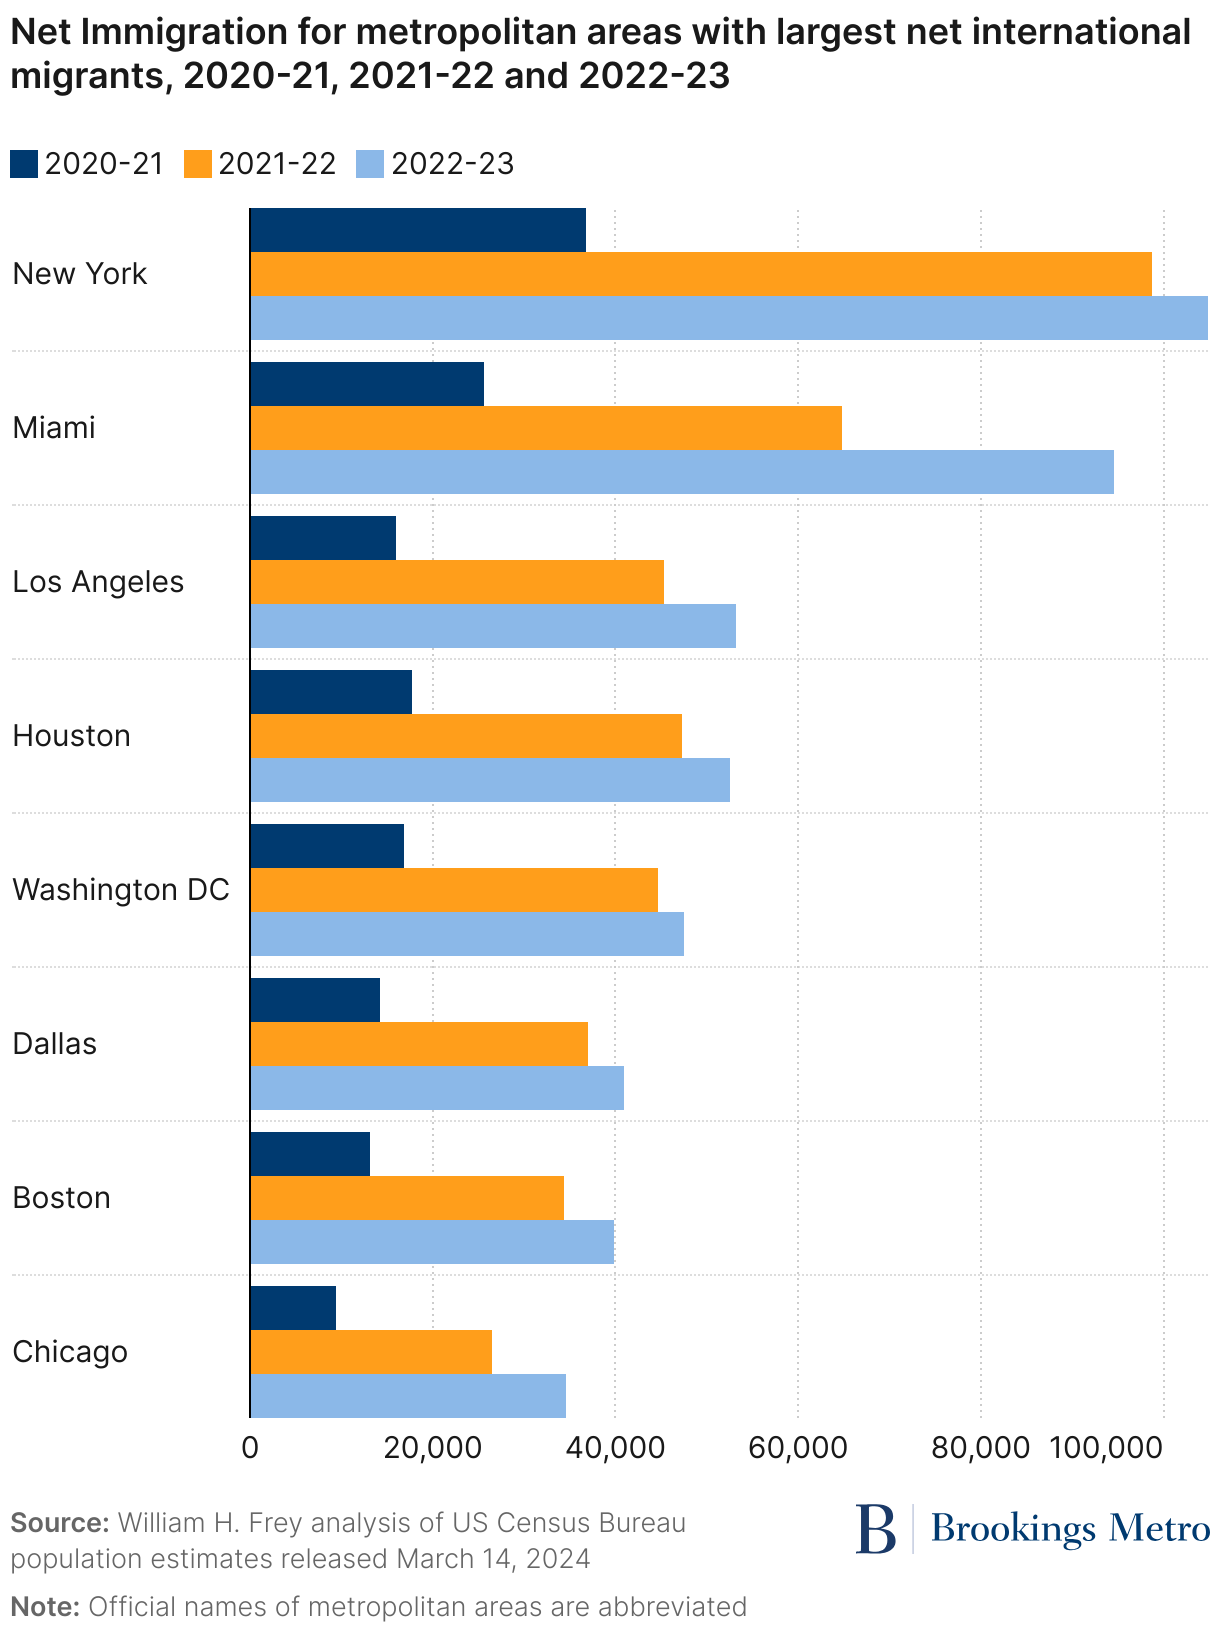
In fact, the 20 metro areas that attracted the most immigrants in 2021-22 and 2022-23 accounted for 61% of total U.S. immigrant gains, while comprising only 36% of the U.S. population (see downloadable Table E). The eight metro areas with the largest immigrant gains (shown in Figure 9) illustrate the sharp rises in immigration that took place in the past two years.
Thus, most major metro areas benefitted substantially from this increase in immigration. Of the 37 major metro areas that gained population over the two-year period from 2021 to 2023, immigration accounted for over half of the gains in six and at least a quarter of the gains in 18. Moreover, 11 of these metro areas—including Miami, Boston, Washington, D.C., and Seattle—would have lost population were it not for immigration from abroad. And many metro areas that lost population in the past two years would have lost considerably more in the absence of immigration; for example, metropolitan New York’s two-year loss of 222,943 residents would have instead been a loss of 426,700 without international migration.
Immigration is especially important for the urban cores of many of these areas, as the biggest immigrant magnet counties tend to be urban core counties of major metro areas (see downloadable Table E). Over the past two years, immigration contributed substantially to their reduced losses, or their switch from losses to gains (see downloadable Table D).
Immigration is likely to be an important future contributor to future city and metropolitan growth, and has shown to be essential for the nation’s demographic vitality. As Brookings scholars Wendy Edelberg and Tara Watson note, it has already made substantial contributions to the nation’s economic recovery over the post-pandemic period.
An urban demographic revival?
The new census estimates do not paint the rosiest of scenarios for a revival of major metropolitan areas and their urban cores—that will take a few more years to assess. What they do show is a fairly widespread demographic improvement in terms of reduced population losses or shifts from losses to gains in some of the areas the COVID-19 pandemic hit hardest. Domestic migration has rebounded to some degree, overcoming the “urban doom loop” prognostications from right after the pandemic. Natural increase has also rebounded almost everywhere, as the earlier spike in Covid-related deaths has subsided and births have risen a bit. And international migration appears to be the “magic bullet” not previously foreseen as a contributor to urban population gains.
Demographics alone is not the only measure of how well metro areas and cities are doing economically, especially since remote work, though less pervasive, is still occurring. But demographics do matter, and the new Census Bureau numbers make the case that major metro areas and cities are showing signs of coming back, with an important contribution from international migration.
Author

Related Content


-
Footnotes
- This data is compiled by the Census Bureau’s population estimates program for counties: evaluation estimates for the period 2010-20 and vintage 2023 estimates for 2020-21, 2021-22 and 2022-23. Metropolitan and non-metropolitan statistics represent aggregations of these counties consistent with metropolitan definitions based on 2020 standards released by the U.S. Census Bureau in July 2023.
- The Brookings typology classifies counties in metropolitan areas with populations greater than 500,000 according to the following: “urban cores” are counties that have more than 95% of their population residing in urbanized areas; “inner suburbs” are counties that have between 75% and 95% of their population residing in urbanized areas; “outer suburbs” are counties that have less than 75% of their populations residing in urbanized areas. The analysis in Figure 5 omits counties in Connecticut, which were redefined according to planning regions with the recent estimates and are therefore incompatible with those of years prior to 2020.
The Brookings Institution is committed to quality, independence, and impact.
We are supported by a diverse array of funders. In line with our values and policies, each Brookings publication represents the sole views of its author(s).


