Diversity in America is still on the rise—and in ways that will benefit our nation going forward. As I discuss in the new edition of my book, “Diversity Explosion: How New Racial Demographics are Remaking America,” this “diversity boom” is making a much-needed contribution to our nation’s demographic and economic growth, while also further establishing our strength as a multiracial, multicultural society. This is especially true for the younger end of the age spectrum, where the growth of youthful minority groups is countering population losses in the aging white population. These groups are making critical contributions to our labor force and consumer populations—as well as to our politics, as the results of the 2026 midterm elections made clear.
The 2020 census was the first to report that more than half of the nation’s population under age 18 was comprised of Americans who identified either wholly or in part with nonwhite racial or ethnic groups. This was due both to the gains among youthful populations identifying as Latino or Hispanic, Asian American, or two or more races, but also to the numeric decline of the under-18 white population.
Now, the latest Census Bureau population estimates show diversity moving up the age spectrum, such that now more than half of the population under age 30 identifies with racial or ethnic minority groups.1 Minority shares of the under-30 population are larger than those of the total population for the nation, all states, as well as most metropolitan areas and counties, though the specific mix of minority race or ethnic groups varies across each of these places.
These mid-decade statistics tell us that America’s young adult population—beginning with Gen Z—will be the most racially diverse in the nation’s history. This will be the case even under near-term scenarios of zero or low immigration. But what’s critical to note is that minority populations are not “replacing” the nation’s aging and slow-growing white population, but rather “augmenting” it. This includes more people identifying as white alongside another race, leading to a greater assimilation into a multiracial and multicultural mainstream population. These new statistics make plain that the nation’s 21st century “diversity boom” is continuing by spreading up the age spectrum and to all parts of the country.
The total minority population share has risen in all age groups
The nation’s rising diversity did not slow down in the first half of the 2020 decade, despite the roller coaster of population shifts fueled by early pandemic-era demographic downturns in natural increase (i.e., more deaths and fewer births) and later increases—then decreases—in immigration from abroad.
Figure 1 shows that between the 2020 census and July 1, 2025, racial and ethnic minorities—especially Latino or Hispanic and Asian Americans—accounted for all the nation’s population gains, countering significant losses in the white population.


Yet what is especially significant are minority group contributions to different age groups, countering white declines in most (a notable exception being large white gains in the 70 and older population, as the heavily white baby boomer population continues to advance into this age group). Notable as well are the large minority gains for those age 20 to 29 and 30 to 39, which came not just from immigration, but from younger, U.S.-born cohorts of different minority groups advancing into these ages. Again, these contributions served to counter white population declines as white Americans age out of these age groups.

As a result, the total minority population share has risen in each broad age group, from ages zero to nine up through age 70 and older. Minority population shares now range from 25.9% of the 70-plus group (the first time more than quarter of this age group has been classed as minorities), to 54.8% for ages zero to nine. Also for the first time, the three age groups under age 30 show the combined nonwhite race-ethnic populations to be greater than half of their populations, with gains among persons identifying as Latino or Hispanic, Asian American, or two or more races contributing especially to those increases.
Minorities comprise over half the nation’s under age 30 population
The 2020 to 2025 shifts in nonwhite racial and ethnic minority population shares have now led to a tipping point for the under-30 population, such that more than half identifies all or in part with a nonwhite racial or ethnic group. This is the case for each individual age between zero and 29 (see downloadable Table A), as well as for the entire under-30 population, where the combined minority groups comprise 52.8% of the population—substantially higher than those groups’ 43.9% share of the total U.S. population.

Variation across states
Racial and ethnic diversity among the under-30 population has risen across the country. Although all states showed a rise in minority shares for this age group, there is wide variation among them (see Map 1 and downloadable Table B).
In 22 states (including the District of Columbia), at least half of the under-30 population identifies as a racial or ethnic minority, led by Hawaii at 83% (which has large numbers identifying as Asian American and two or more races). In nine of these 22 states, more than three-fifths of the under-30 population identifies with a nonwhite race or ethnic group, including the large states of California (76.5%), Texas (70.9%), and Florida (60.5%). Two other large states, New York (54.9%) and Illinois (52.2%), are also in this group of 22 states.
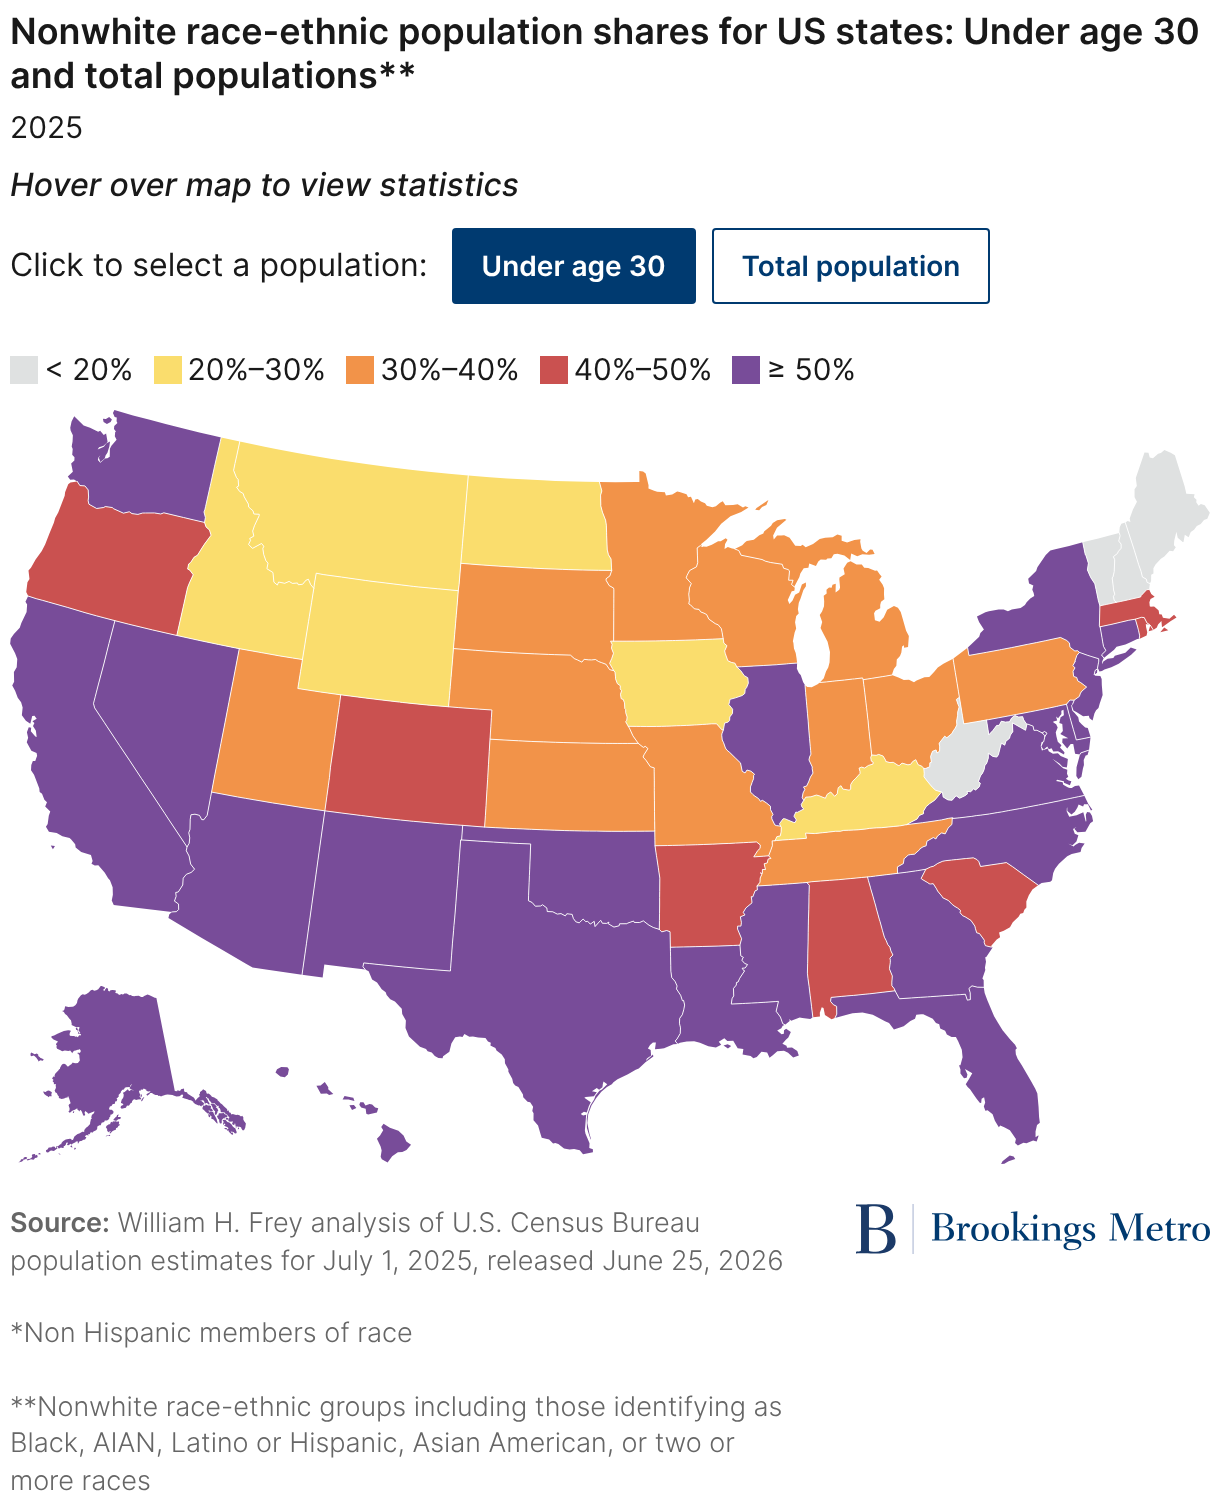
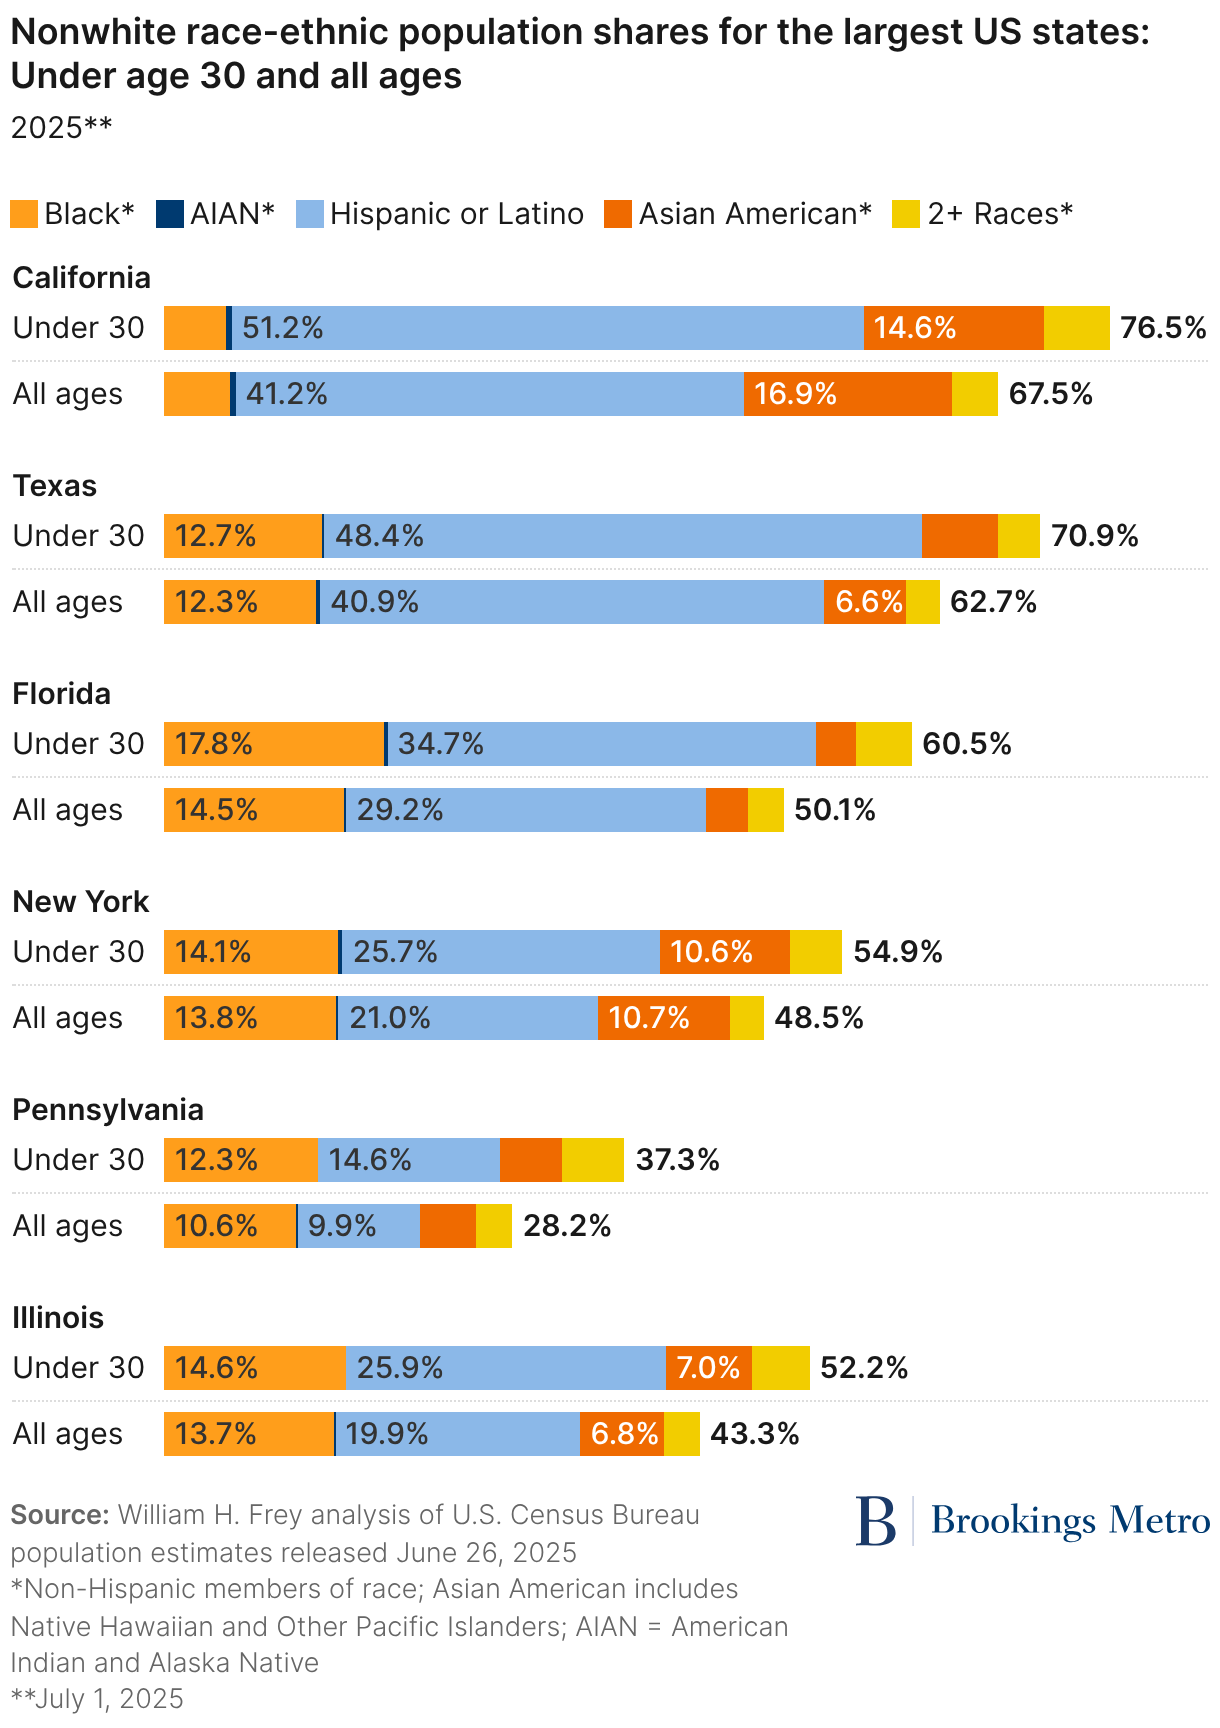
In another 19 states, more than 30% of the under-30 population identifies with minority groups, including Pennsylvania (37.3%), Michigan (35.9%), and Ohio (33%). Even states with smaller minority shares have seen these shares rise since 2020, and have higher minority shares in their under-30 populations than across their total populations.
Variation across counties
Across the nation’s 3,141 counties, there is a wide range of diversity among the under-30 population. Still, in the vast majority, the minority share of this younger population has risen since 2020, and is higher than that of the county’s total population.


In 758 counties (about a quarter of all of them), minorities exceed 50% of the under-30 population. However, counties vary by size, and those with the highest minority shares tend to be larger and more metropolitan ones (see downloadable Table C). In fact, the combined populations of these 758 counties constitute 54% of the total U.S. population. As Map 2 and Figure 6 show, these counties are also heavily represented in the South and West, as well as in many large metropolitan areas in other regions of the country.
Still, roughly half of all counties—representing 82% of the U.S. population—are places where minorities comprise more than 30% of the under-30 population. Even in nonmetropolitan counties where the minority share of the under-30 population is relatively small, those shares have risen since 2020 and are larger than those of the counties’ total populations.
The minority race-ethnic makeup of the under-30 population also takes on different mixes in distinct parts of the county. Figure 6 makes clear how these mixes differ across regions and metropolitan categories. Notably, there is the higher share of Black residents living in the South and large Latino or Hispanic shares in the West. Though, in each case, there is a mix of all racial and ethnic groups.
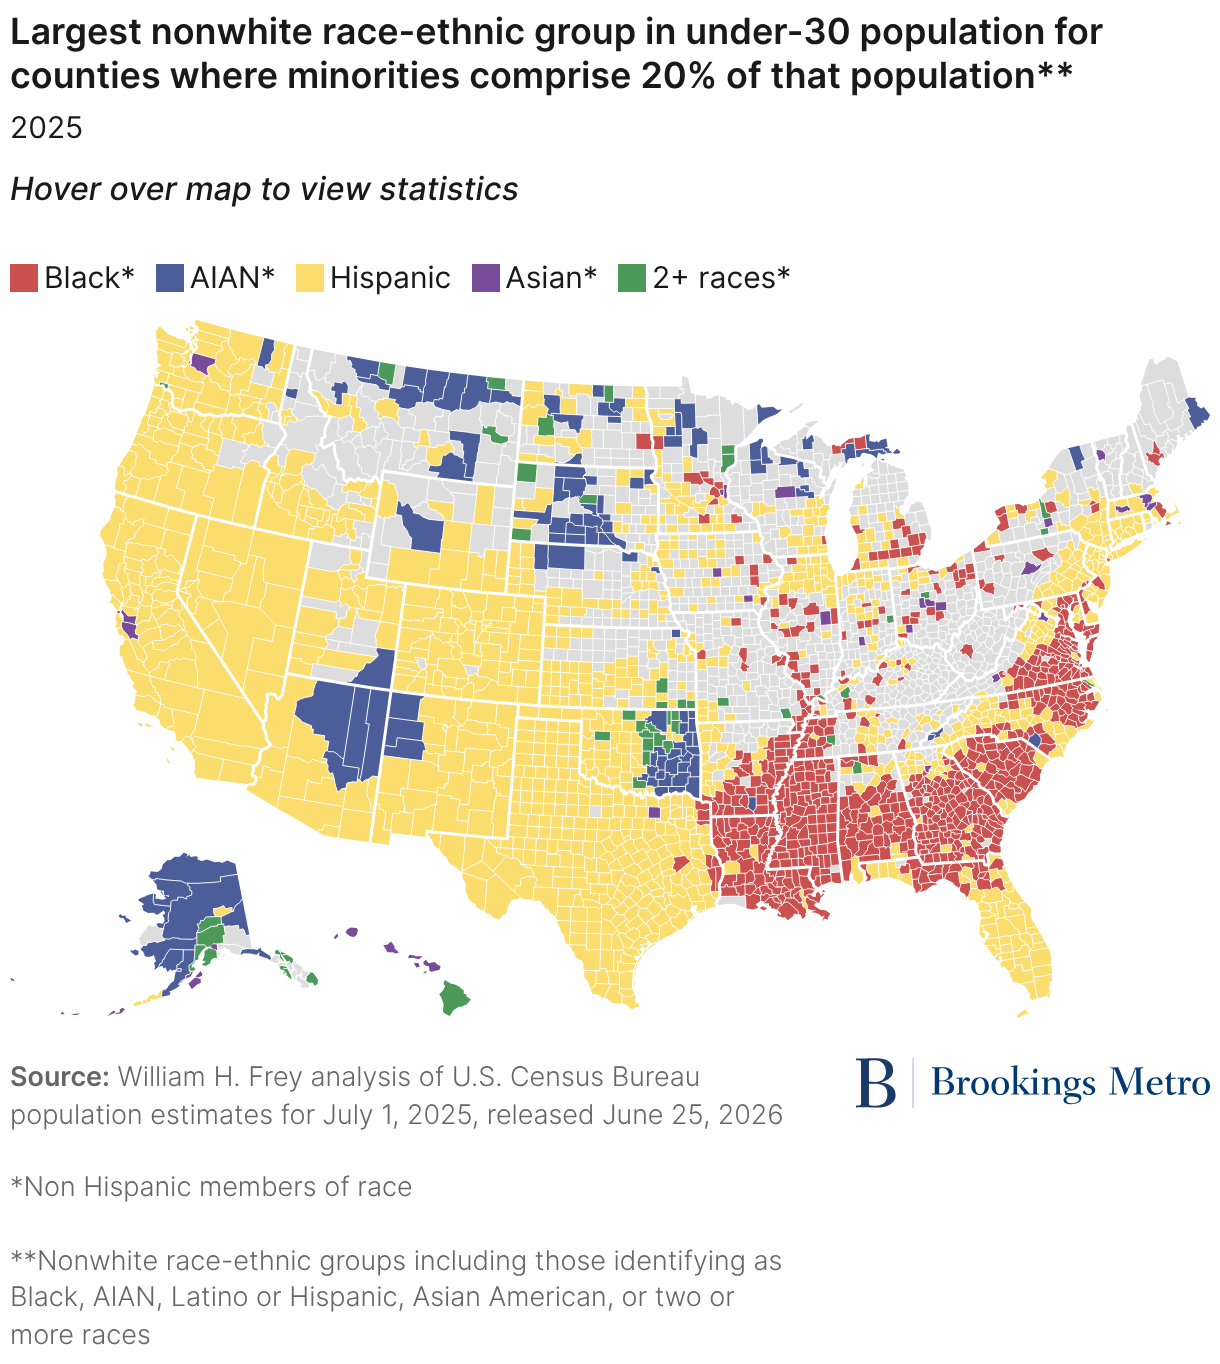
The variation is also evident among individual counties. Map 3 indicates the race or ethnic group that holds the highest share of the under-30 population for each county where minorities comprise more than 20% that population. It shows that the Latino or Hispanic share is indeed the highest in most of these counties and in all parts of the nation, especially in the South and West, including the states of Texas and California. Yet the Black share of young minorities is heavily represented in a broad swath of Southern states as well as select places in other regions. American Indian and Alaska Native under-30 populations are highly represented in counties in Alaska, Oklahoma, South Dakota, and others.
Even when one group represents the largest share of the minority population in these counties, other groups are also represented as part of the mix—making the under-30 population a multiracial group in most parts of the United States.
Variation across major metropolitan areas
As noted above, major metropolitan areas (those with populations over 1 million) tend to have the highest shares of race and ethnic minorities in their under-30 populations.
In fact, in 34 of the nation’s 56 major metro areas, minorities comprise more than half of the under-30 population, compared with just 20 where minorities comprise more than half of the total population (see Map 4).


Four California metro areas topped the list: Fresno, Riverside, San Jose, and Los Angeles, each with roughly 80% or more of their under-30 populations registering as minorities. Yet metro areas in Texas (Houston, San Antonio, Dallas, and Austin), Florida (Miami and Orlando) as well as others in California (San Francisco, San Diego, and Sacramento) also rank high (see downloadable Table D).
In 49 of the 56 major metro areas, minority race and ethnic groups comprise more than 40% of the under-30 population. These major metro areas are located in all regions of the country. Figure 7 shows the different racial mixes for several, with large Latino or Hispanic and Asian American populations in Los Angeles, substantial Black populations in Atlanta and Detroit, and more of a mix in New York, Chicago, and Dallas.
Six major metro areas have smaller minority shares in their under-30 populations, yet still above 30%: Louisville, Ky.; Rochester, N.Y.; Greenville, S.C.; St. Louis; Cincinnati; and Grand Rapids, Mich. Only Pittsburgh (at 25.7%) ranks below these.
Diversity, racial blending, and America’s future
The new Census Bureau estimates make plain that the nation’s population continues to diversify from the bottom up. Since the beginning of this century, minority racial and ethnic child populations have become visible in neighborhoods, playgrounds, and schools. For several years now, minority students have comprised over half of all students in the nation’s public schools, and the same is presently the case for college enrollees. And now that nonwhite racial and ethnic groups represent more than half of the 20- to 29-year-old population, these diverse young adults are already contributing significantly to the nation’s consumer base, tax base, and voting populations in all parts of the country.

Moreover, census population projections taken in 2022 showed that regardless of immigration levels going forward, diversity will continue to rise, especially among our younger populations, so that in 2030, the nonwhite population will comprise more than half of the nation’s under-35 population. Those projections establish that even with absolutely zero immigration, the 2030 census could show that minority populations comprise 50.3% of the under-35 population, and even larger shares with moderate or high levels of immigration (see Figure 8).
One more issue that is important to address is the rise of the multiracial population. While much popular discussion and political rhetoric tries to emphasize cultural divides between the nation’s white population and racial minorities, evidence shows that this “divide” is blurring. As I discuss in my book, “Diversity Explosion,” the blurring is evident with the rise in multiracial marriages and multiracial identities. In fact, a significant part of the “two or more races” category discussed above involves children of multiracial marriages in which one spouse is white, in addition to other individuals taking pride in their mixed white and other race heritage. Already using the recent estimates, it is possible to see now the “white and some other” race population rising in younger age groups—a phenomenon that will surely continue.
All of this is to say, as I have before, that the addition of new and growing race and ethnic groups via immigration or natural increase is a demographic boon to America’s population and economy. It will increase the size of our young adult and eventually middle-aged adult population as Gen X and baby boomer members continue to age. They will help to support that older population via Medicare, Social Security, and other means, and add to the prosperity of an increasingly multiracial, multicultural America that will help us connect with a global economy.
Author

-
Footnotes
- The new Census Bureau estimates for race and age for the nation, states, and counties released June 25, 2026 for the period 2020 to 2025 are known as “vintage 2025 estimates” and should be used in place of earlier estimates for this period.
The Brookings Institution is committed to quality, independence, and impact.
We are supported by a diverse array of funders. In line with our values and policies, each Brookings publication represents the sole views of its author(s).