
Immigration has become one of the nation’s most contentious political issues. Yet there has been less public attention paid to broader immigration policy than to sensational characterizations of open borders, illegal immigrants, and negative stereotypes about immigrants’ country of origin, race, or ethnicity. Beyond these political rants, there is little discussion about what immigration means for the changing demography of the nation relevant to its future growth, especially amid a continued trajectory of lower fertility and—because of the aging population—more deaths.
The Census Bureau’s new nationwide population projections allow for an assessment of immigration’s role for the future of the U.S. population. More so than the previously released 2017-based projections, the new data shows generally lower future population growth due to updated assumptions of fertility, mortality, and immigration from abroad. And they make even more apparent the strong role immigration will play in contributing to the future growth or decline of the population. This is because the projections—looking at the period from 2022 to 2100—are presented under four different immigration scenarios, ranging from zero immigration to high immigration.
As the discussion below reveals, in a future of decreasing births and increasing deaths across an already aging population, immigration levels are crucial in leading to national growth as opposed to decline, and countering what would otherwise be extreme aging. Yet counter to widespread claims, immigration is not primarily responsible for making the nation more racially and ethnically diverse, as the U.S. population will become less white even under scenarios of low or zero future immigration.
Immigration will make the difference between future population growth or decline
The new census projections examine immigration’s impact on future national growth by assuming four scenarios over the 2022-2100 period based on different annual levels of net immigration (i.e., in-migration minus out-migration to the U.S.).
One scenario is the “main” immigration scenario—the one most consistent with recent history, apart from the immediate pre- and post-pandemic years. This assumes annual net immigration levels between 850,000 and 980,000 people.
Another is the “high” immigration scenario, which assumes a consistent annual net immigration of roughly 1.5 million people per year—a level only occasionally approached in the recent past. The “low” immigration scenario assumes a trajectory of between 350,000 and 600,000 net migrants annually, which occurred during the latter years of the Trump presidency, though still higher than during the pandemic.
Finally, there is the “zero” immigration scenario, which assumes a modest negative annual net immigration resulting from some out-migration and no in-migration. While zero immigration is not likely to occur in the future, this scenario provides a benchmark to show future population changes due primarily to the forces of fertility and mortality.
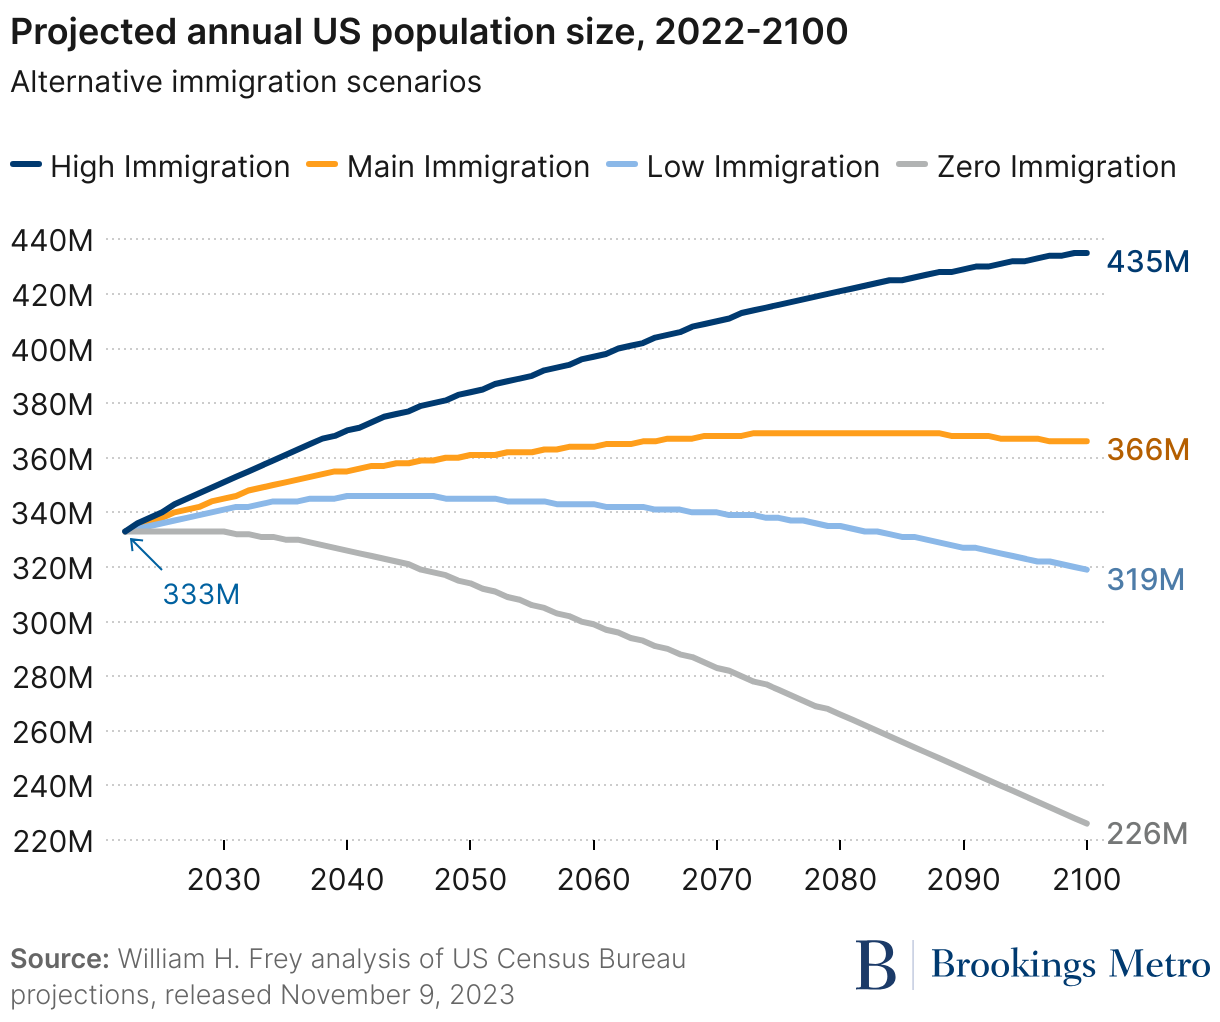
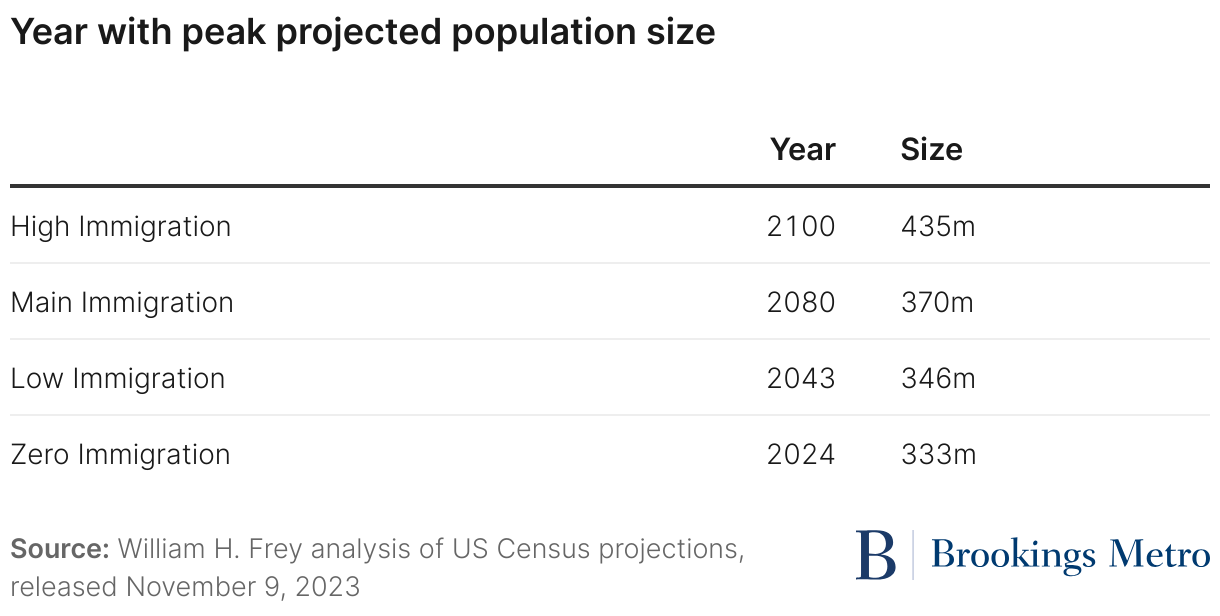
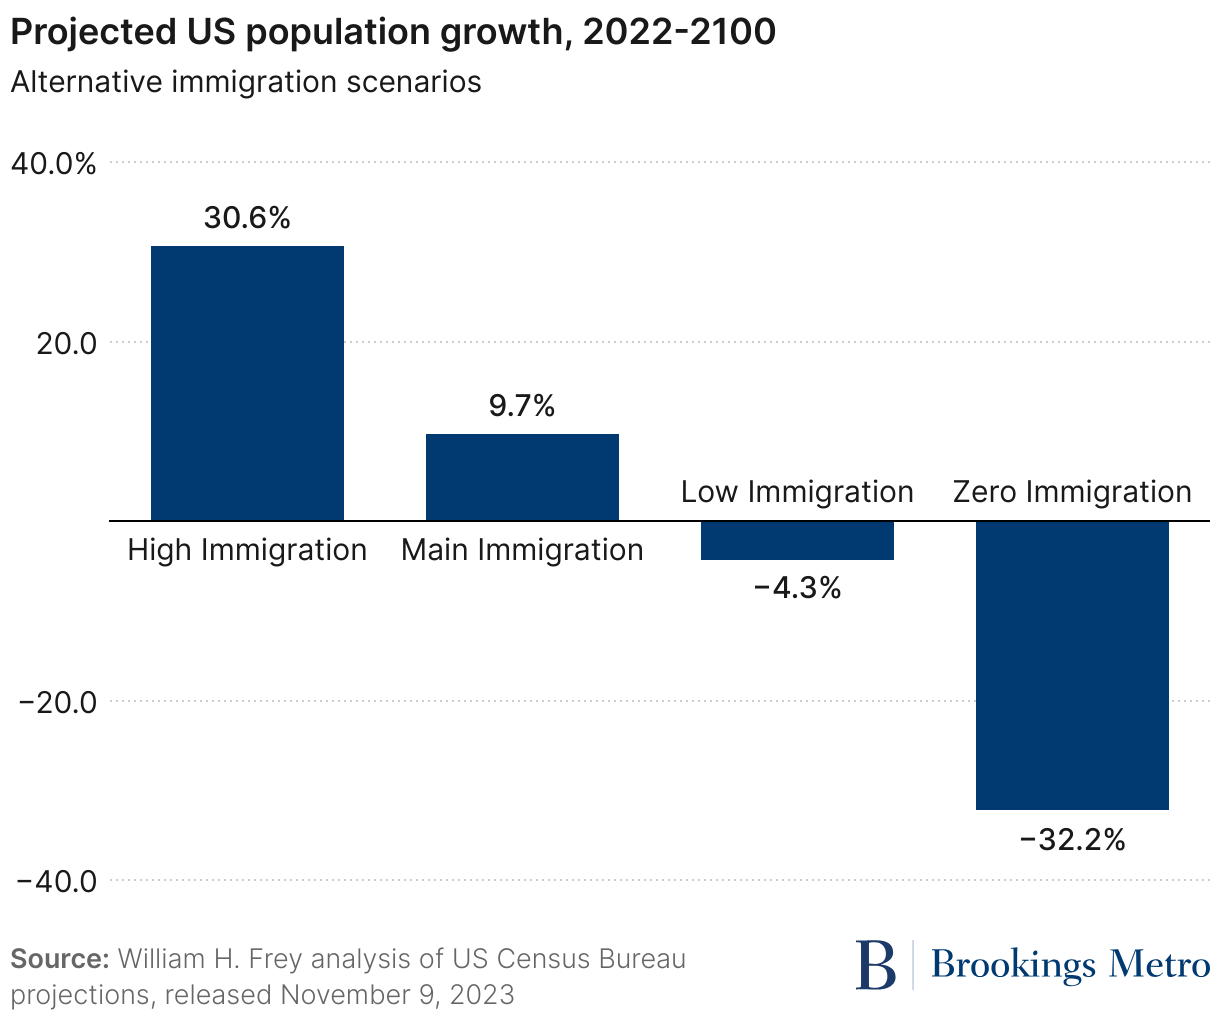
Figure 1 shows the wide range of U.S. population change outcomes that would occur across the scenarios, each beginning with a 2022 population of 333 million. By the year 2100, the population would be 435 million in the high immigration scenario; 366 million in the main scenario; 319 million in the low scenario; and a mere 226 million in the zero immigration scenario. The population growth rates of each scenario would be +30.6%, +9.7%, -4.3%, and -32.2%, respectively.
The population decline in the zero immigration scenario is especially significant, as it shows that in the absence of any immigration, there would be a continued annual population loss every year between 2024 and 2100.1
The other scenarios also point to immigration’s impact on growth. Even the main scenario shows the U.S. population will peak in 2080 and decline thereafter. In the low immigration scenario, that peak would occur in 2043—just 20 years from now—and then begin a decline to below the 2022 population of 333 million. Only the high immigration scenario leads to population increases during each year of the projection.
Another way to understand the magnitude of the projected growth patterns is to compare them with those of recent decades. Figure 3 depicts U.S. growth by decade between 1950-60 until 2010-20, along with decade projections though 2090-2100 using the main immigration scenario.
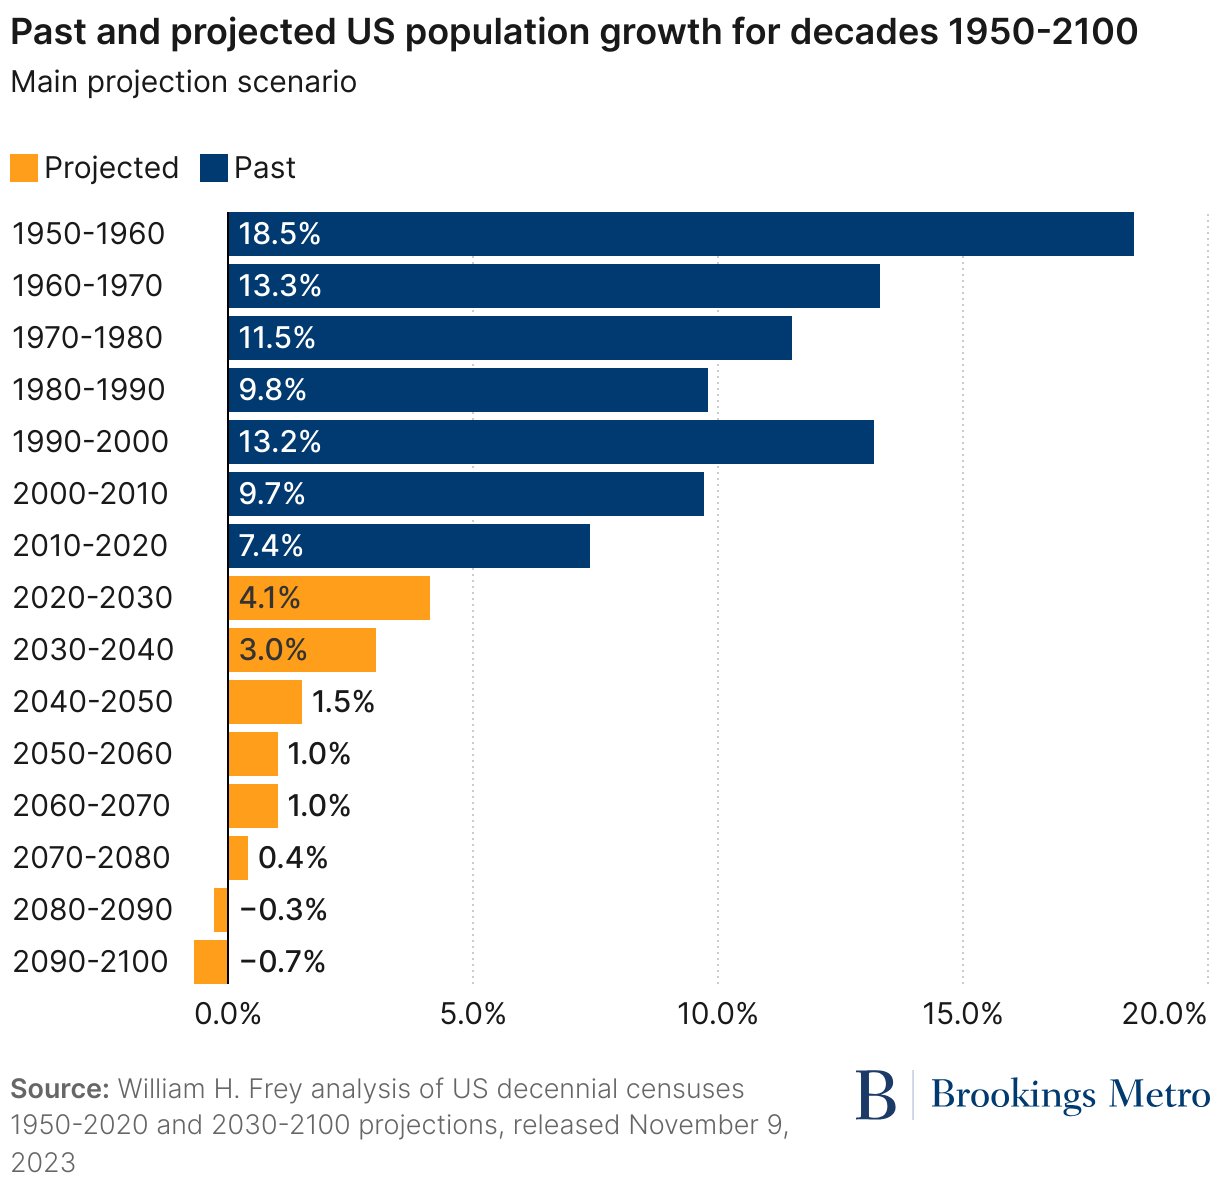
Under this scenario, each of the post-2020 decades shows considerably lower growth than any decade in the recent or long-term history of the nation—with growth during the next two decades at 4.1% and 3%, and no higher than 1.5% after 2040. Under the high immigration scenario, the next three decades would see growth rates of 6%, 5.3%, and 3.8%. And under the low immigration scenario, the nation would experience negative decade-long growth starting with 2040.
Immigration will slow the future aging of America’s population
The results of the 2020 census showed a 2010-20 decade-long decline in the nation’s under-18 (youth) population, and a baby-boomer-fueled gain in its 65-and-older (senior) population, which called attention to the aging of the U.S. population. The new projections place an exclamation point on this. Each of the immigration scenarios except the “high” one shows declines in the nation’s youth population during every year of the projection period. Moreover, the years in which the number of seniors supersedes the number of youths occur before 2030 in all scenarios.
Because immigrants and their children are, on the whole, younger than the rest of the population, aging will occur more slowly as immigration levels rise. While seniors’ population share rises above the 2022 level of 17.3% in all scenarios, it reaches its highest 2100 level of 35.6% under the zero immigration scenario, compared to just 27.4% under the high immigration scenario.
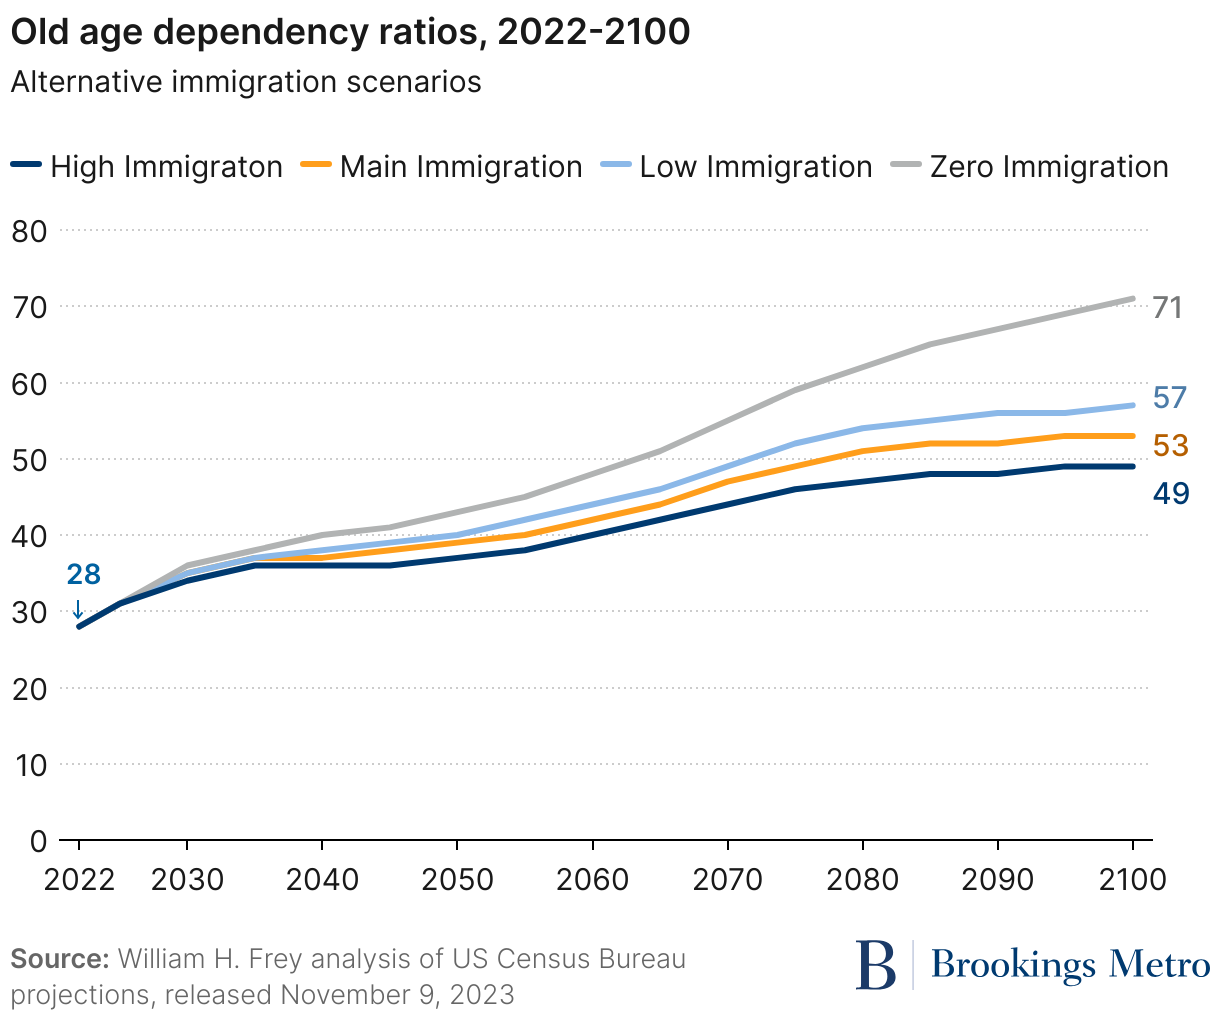
Another measure of aging relevant to policy concerns is the old age dependency ratio, which is defined as the senior population (age 65-plus) as a percent of the working-age population (ages 18 to 64). This reflects the extent to which the senior population represents a burden on the working-age population. (For example, a value of 33 means that there is one senior dependent on three working-age persons.)
In 2022, this ratio was 28. As shown in Figure 4, in the year 2100, the ratio ranges from 49 in the high immigration scenario to 71 in the zero immigration scenario.
The impact of immigration on aging can be seen in the relatively near term by assessing how it impacts three key three age groups over the period from 2022 to 2035. This is a period when the last portion of the large baby boomer generation, along with early members of Gen X, enters the 65-plus population and exit the working-age population.
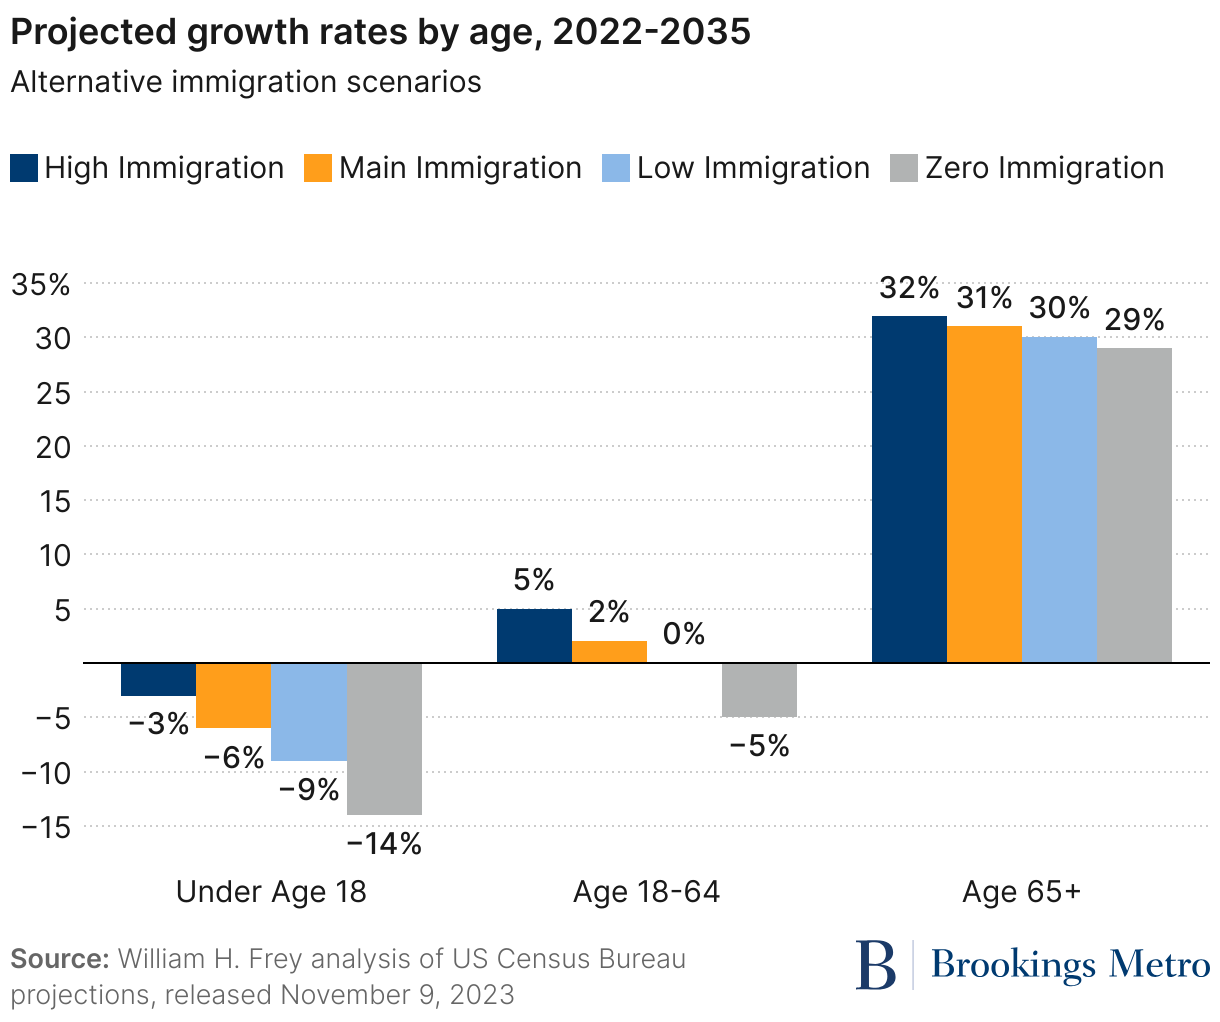
As shown in Figure 5, this leads to a high projected growth of seniors under all immigration scenarios, ranging from 29% to 32%. Yet the youth and especially working-age population change levels are more dependent on immigration. Although the youth population declines under all scenarios, its level of decline during this period is far larger under the low and zero immigration scenarios (-9% and -14%, respectively) than the main and high scenarios (-6% and -3%, respectively).
More significantly, short-term immigration makes a difference between the growth or decline in the working-age population. Here, both the high and main immigration scenarios show positive growth of 18- to 64-year-olds (5% and 2%, respectively) compared with zero or negative growth under the low and zero immigration scenarios. Clearly, even in the next decade, immigration will have an impact on the size of nation’s labor force.
The nation will become more diverse regardless of immigration levels
While much attention politically and otherwise has been given the racial diversity of immigrants and their contribution to making America “less white,” the new census projections make clear that the nation will become more racially and ethnically diverse regardless of immigration levels.
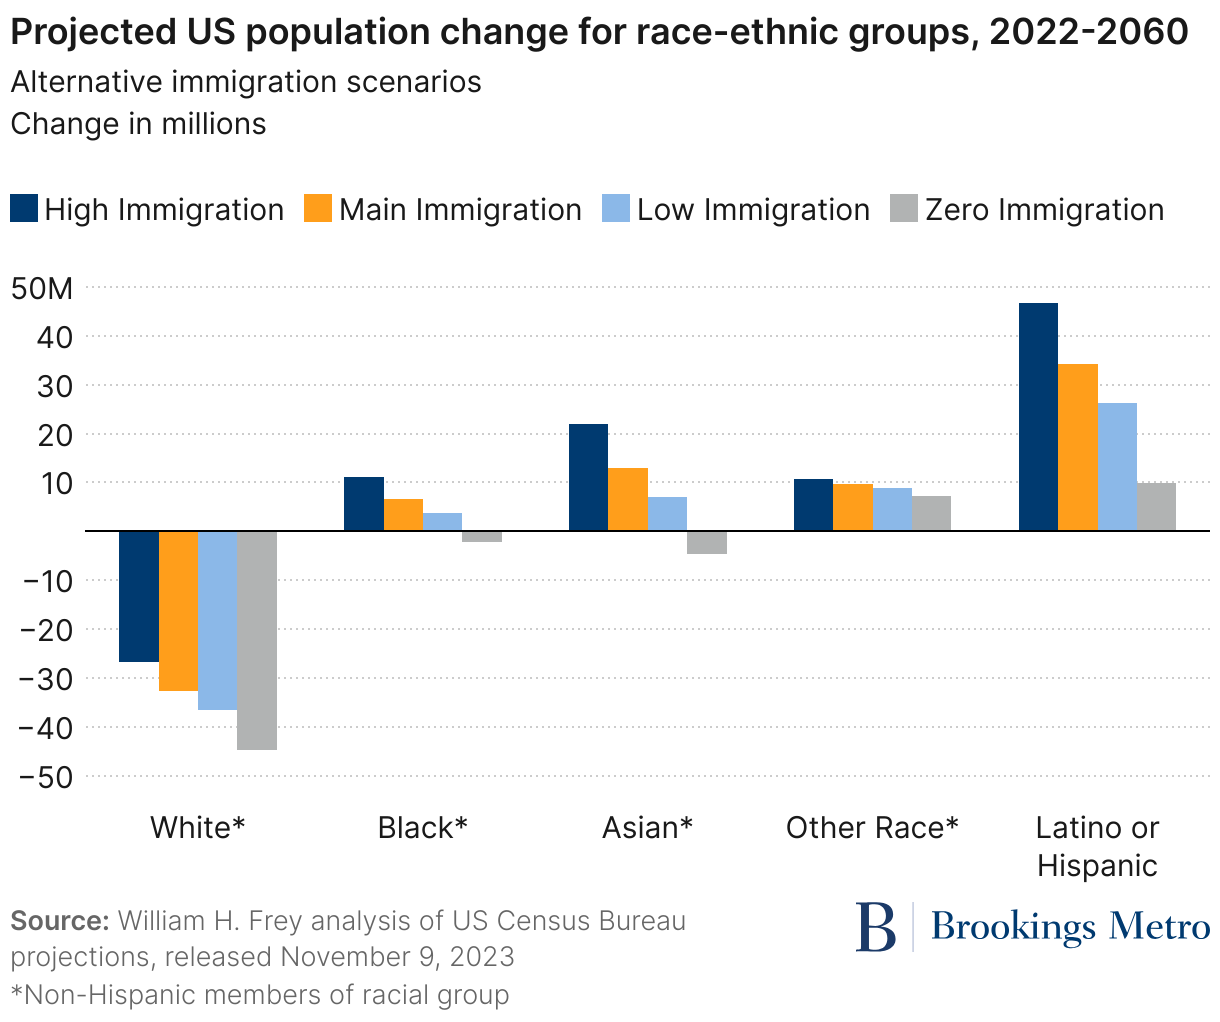
Figure 6 shows that over the entire projection period through 2060, white persons who do not identify as other racial or ethnic groups will see declines in their population under all immigration scenarios.2 This is due to their older age structure, leading to what demographers call “natural decrease” (the excess of deaths over births), which overtakes their gains via immigration. Under all immigration scenarios, the nation’s white population declines each year.
Thus, all population gains are attributable to persons who identify as other racial groups, including persons who identify as two or more races.3 Of these groups, Latino or Hispanic Americans are projected to show the largest gains under each immigration scenario. While Latino or Hispanic Americans are projected to assume sizeable portions of future immigrant flows, their large share of the U.S. resident population at the beginning of the projection period (19%) ensures that their natural increase will contribute to future population gains even under the low and zero immigration scenarios.
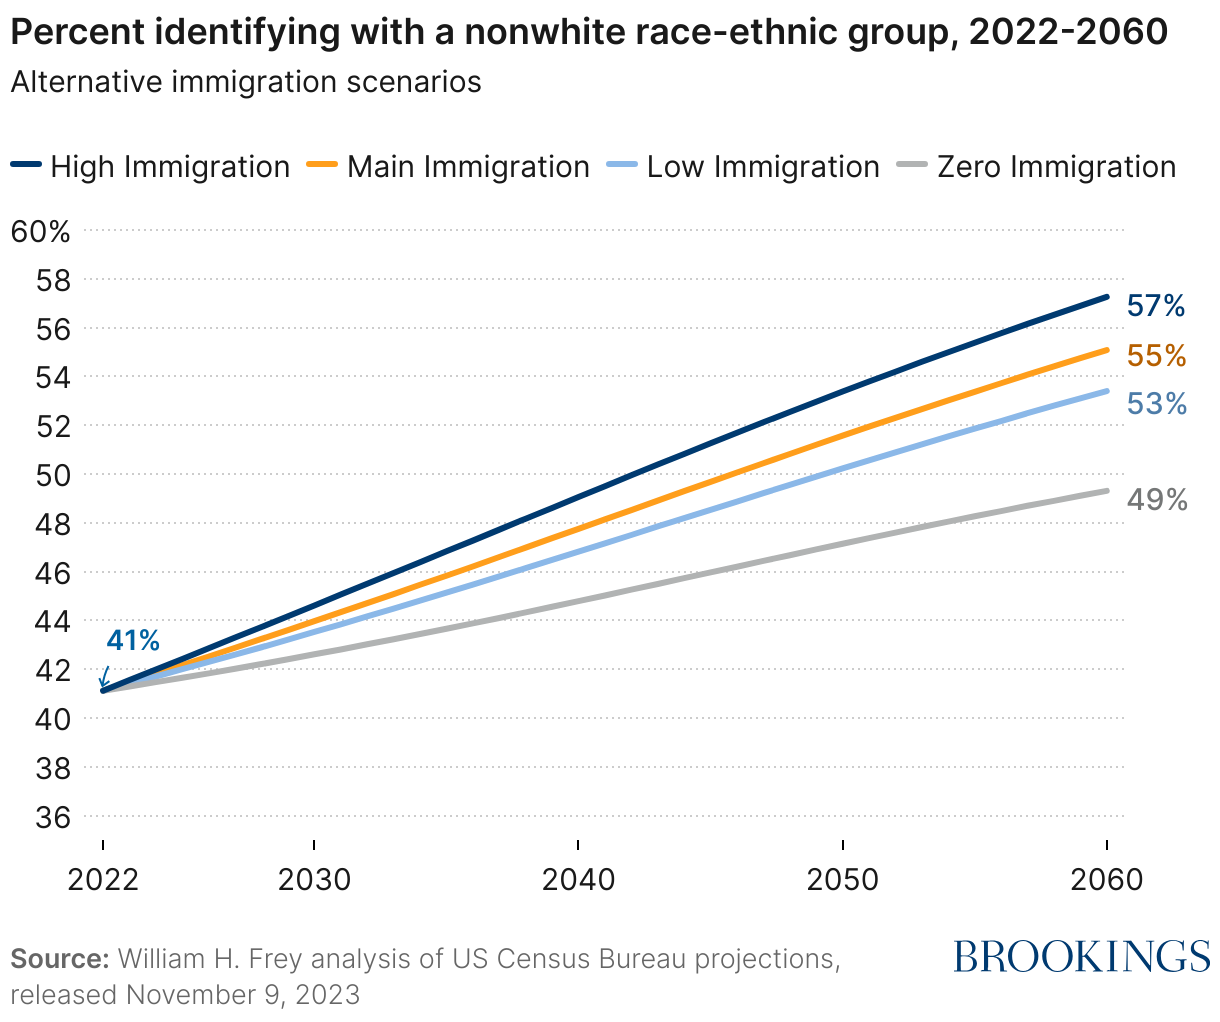
Because of these dynamics, under each immigration scenario, the U.S. will experience a rise in the share of the total population that identifies as a nonwhite racial or ethnic group, above its 2022 level of 41% (see Figure 7). By 2060, that share will grow to 57% in the high immigration scenario, 55% in the main scenario, 53% in the low scenario, and 49% in the zero immigration scenario.
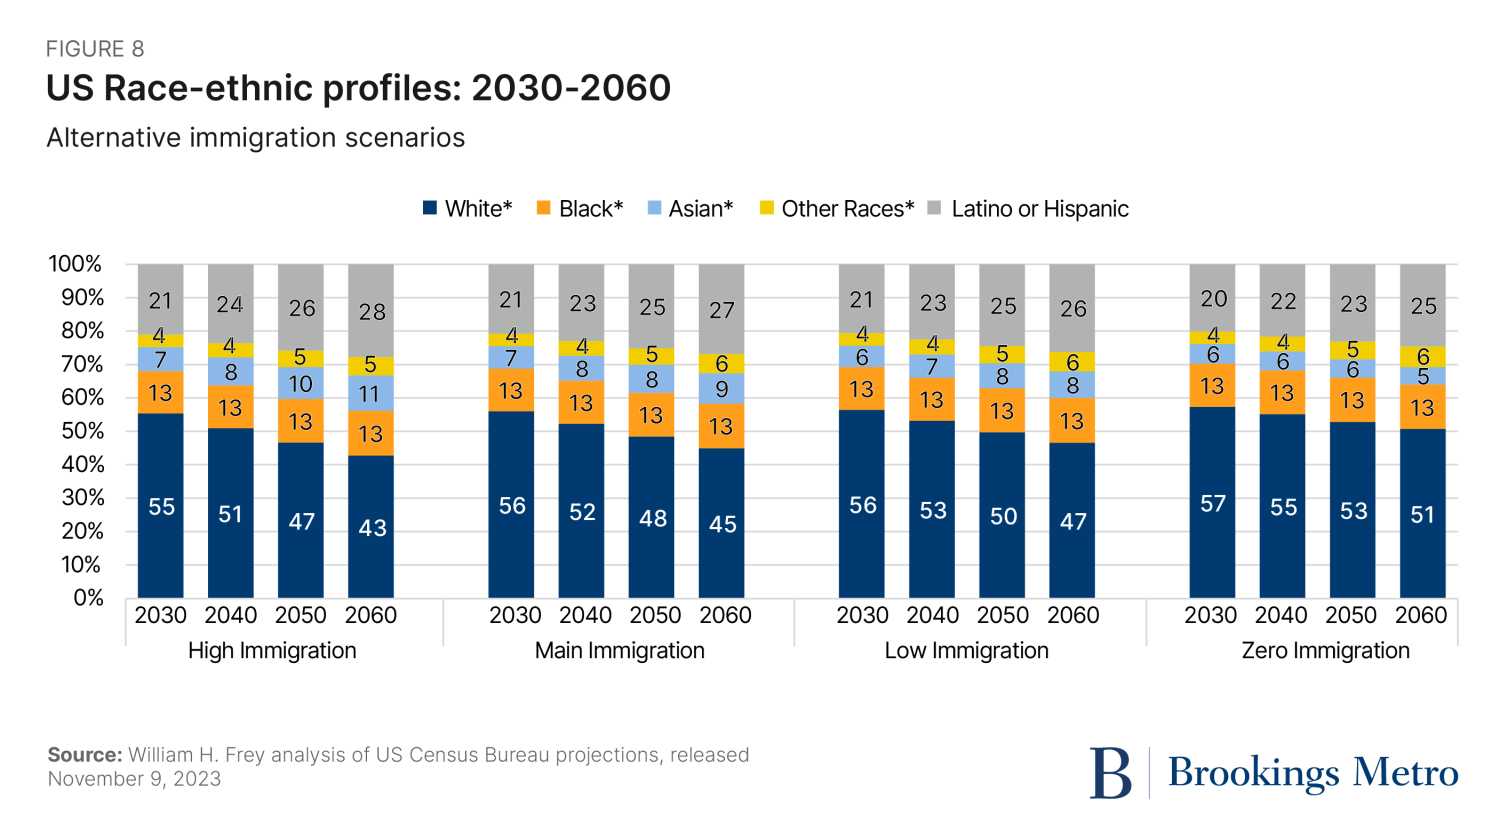
The racial profiles under each scenario from 2030 to 2060, displayed in Figure 8, show these changes in greater detail. By 2040, the white population comprises no greater than 55% of the total population under all immigration scenarios. And by 2050, the high, main, and low scenario populations are comprised of minority populations by at least half, with a quarter or more identifying as Latino or Hispanic.
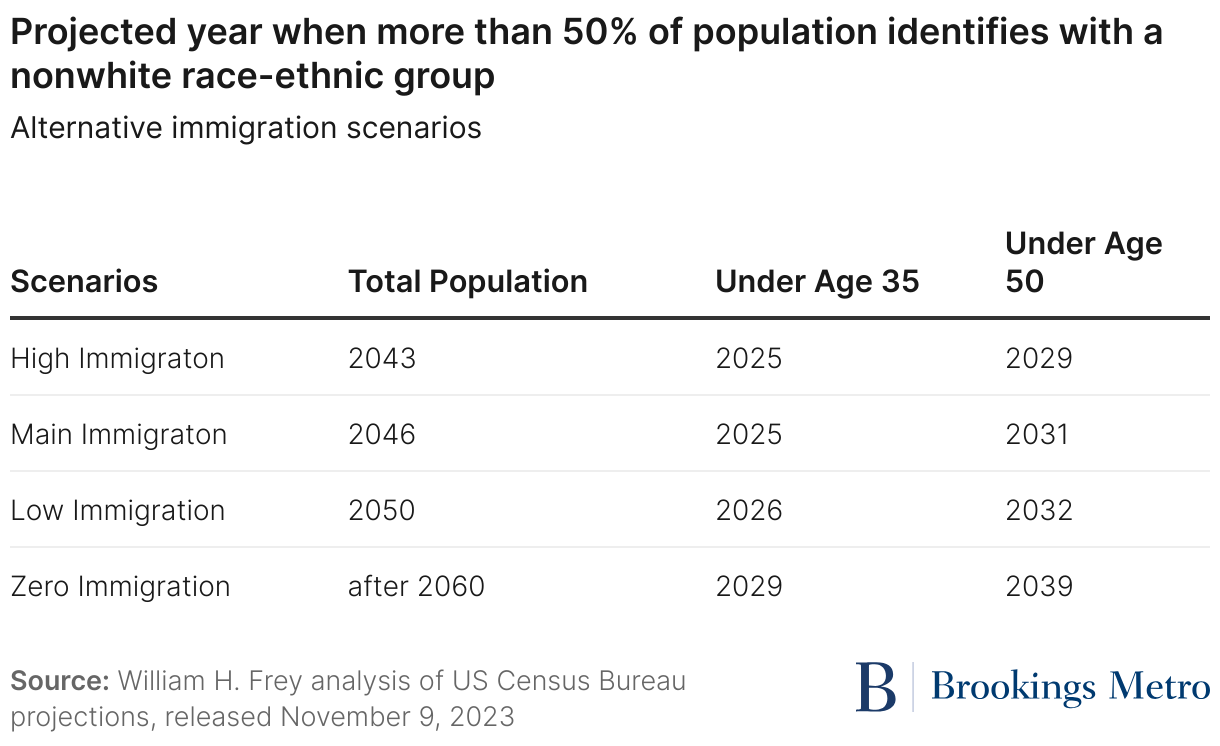
Table 1 shows the year in which the total population is projected to become comprised of minorities by half or more: 2043 in the high immigration scenario, 2046 in the main scenario, and 2050 in the low scenario. As noted above, the zero immigration scenario comes close in 2060—the end date for the census race projections, which again confirms an increase in the nation’s diversity regardless of immigration.
Diversity shifts from younger populations to older ones
The rising racial and ethnic diversity in the U.S. is already most apparent among the youngest Americans, whose population share became “minority white” with the 2020 census. Already in 2022, people identifying as Latino or Hispanic, a race other than white, or two or more races comprise 51% of the under-18 population.
There are a few reasons why the younger population becomes more diverse first. One is that the white population has an older age structure and is less represented in younger age groups due to the number of births; and for most younger age groups, fewer white persons “age into” the group than age out of it, to an older age category. Already in the 2010-20 decade, there was a decline in white Americans among all ages under age 55.
Second, most other racial and ethnic groups have younger age distributions, including proportionately more women in their childbearing ages. Finally, immigration contributes to the younger population’s diversity, although as shown earlier, the nation’s youth will become more diverse before its older population even without immigration.
This is depicted in Table 1 (above), which shows that under each immigration scenario, minorities become more dominant shares of the population for younger ages (under 35) sooner than for older ages (under age 50). This is also apparent in the more detailed age profiles displayed in Figure 9 for the main immigration scenario projection.
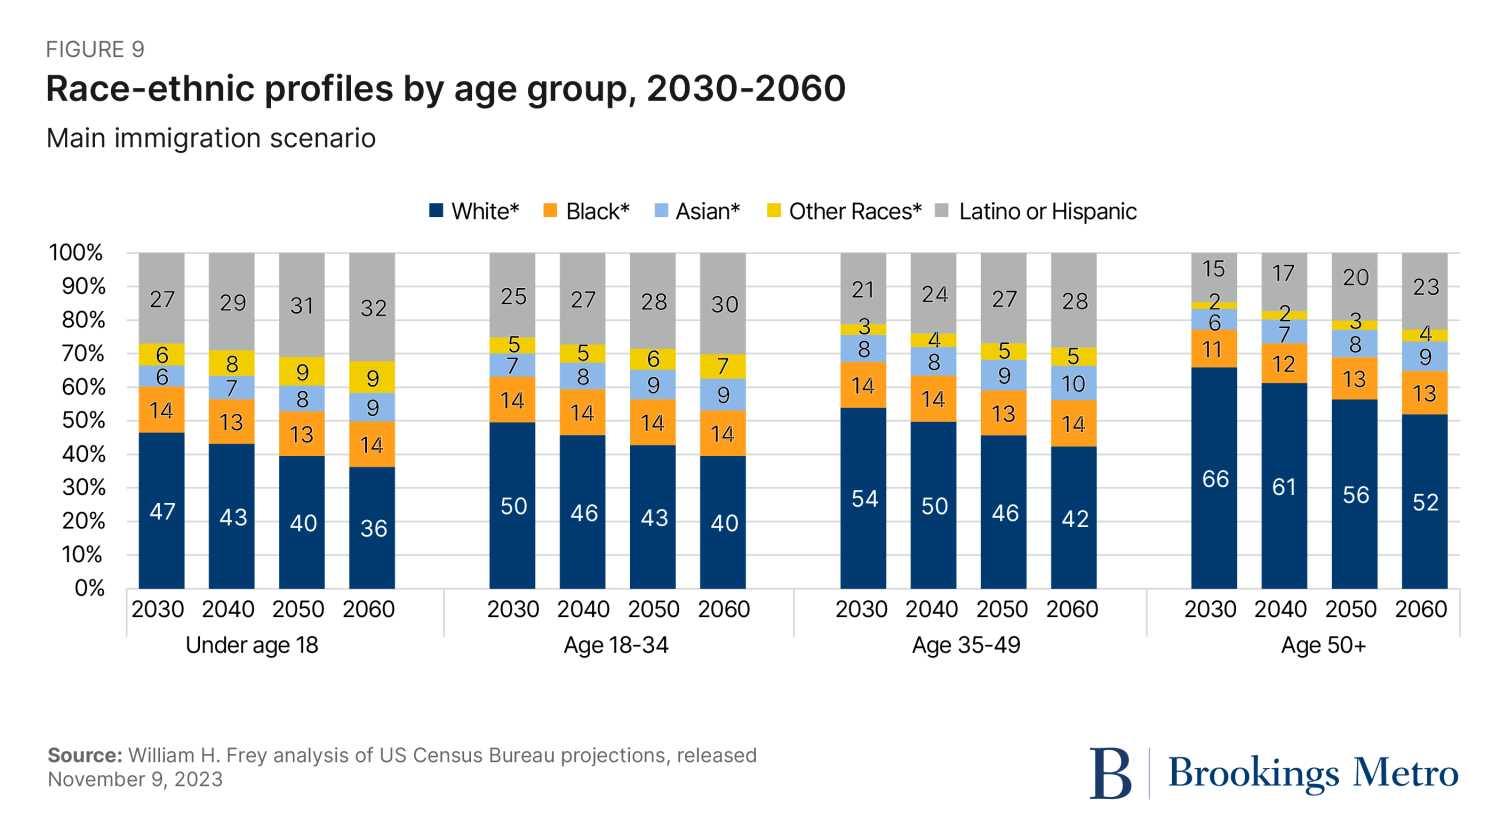
While each age group becomes more diverse over time, the younger age groups always stay ahead. For example, in 2030, the white share of the under-18 population is projected to be lower than that of the 18 to 34, 35 to 49, and 50-plus age groups (47% versus 50%, 54%, and 66%, respectively). And while each age group becomes more diverse over time, the younger age group is still less white than other age groups in 2060 (36% versus 40%, 42%, and 52%, respectively).
When viewed alongside the fact that there is a projected decline in the youth population far into the future, this “bottom-up” diversification means more attention needs to be paid to minorities in an array of institutions that prepare young people to be productive members of the labor force and citizenry.
The demographic importance of immigration to the US
The new Census Bureau projections are essential for any discussion of U.S immigration. While they do not address policy issues about various parts of our immigration programs, they make plain how vital continued international migration to the U.S. is for the nation’s growth and ability to support its aging population. Even with average immigration levels, the nation’s population will experience decade-wide growth levels far below any we have sustained in our history due to reduced fertility and increases in deaths in an aging population. Because immigrants and their children on the whole are younger than the rest of the U.S. population, they will help counter the decline and slow growth of America’s youth and working-age populations over future decades as our senior population continues to swell.
The new projections also make clear that, going forward, any curtailment of immigration will not reverse the increased racial and ethnic diversity we have begun to experience. The United States will become considerably more diverse even under a hypothetical “zero immigration” scenario. What immigration will do, especially in the short run, is increase the racial and ethnic make-up of our youth population as it helps to counter losses in their ranks.
Although the U.S. faces population growth and aging challenges in the decades ahead, we are still in a better position than many other developed countries such as Japan, Italy, Germany, and other European nations—due in large part to the healthy immigration levels we experienced over the past 30 to 40 years. While immigration remains a hot-button political issue that focuses on illegal immigrants and asylum seekers, it is crucial to move the discussion to a serious analysis of the importance of immigration for the nation’s demographic and economic growth, and how broad policies such as comprehensive immigration reform can address our future needs. The new census projections should play a central role in those discussions.
Author

-
Footnotes
- These new projections show an even greater population decline under a zero immigration scenario than the previous projections released in 2017. In those projections, which ended in 2060, the zero immigration scenario yielded a 2060 population of 320 million, compared to the current 2060 projection of 299 million. The former represented a population decline of 3%, while the latter represents a decline of 10%.
- The newly released projections by race-ethnicity pertain to the 2022 to 2060 period.
- Projecting Americans’ future racial identities over this period is less precise than age projections due to changing interracial marriage and birth patterns as well shifts in self-identification. However, the broad trends shown here make clear that future immigration is neither the only, nor the main, reason the United States will continue to become more diverse.
The Brookings Institution is committed to quality, independence, and impact.
We are supported by a diverse array of funders. In line with our values and policies, each Brookings publication represents the sole views of its author(s).


