When finance ministers gather in Washington D.C. for the International Monetary Fund (IMF)/World Bank Spring Meetings in April, a major agenda item will be funding for the International Development Association (IDA), the arm of the World Bank that gives grants and credits to the world’s poorest, most fragile, and most vulnerable countries.
All potential donors are under fiscal stress. As others have noted at the Center for Global Development (CGD), nearly a dozen major development funds, such as the World Bank’s IDA, thematic funds like Gavi, and new entities like the Loss and Damage Fund, could aim to raise over $100 billion in donor contributions in the coming two years. So, there is significant competition for funding for good causes.
Why should donors give more money to IDA?
The simple answer: Investing in development can work when it is done properly, as is the case in IDA-supervised projects.
The case for a larger IDA rests on two propositions. First, that IDA projects will generate tangible development results for people in the recipient country. Second, that IDA is one of the most effective channels through which aid can flow, and so should be scaled up compared to other aid distribution channels, including bilateral aid programs.
The return on IDA projects
We looked at 1,604 investment projects closed by IDA between 1963 and 2011. (After 2011, the World Bank moved to a categorical scale for evaluating projects.) For all these projects, the World Bank evaluation group provides an estimate of the economic rate of return at completion—that is, after accounting for all the delays, difficulties, and cost overruns that bedevil a typical investment in a developing country. Four-fifths of projects are in three sectors: about half in agriculture and rural development, 20% in transport, and 10% in energy and mining.
Figure 1. Rates of return on IDA projects, 1963-2011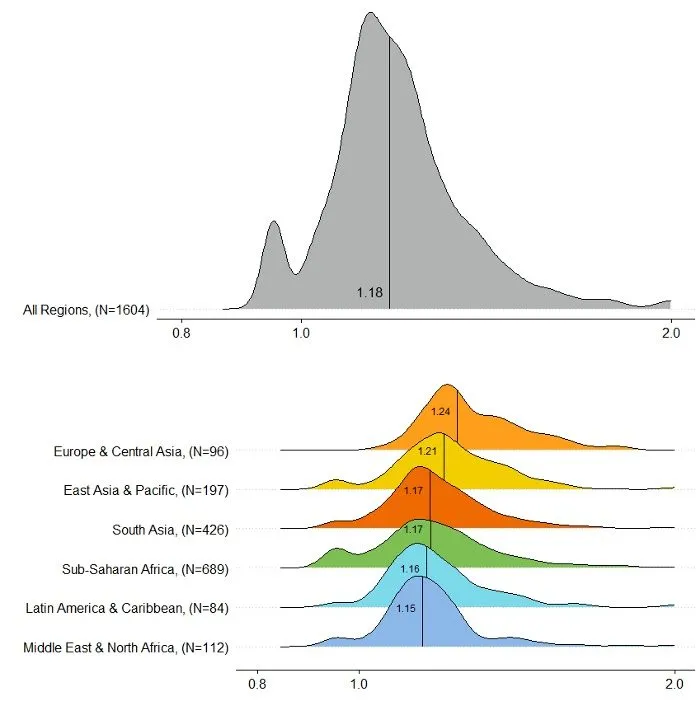
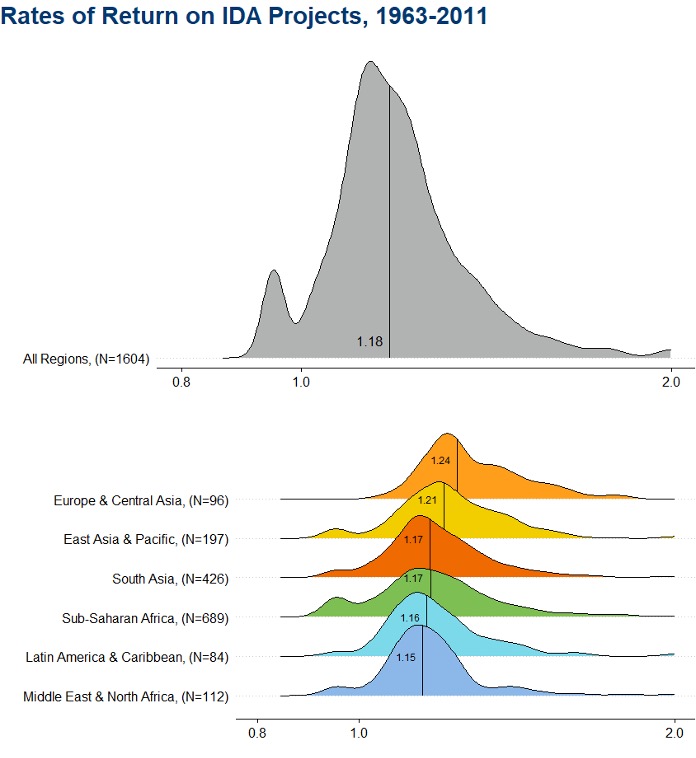
Source: IEG World Bank Project Performance Ratings – Archived
The figure shows how many projects (measured on the y-axis) have a rate of return with the value shown on the x-axis. To ease the visualization on a logarithmic scale, the x-axis represents (1 + the rate of return), where a value of 1 indicates a zero return on the project investment, and values less than 1 imply negative returns—the project benefits do not cover the costs. The vertical line shows the median return for the projects in the sample. The results are striking. The median IDA investment project has yielded a return of 18% and the mean is even higher at 22%. True, some projects have failed—about 6.6% of projects have had negative returns, but an overwhelming majority are successful. Seventy-seven percent of projects had a return greater than 10%, a common threshold for evaluating development projects.
The figure also shows the distribution of project returns by geography. There are differences across regions, but none are statistically significant. Importantly for IDA, that now allocates three-quarters of its resources to Africa, the success rate of its projects in Africa is no different from its overall success rates. A median return of 17%, a mean of 21%, 10% of projects with negative returns, and 71% with returns greater than 10%.
Apart from evaluating the results by geography (shown above), we also did sensitivity tests to see whether other criteria affected IDA’s success rate. Income levels (low versus lower middle-income) do not matter. Creditworthiness (a proxy for institutional strength and macroeconomic management) does not matter. Fragility does not matter. Time does matter—IDA projects approved after 2000 have higher returns than those approved before (but even earlier projects had a high degree of success—a median return of 16%).
These numbers do not tell the whole story. IDA only calculates rates of return on about a quarter of its projects, so selection bias cannot be ruled out. It may also be that governments select the best projects for IDA funding, which they would anyway have undertaken. In that case, IDA should be evaluating the return on a marginal public investment project to understand its true impact.
These issues arise in the evaluation of every development program. There is, however, corroborating evidence to suggest that IDA adds value through its staff expertise as well as through its concessional funding. One earlier study showed more variation in project outcomes within countries than between countries and linked this to the quality of the task team leader of the project (Denizer, Kaufmann, Kraay, 2013). This may also explain why IDA projects were successful even when other aid-funded development projects were not—the debt crisis leading to the Heavily Indebted Poor Countries initiative is a reminder that all government spending was not necessarily invested and yielding high returns.
Why choose IDA over other ODA channels?
Any development institution must demonstrate its comparative advantage as well the outcomes of its own activities. This is not an easy task. Official comparisons are discouraged. Although very positive in their review of IDA and the World Bank more generally, members of the Multilateral Organization Performance Assessment Network (MOPAN) expressly caution against comparisons because of the “scale, operating context, and comparative advantage of different organisations.” Think tanks are more prepared to take political flak by ranking organizations. Three prior assessments of the quality of official development assistance (QuODA) consistently found IDA to be among the best-rated organizations at delivering official development assistance (ODA). Using a different methodology, QuODA 2021 ranks IDA as the third-best organization.
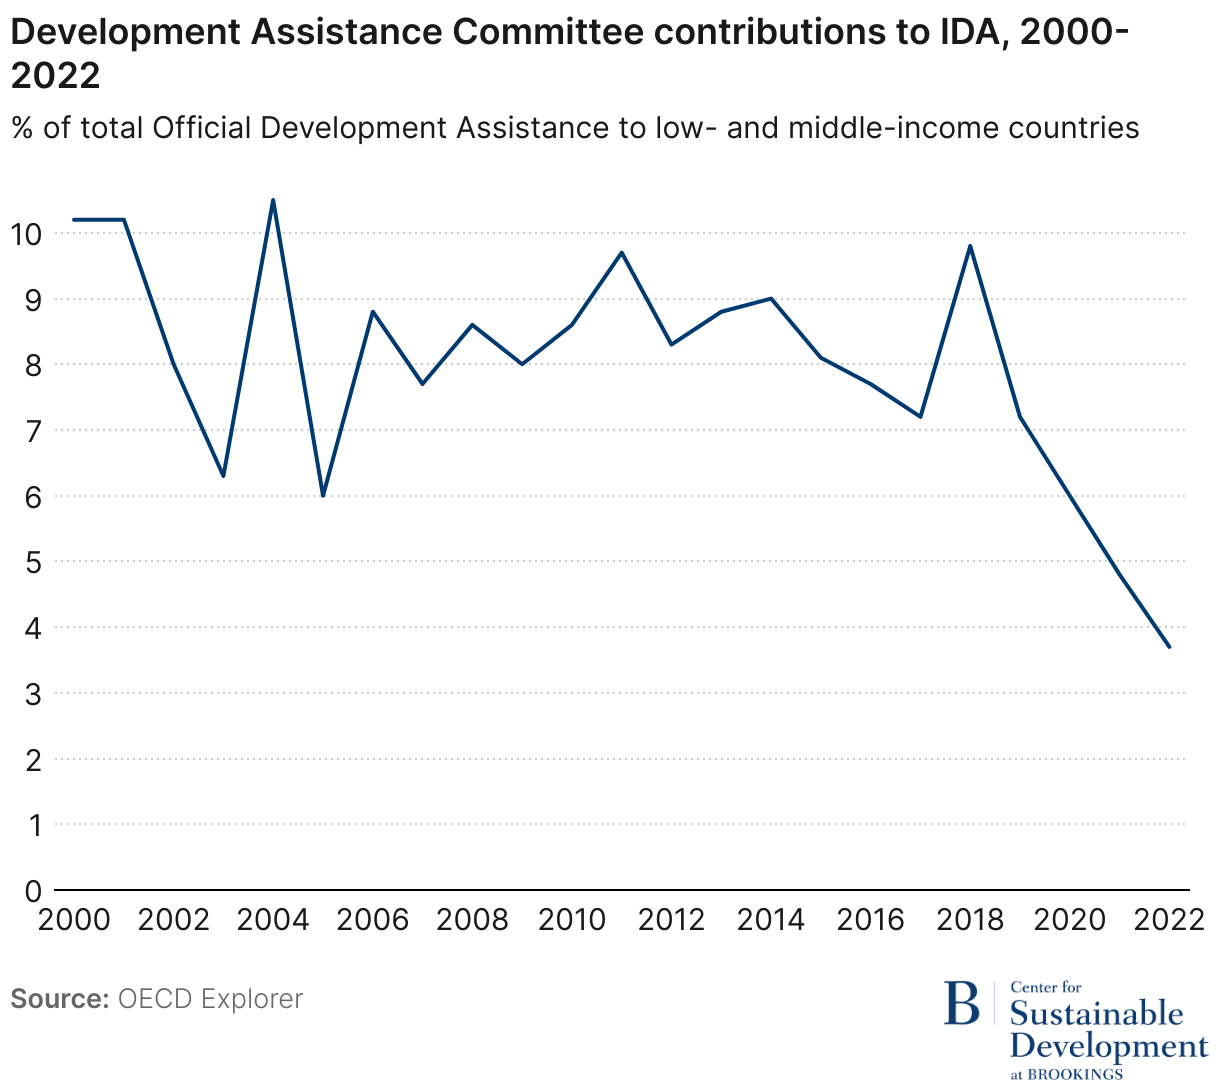
It is therefore disappointing to see that donors have systematically moved ODA away from IDA in recent years (Figure 2). While IDA used to receive about 10% of the ODA of donor countries in the early 2000s, it received less than 4% in the latest year for which data is available, 2022.
It’s always difficult to raise budgets for one line item when resources are scarce. There is no denying that ODA resources are stretched very thin. But it is precisely at times of scarce resources that allocations should be based on effectiveness. Few other aid agencies, especially bilateral agencies, could generate the returns that IDA has consistently done over the years.
Authors


Related Content


The Brookings Institution is committed to quality, independence, and impact.
We are supported by a diverse array of funders. In line with our values and policies, each Brookings publication represents the sole views of its author(s).


Commentary
Investing in development works
April 2, 2024