
The latest Census Bureau statistics show that a continued uptick in immigration is the main driver of the modest U.S. population growth rate, as the nation attempts to rebound from the historic lows of the COVID-19 pandemic period.
These population estimates (through the period ending July 2023) reveal a small gain in the nation’s growth rate, to 0.49% for 2022-23—up from 0.37% in 2021-22 and the near flatline growth of 0.16% in the prime pandemic year, 2020-21. As was the case in the previous year, a renewed high level of immigration was the main growth booster, though there was also an increase in the contribution of natural increase (the sum of births minus deaths) due to a noticeable decline in the number of deaths, though still higher than in pre-pandemic years.
The demographic “cushions” of net international migration and somewhat higher natural increase benefited most parts of the country. Still, domestic migration within the U.S. can sharpen growth disparities between “gaining” and “losing” areas. While the new statistics show highly urbanized, populous states in the South continue as major gainers, their attraction for migrants appears to be softening somewhat compared with the peak pandemic years.
Overall, the nation is experiencing quite low demographic growth compared to its recent history. Although the pandemic’s impact since 2020 has been substantial, future projections show that the natural increase of America’s aging population will not likely rebound to the levels of prior decades, thus placing greater emphasis on immigration to bolster future population gains. The nation’s experience in this immediate post-pandemic period could very well be a window into its low-growth future.
Today’s low population growth in historical context
The recent growth nadir during the pandemic and slight uptick since is not totally unusual given the history of U.S. population growth. Economic shifts, wars, pandemics, fertility trends, and immigration have led to sharp ups and downs in national growth. To place the recent growth levels in perspective, it is useful to view annual rates of growth over the period from 1900 to 2023, based on a series of Census Bureau estimates (see Figure 1).1
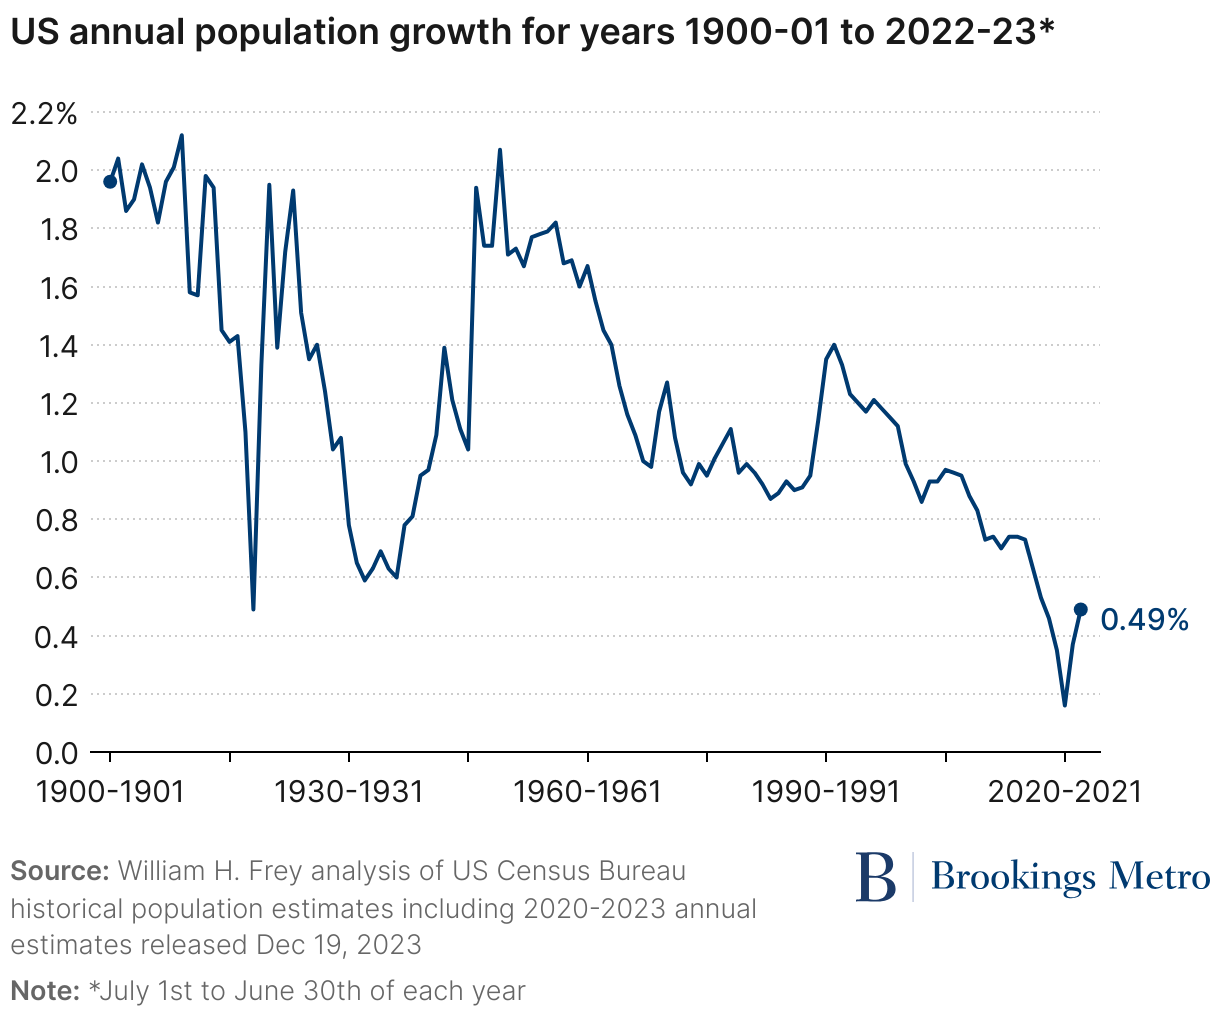
For much of this period, except for dips and swings, annual population growth ranged between 0.8% and 2%, with exceptions occurring during the 1918-19 Spanish flu pandemic and the Great Depression in the late 1920s and 1930s. The most recent upswings occurred during the 1946 to 1964 baby boom period and the rise in fertility and immigration during the 1990s, and to a lesser degree in the 2000 to 2010 decade.
Beginning with the 2007-09 Great Recession up to the mid-2010s, annual growth rates declined from 0.95% in 2007-08 down to 0.63% in 2016-17, as births fell due to many millennials putting off childbearing, and deaths rose as the population continued to age. Then, as immigration became reduced during the Trump administration, national growth hit 0.46% in 2018-19.
Thus, population growth was heading downward just before the COVID-19 pandemic, which hit in early 2020 and led to a sharp growth downturn to 0.16% in 2020-21—a year that saw a substantial increase in the number of deaths, fewer births, and much lower immigration.
Immigration remains a dominant new growth contributor
Figure 2 displays the relative roles of immigration and natural increase leading to the pandemic period growth nadir and recent uptick. Since 2000 (and years earlier), natural increase outpaced net international migration as the main contributor to population growth. This shifted as natural increase nosedived through the peak pandemic year of 2020-21, leaving immigration—while also declining—as the main contributor to national growth (see downloadable Table A).
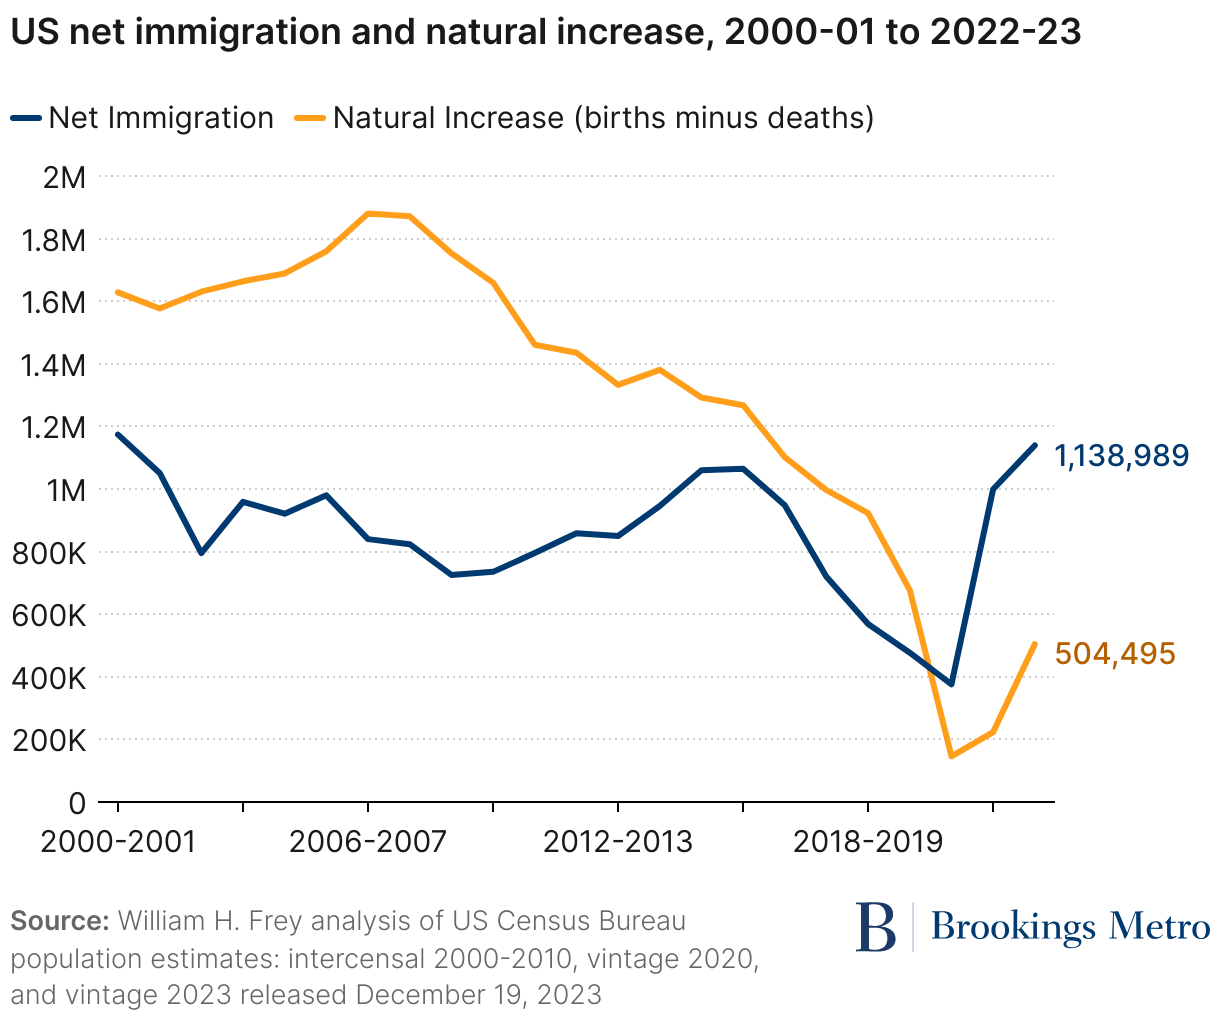
But it was the sharp rise in immigration over the past two years—from just 376,000 in 2020-21 to nearly 1 million in 2021-22 and 1.14 million in 2022-23—that became the major driver for the nation’s recent population gain. The easing of some pandemic fears and restrictions helped this gain, which contributed largely to rising growth levels of 0.37% in 2021-22 and to 0.49% in 2022-23. These translate into numeric gains of 1.2 million and 1.6 million people in these years, respectively, compared to just 522,000 in 2020-21.
While still low by historical standards, natural increase rose over the past two years. After adding only 146,000 to the population in the 2020-21, natural increase rose to 223,000 in 2021-22 and to 505,000 in 2022-23. A main contributor in the past year was a substantial decline in the number of deaths: There were 307,000 fewer deaths in 2022-23 than in 2021-2022.
Still, for each of the past two years, it was the rise in net international migration that propped up growth to modest levels. And unlike much of the nation’s recent history, immigration contributions now outpace those of natural increase.
Fewer states lost population in the past year
As the national population showed a modest growth rebound in 2022-23, fewer states experienced yearlong losses in their populations. During the pandemic years of 2020-21 and 2021-22, 17 and 19 states (including Washington, D.C.), respectively, lost population. This stands in contrast to the 14 that lost population over the 2018-19 pre-pandemic year, and no more than 10 in any single year earlier in the 2010 to 2020 decade.
In 2022-23, this number was reduced to just eight states. Moreover, 36 states either grew faster, declined less, or flipped from losses to gains. Among the latter were New Jersey, Ohio, Massachusetts, Maryland, Minnesota, and Michigan (see downloadable Table B).
Southern states continued to dominate the list of gainers both in terms of growth rates and numeric gains. South Carolina, Florida, and Texas led all states in growth rates, exceeding 1.6%. Eight of the top 10 fastest-growing states were in the South, with the exceptions being Idaho and Utah, which ranked fourth and ninth, respectively.
Among the biggest numeric gainers, Texas and Florida led all others with 2022-23 gains of 473,000 and 365,000, respectively. This is not surprising, as these states were ranked among the top three in net international migration and domestic migration gains, and Texas ranked first among states in natural increase. Further contributing to southern growth, the next five highest-gaining states were also located in the region: North Carolina, Georgia, South Carolina, and Tennessee.
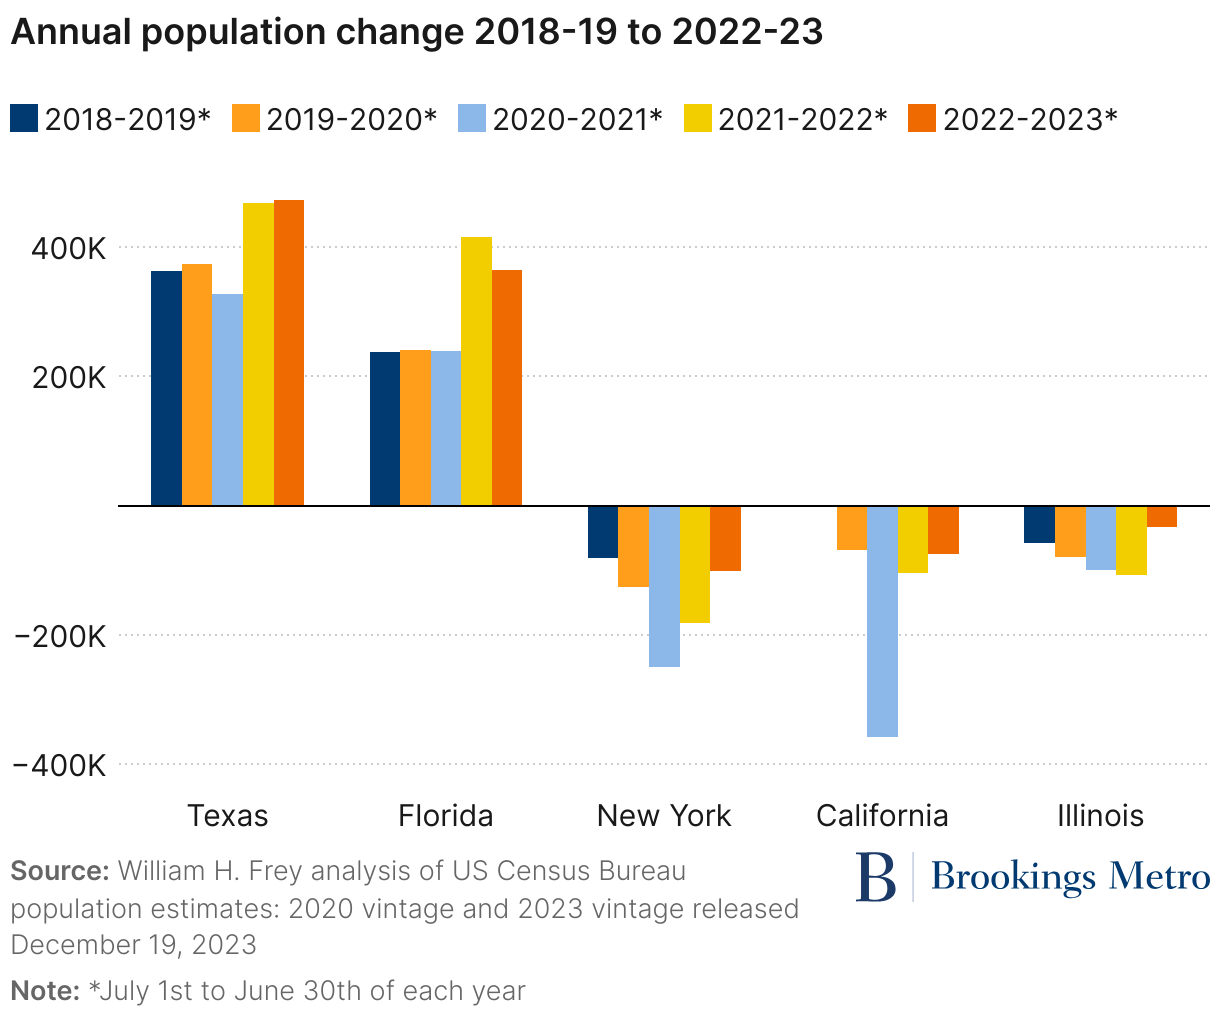
New York, California, and Illinois—three large, highly urbanized states—showed the greatest population losses in 2022-23 (see Figure 3). Yet it is noteworthy that each of these states—which bore much of the brunt of population losses during the peak pandemic years—showed smaller losses in the past year due to a combination of reduced domestic out-migration and high immigration from abroad, as well as gains in natural increase.
The rising population gains (or reduced losses) in most states have tended to somewhat disperse the division that evolved during the pandemic between growing and declining states and regions. While it is true that the South continues to be the big winner—accounting for 87% of the nation’s 2022-23 population gain—this differs from 2020-21, when southern gains represented 170% of the nation’s overall growth because each of the other regions sustained population losses. In 2022-23 large-gaining states such as Florida, Georgia, and Tennessee showed smaller gains than in the previous year, and all eight population-losing states—six of which are located outside the South—showed reduced declines. Some of this reflects shifts in domestic migration, to be discussed below.
Immigration and natural increase bolstered state gains
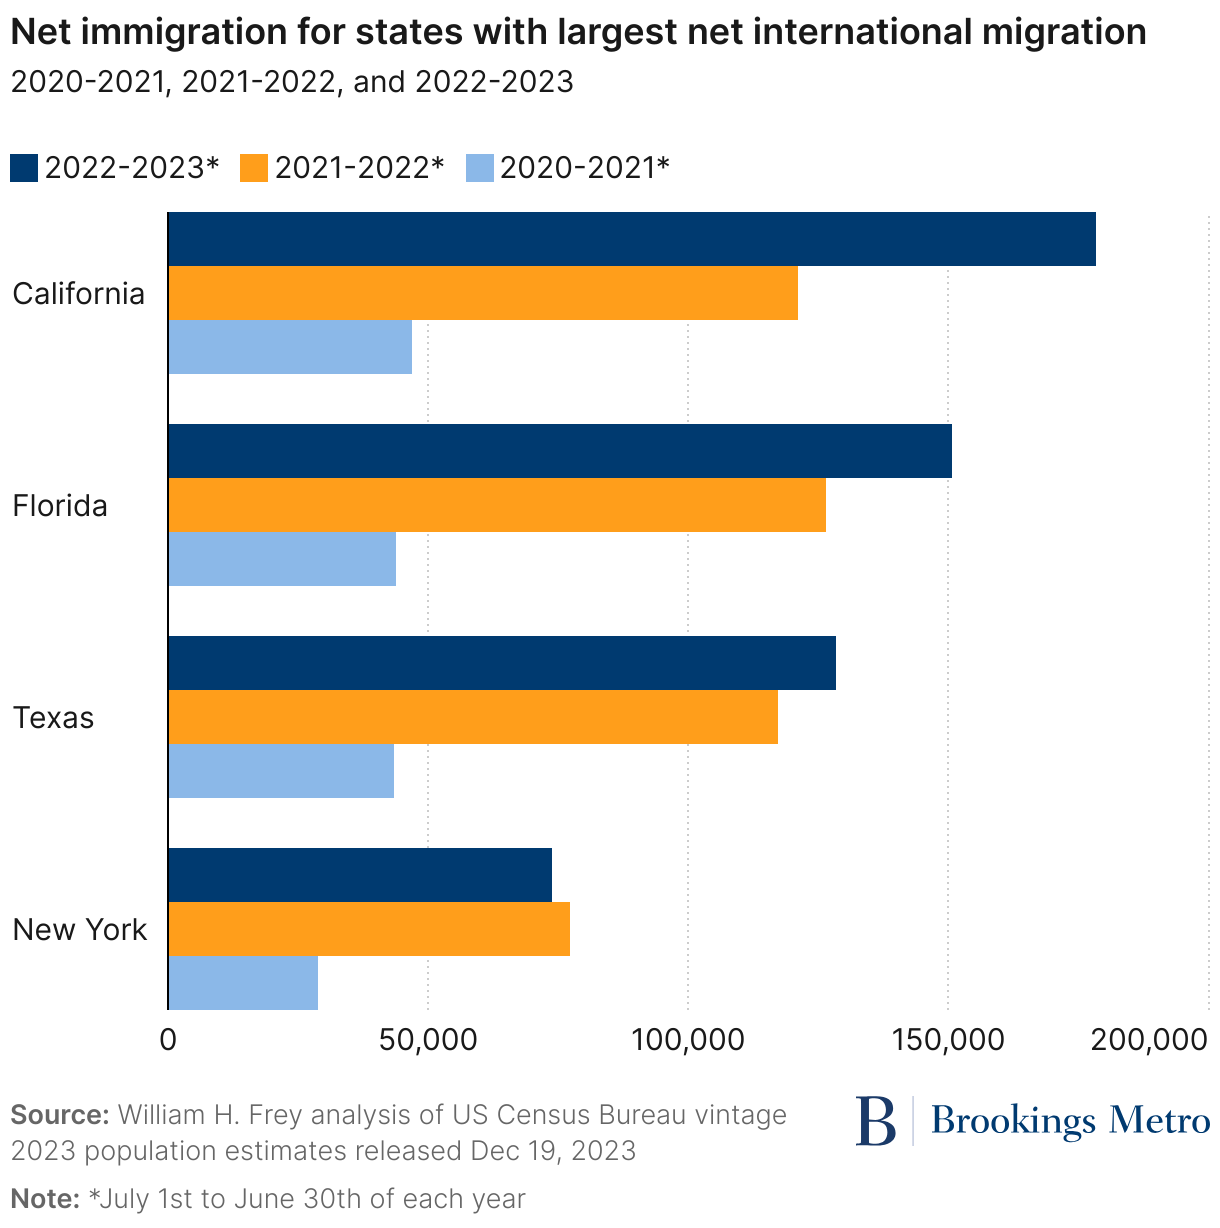
Just as net international migration bolstered the nation’s population gains, so is the case for most states. Thirty states showed increases in international migration in 2022-23 beyond the already high levels in 2021-22. (In 49 states, 2022-23 international migration levels exceeded those in 2020-21.) Some of the biggest gains occurred in the high-immigration states of Florida, California, and Texas, with New York only modestly declining from its already high levels (see Figure 4). Other states showing substantial international migration gains were New Jersey, Illinois, and Maryland. Among the states where net international migration was lower in in 2022-23, notable reductions occurred in Virginia and Washington (see downloadable Table B).
Among the 43 states that gained population in 2022-23, 13 of them would have lost population were it not for net international migration. And in another nine states, international migration accounted for more than half of the population increases. Among the former are the northeastern states of Massachusetts, New Jersey, Connecticut, Rhode Island, and Vermont; the midwestern states of Michigan, Ohio, and Kansas; the southern states of Maryland and Mississippi; and the western states of New Mexico, Washington, and Alaska.
Moreover, among states that lost population, immigration served to reduce the magnitude of those losses. California, which lost about 75,000 people in 2022-23, would have lost more than 225,000 people if not for international migration. New York’s overall loss of 101,984 would have approached 175,000 if immigration were not included.
Although not as important as international migration in driving new state growth rates, each state except Hawaii and Washington, D.C. experienced higher levels of natural increase or lower levels of natural decrease (the excess of deaths over births) in 2022-23 compared to 2021-22. As a result, natural increase made greater contributions to state gains in 2022-23 (see downloadable Table C).
More importantly, the number of states that recorded a natural decrease lowered to 19, compared to 25 in 2021-22 and 26 in 2020-21. These shifts have been primarily due to declines in the number of deaths each year. The state of Florida is notable in this regard, both because it ranked third in having the largest natural decrease in 2022-23 (7,603), but also because of its marked reduction in natural decrease, from 38,217 in 2021-22. Still, the fact that 19 states registered more deaths than births reflects the continuing impact of the pandemic. By comparison, in 2018-19 (as in earlier years), only a few states—West Virginia, Maine, New Hampshire, and Vermont—reported a natural decrease in their population.
A softening of pandemic domestic migration patterns
The newly released estimates also provide information on how domestic migration (movement within the U.S.) affected states beyond the patterns of international migration and natural increase. Domestic migration is especially likely to widen the divide between gaining and losing states. This was the case during the prime pandemic years, when there was sharp movement toward growing southern states—especially Texas and Florida—and out of highly urbanized states such as California, New York, and Illinois, which are home to the largest metropolitan areas and were hit hard by pandemic-related movement.
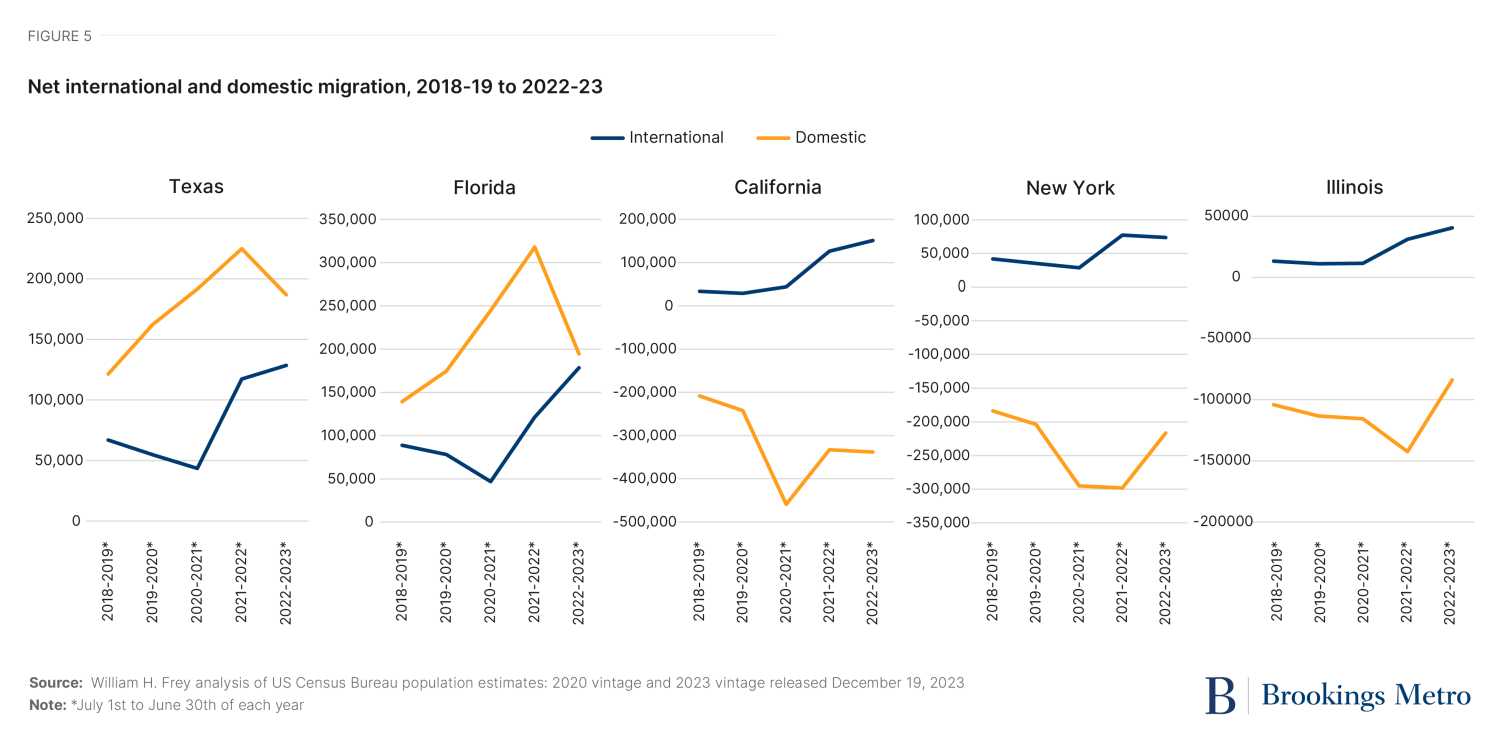
This can be seen by comparing the annual domestic migration for these five states over the period both prior to and since the pandemic (see Figure 5). In each case, domestic migration extremes (either in or out) occurred in the 2020-21 or 2021-22 prime pandemic years and have tapered off somewhat since. This was the case for net domestic in-migration for Florida and Texas and for out-migration from California, New York, and Illinois. Of course, each of these states experienced recent increases in net international migration, which added to their gains or reduced their losses.
These patterns of reduced in-migration for big gainers and reduced out-migration for states experiencing losses is more broadly indicated when looking at all states (see downloadable Table C). Each of the top seven migration-gaining states in 2022-23 showed lower gains in than in 2021-22. This is the case for Florida in particular, where the 2021-22 net domestic migrant gain of 317,923 came down to 194,438 in 2022-23. This also occurred in the southern states of Texas, North Carolina, South Carolina, Tennessee, and Georgia, as well as the western state of Arizona.
By the same token, seven of the eight states that lost the most domestic migrants (New York, Illinois, New Jersey, Massachusetts, Maryland, Louisiana, and Pennsylvania) still lost fewer in 2022-23 than in the previous year. Only California saw a small uptick in its domestic out-migration, but still much lower than its peak out-migration in 2020-21.
These recent out-migration declines occurred in some of the largest, most urbanized states—those that were the focus of the “urban doom loop” discussion during the height of the pandemic. Also noteworthy are the new estimates for Washington, D.C., which were part of this data release. They show that the District experienced a rise in growth, to 1.2% in 2022-23—reversing a population loss in 2020-21, and registering its highest growth rate since 2016-17.
Looking ahead
The newly released census population estimates—the most authoritative information on the nation’s population and components of change—make clear that while there was a modest uptick in the nation’s natural increase in the last year, current and most likely future national growth will depend on continued healthy levels of international migration.
Clearly, immigration is responsible for “bailing out” what would otherwise be fairly flat national growth in recent years, with high levels of deaths and low numbers of births related to the pandemic. Moreover, recently released population projections suggest that future national growth will continue to depend on current or even higher levels of immigration, even with “normal” natural increase levels. That is due to the continued aging of the population, meaning we can expect fewer births, more deaths, and a nationwide natural decrease in the not-too-distant future. Fortunately, government policy can affect immigration levels, and it would be demographically wise to give serious attention to these policies before U.S. population growth declines even further.
Another demographic development suggested by these estimates is the softening of the sharp domestic migration patterns away from highly urbanized states outside the South, and toward southern “migration magnet” states, especially Florida and Texas. While those patterns reflected a pandemic-related “urban doom loop,” the 2021-2022 population estimates for urban areas and cities as well as other research suggests a return to pre-pandemic urban migration and growth trends. The next round of Census Bureau estimates for these areas—to be released later this year—should shed more light on this.
Related Content
Author

-
Footnotes
- The Census Bureau estimates used in this report’s time series include: 2023 vintage estimates for July 2020 to July 2022; 2020 vintage estimates for July 2010 to July 2020; intercensal estimates for July 2000 to July 2010; intercensal estimates for July 1990 to July 2000; and historical population estimates for years between 1900 and 1989.
The Brookings Institution is committed to quality, independence, and impact.
We are supported by a diverse array of funders. In line with our values and policies, each Brookings publication represents the sole views of its author(s).