
America’s biggest cities endured brutal population losses during the early part of the pandemic—a result, in large measure, of an exodus of residents due to a fear of close proximity to others as well as a broader shut down of offices, commercial activities, and transit options. Lower immigration from abroad, a rise in Covid-related deaths, and a downturn in fertility also contributed.
Previous Census Bureau statistics showed that between July 2020 and July 2021 (referred to here as the “prime pandemic year”), well over half of the nation’s 88 largest cities lost population—many for the first time in decades. And among those that gained population, those gains tended to be smaller than in previous years.
Recently, the Census Bureau updated these statistics through July 2022—a year still impacted by the pandemic, but one in which most large cities, especially the largest, showed signs of demographic recovery. This trend was hinted at in a previous census release for county populations. The new data permits an examination of recent population changes across the nation’s cities, including comparisons with each other and over time.
The data shows that most cities have not yet achieved growth levels as high as those prior to the pandemic. Yet the majority of large cities have shown lower population losses, greater gains, or a change from losses to gains from July 2021 to July 2022. This is the case for nine of the 10 cities with populations exceeding 1 million, and 31 of the 37 cities with populations over 500,000. Moreover, while the pandemic widened city-suburban growth differences—as city population declines occurred in the context of smaller declines or greater gains in their suburbs—these differences were diminished for most large metropolitan areas in 2021-22.
The analysis below focuses on recent demographic changes in the nation’s largest cities as well as city-suburban shifts in major metropolitan areas. Statistics for individual areas’ growth trends, numeric declines, and city-suburban population growth are available in downloadable tables A, B, and C.1
Population turnarounds are most prevalent among the biggest cities
Figure 1 shows the pandemic’s impact on the aggregate population of the nation’s 88 cities with over 250,000 residents. Combined, these cities’ populations registered growth at varying levels from at least 2000 until 2019-2020. Growth levels trended downward in the early 2000s during a population dispersal to the suburbs, only to increase for years during and after the 2007-09 Great Recession, when lack of employment opportunities and a down housing market tended to “strand” many young adult in cities as they put off getting married, having children, and buying homes.
This changed during the mid-2010s, as the economy picked up and movement to the suburbs and smaller metropolitan areas increased. Yet it was not until the July 2020 to July 2021 prime pandemic year when the populations of these 88 cities registered an aggregate population loss, nearing 1%.
Now, new data for 2021-22 shows a shift among these cities from the notable aggregate population decline in the prior year to almost no change at all (-0.04%).
Underlying this shift are the nation’s largest cities, where a change toward greater population growth or slower declines is most prevalent (see downloadable Table A). Nine of the 10 cities with 2020 populations exceeding 1 million exhibited such demographic improvements between 2020-21 and 2021-22. This was also the case for 22 of the 27 cities areas with populations between 500,000 and 1 million. (Among these 27 cities, all but four saw their greatest population losses or smallest gains since at least 2010 during the prime pandemic year.)
All told, among the 88 cities with populations exceeding 250,000, 56 “did better” in terms of greater population growth or reduced decline in 2021-22 than was the case in 2020-21. Among these 56 cities, 20 showed a lower rate of decline, 16 showed a greater rate of growth, and 20 flipped from decline to growth. The latter category includes Atlanta, Dallas, Denver, Houston, Seattle, San Diego, Minneapolis, and Washington, D.C.
Figure 2 depicts patterns for selected cities that “did better’ over the course of the last year. Four of these (Atlanta, Seattle, Denver, and Washington, D.C.) showed unusual population declines in 2020-21, followed by a return to gains. One (Charlotte, N.C.) experienced a reduced gain during the prime pandemic year, only to revive in 2021-22. Also shown are five cities whose revival consisted of reduced losses in 2021-22, including the nation’s two largest cities, New York and Los Angeles, as well San Francisco, Boston, and Milwaukee. While still losing population, last year’s losses in these cities were noticeably smaller than in the prime pandemic year, especially for San Francisco.
To be sure, not all large cities “did better” demographically in 2021-22. Among those that showed even greater population declines than in 2020-21 were Philadelphia, Baltimore, St. Louis, Toledo, Ohio, and New Orleans. These are among several cities that were already experiencing demographic challenges that the pandemic seemed to accelerate.
Most cities did not register the growth levels they achieved earlier in the decade, or even the year before the pandemic. However, the new data shows that the biggest cities showed signs of demographic improvement from the sharp downturns they experienced during the prime pandemic year.
Fewer big cities lost population from 2021 to 2022
The prime pandemic year of 2020-21 was notable for the large number of cities that lost population. According to the new estimates, 54 of the 88 cities with populations exceeding 250,000 lost population that year—a number higher than any year since at least 1990.
As Figure 3 indicates, there have been ups and downs in the trends of big city population losses. In the years between 2002 and 2005 (a period of easy credit and rising suburban home ownership), a range of 29 to 32 cities lost population. This number decreased during and after the Great Recession, leading to the years between 2010 and 2014 seeing a range of just four to eight cities losing population. During this time, New York and Los Angeles gained rather than lost population (see downloadable Table B).
The number of population-losing cities rose as the economy recovered over the 2014 to 2020 period, to the 20 to 27 range. Still, this was far below the 54 cities that lost population in 2020-21.
In this context, it is relatively good news for big cities that the number that lost population dropped to 37 in 2021-22. Most of these (21) lost fewer residents than the year before, including some of those that had lost the highest numbers: New York lost 123,000 residents in 2021-22, compared with 282,000 the year before; Los Angeles lost 16,000 in 2021-22, compared with 58,000 the year before.
At the other end of the spectrum, most of the largest-growing cities did better in 2021-22 than in 2020-21, including Fort Worth, Texas; Phoenix; San Antonio; Seattle; Charlotte, N.C.; Jacksonville, Fla., and Houston—though most did even better in years prior to the pandemic (see downloadable Table B). Overall, the trend is moving in a positive direction for big cities.
Immigration and domestic migration contributed to city population rebounds
Changes in cities’ populations involve the sum of so-called “demographic components”: migration within the U.S. (domestic migration), immigration from abroad, and natural increase (the excess of births over deaths). During the prime pandemic year (2020-21), natural increase and immigration stood at decades-long low points—the former attributable to the rise in deaths and a tepid number of births, the latter due to immigration restrictions imposed during the pandemic. As a result, domestic migration was a particularly consequential driver of city population declines.
In 2021-22, a notable change was the rise in immigration from abroad, which nearly tripled from the previous year. This, along with shifts in domestic migration, contributed to greater gains or reduced declines in many cities and urban areas.
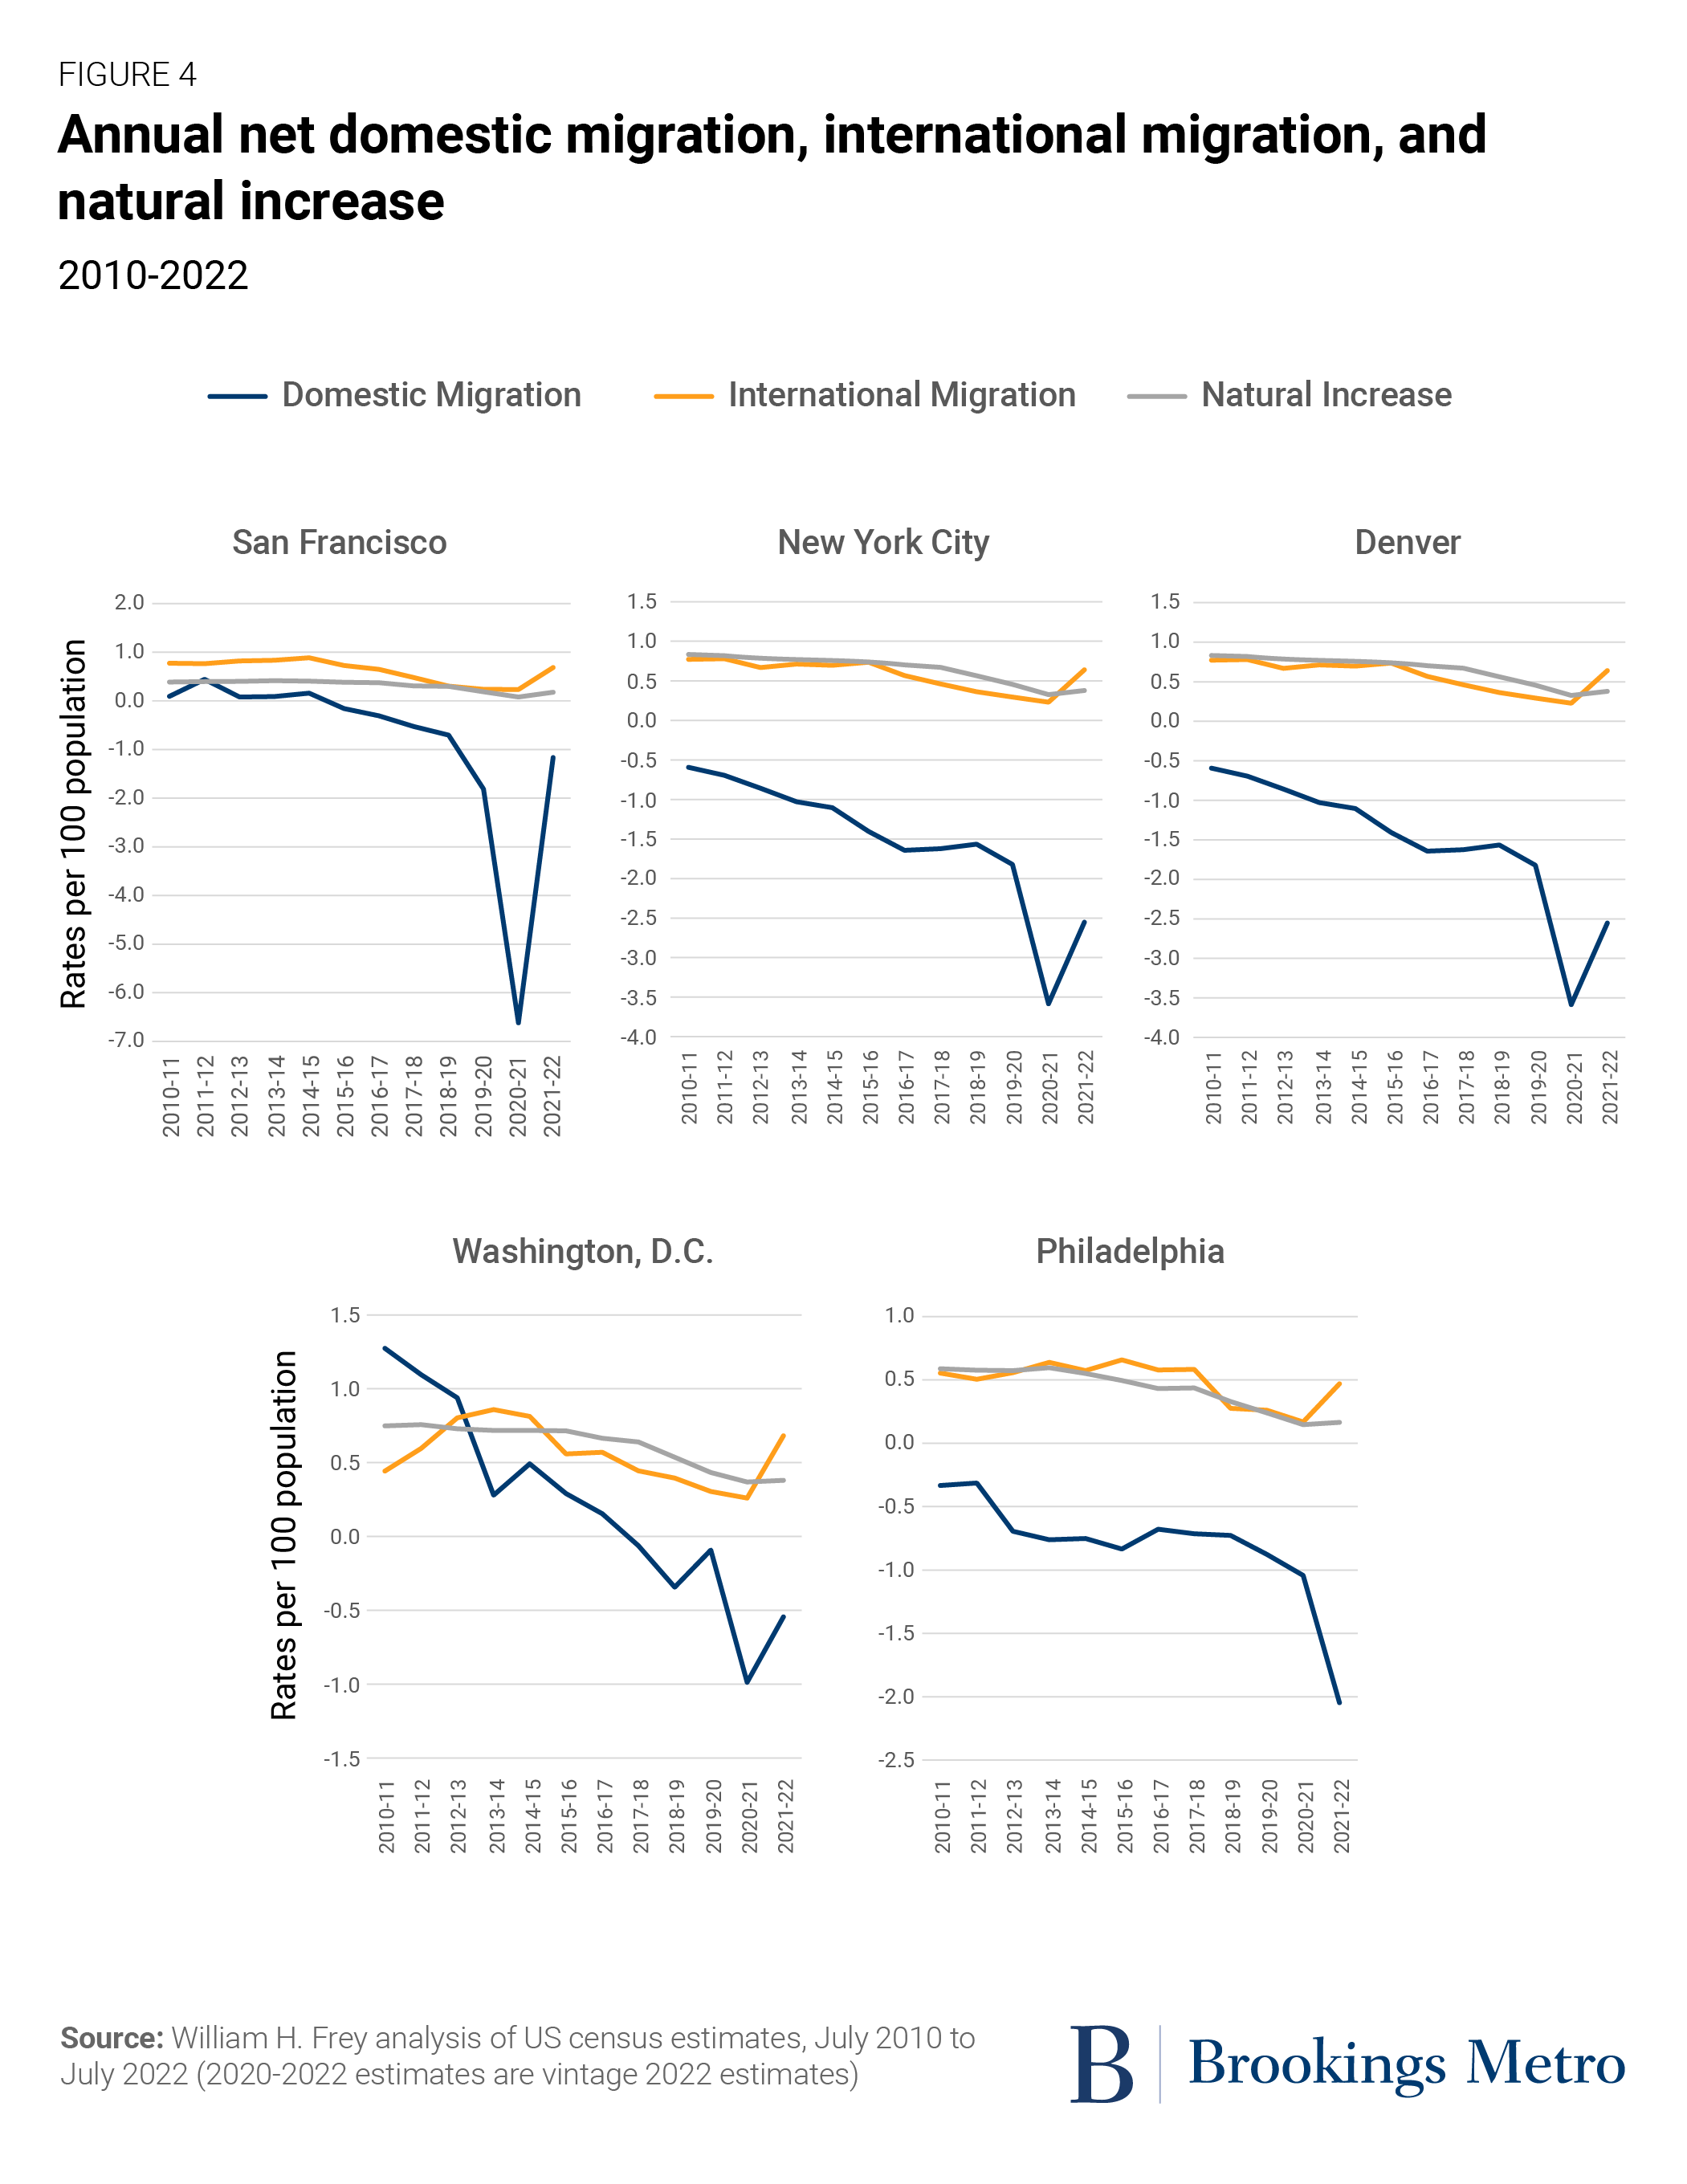
Examples can be seen in San Francisco, New York, Denver, and Washington, D.C. (see Figure 4).2 Each registered sharp rises in domestic out-migration in 2020-21. Yet also in each, domestic out-migration was sharply reduced in 2021-22, along with notable gains in immigration from abroad. These two demographic components contributed to reduced overall population declines in San Francisco and New York and population gains in Denver and Washington, D.C. Philadelphia, on the other hand, while showing gains in immigration from abroad, experienced even greater domestic out-migration in 2021-22, leading to the city’s increased overall population loss.
Growth disparities between cities and suburbs narrowed
The new census estimates also allow for an examination of city-suburban population shifts during 2021-22. This analysis surveys primary cities and suburbs in the nation’s 56 major metropolitan areas with populations exceeding 1 million.3
During the prime pandemic year, severe population losses or reduced growth in cities led to a sharp rise in city-suburban growth differentials, even though many suburban populations also registered growth declines. This changed in 2021-22, when that growth difference narrowed as city losses were reduced or growth levels rose, despite modest growth changes in many suburbs. Even so, we have hardly reverted to the situation of the early 2010s decade when city growth outpaced suburban growth.
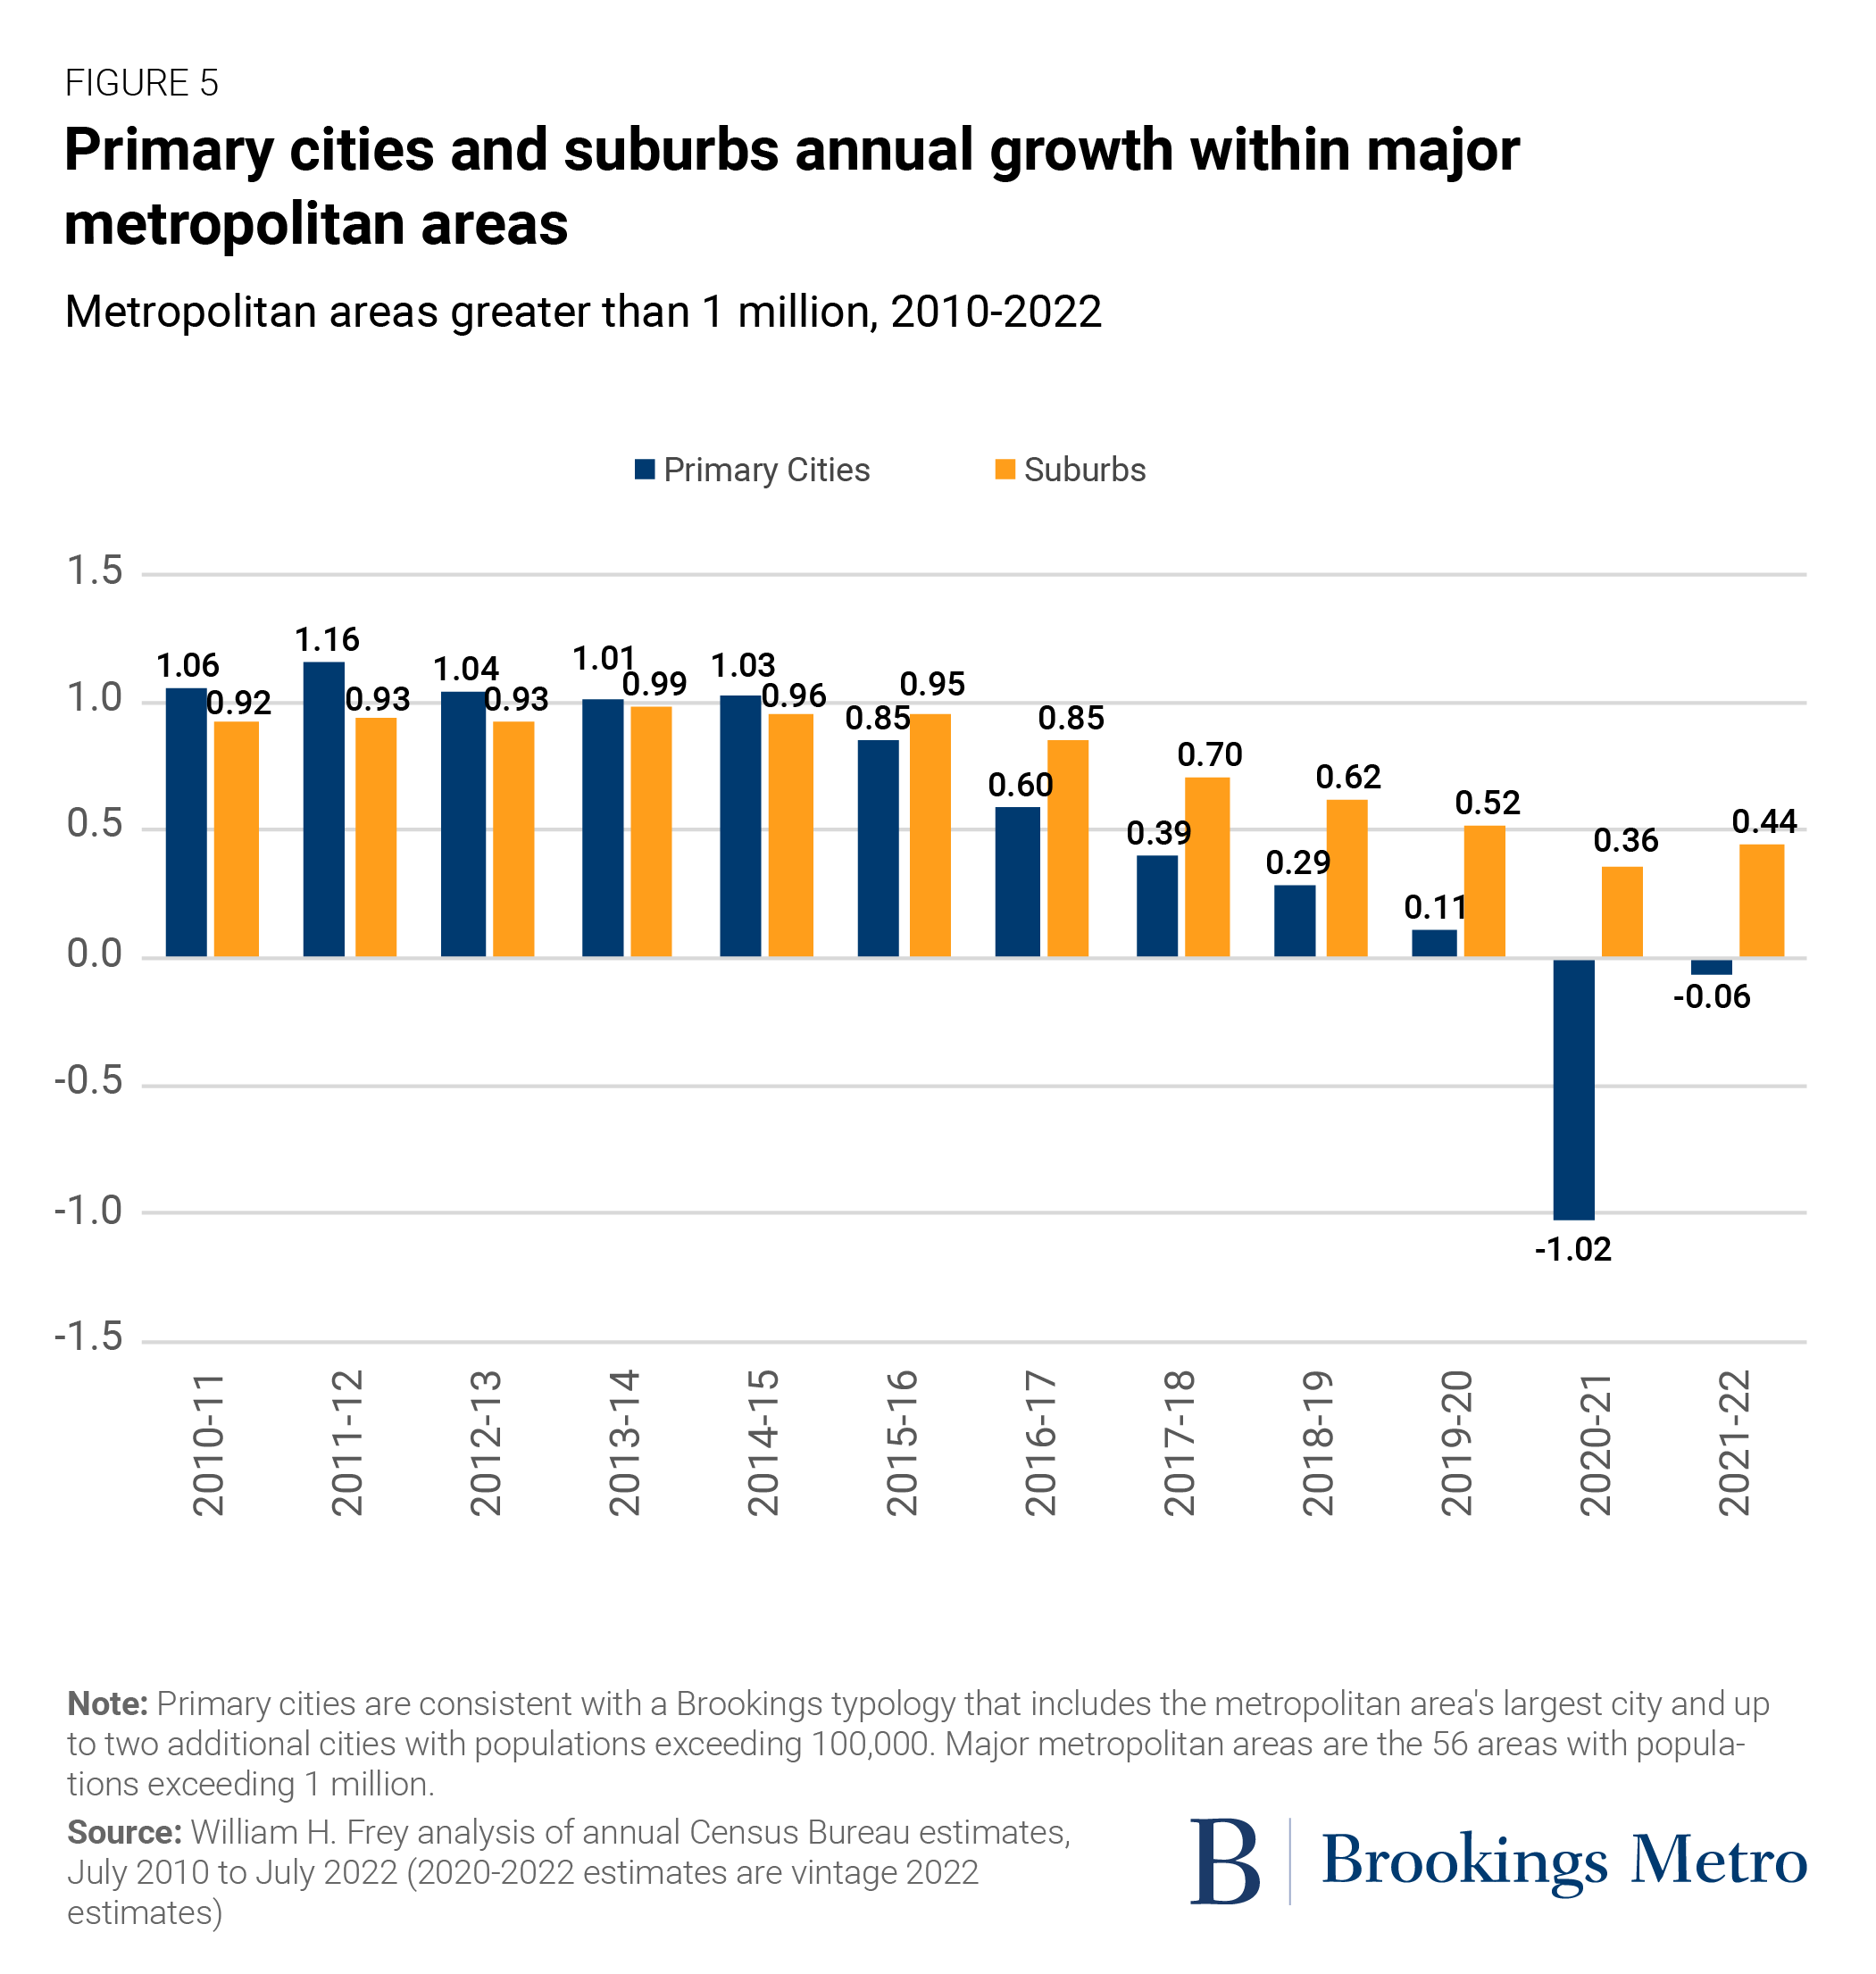
Figure 5 shows broad trends in annual growth rates between 2010-11 and 2021-22 for the aggregated primary cities and suburban populations of major metropolitan areas. High city growth outpaced suburban growth through 2015, after which city growth rates began to drop below suburban rates. Among individual metro areas, as many as 29 showed city growth advantages in 2011-12, with fairly consistent advantages in Atlanta, Boston, Denver, Los Angeles, San Diego, Seattle, and Washington, D.C., among others (see downloadable Table C).
The suburban growth advantage skyrocketed in 2020-21 when cities, in the aggregate, showed substantial losses while most suburbs experienced only modest changes in their growth. Among the 56 metro areas, just eight showed city growth advantages, while those with greatest suburban growth advantages included San Francisco, New York, Atlanta, Dallas, Houston, and Boston. This shifted in 2021-22, as aggregate city growth became far less negative. A city growth advantage occurred in 14 metropolitan areas, and in all but 10 metro areas, the suburban growth advantage decreased from the previous year.
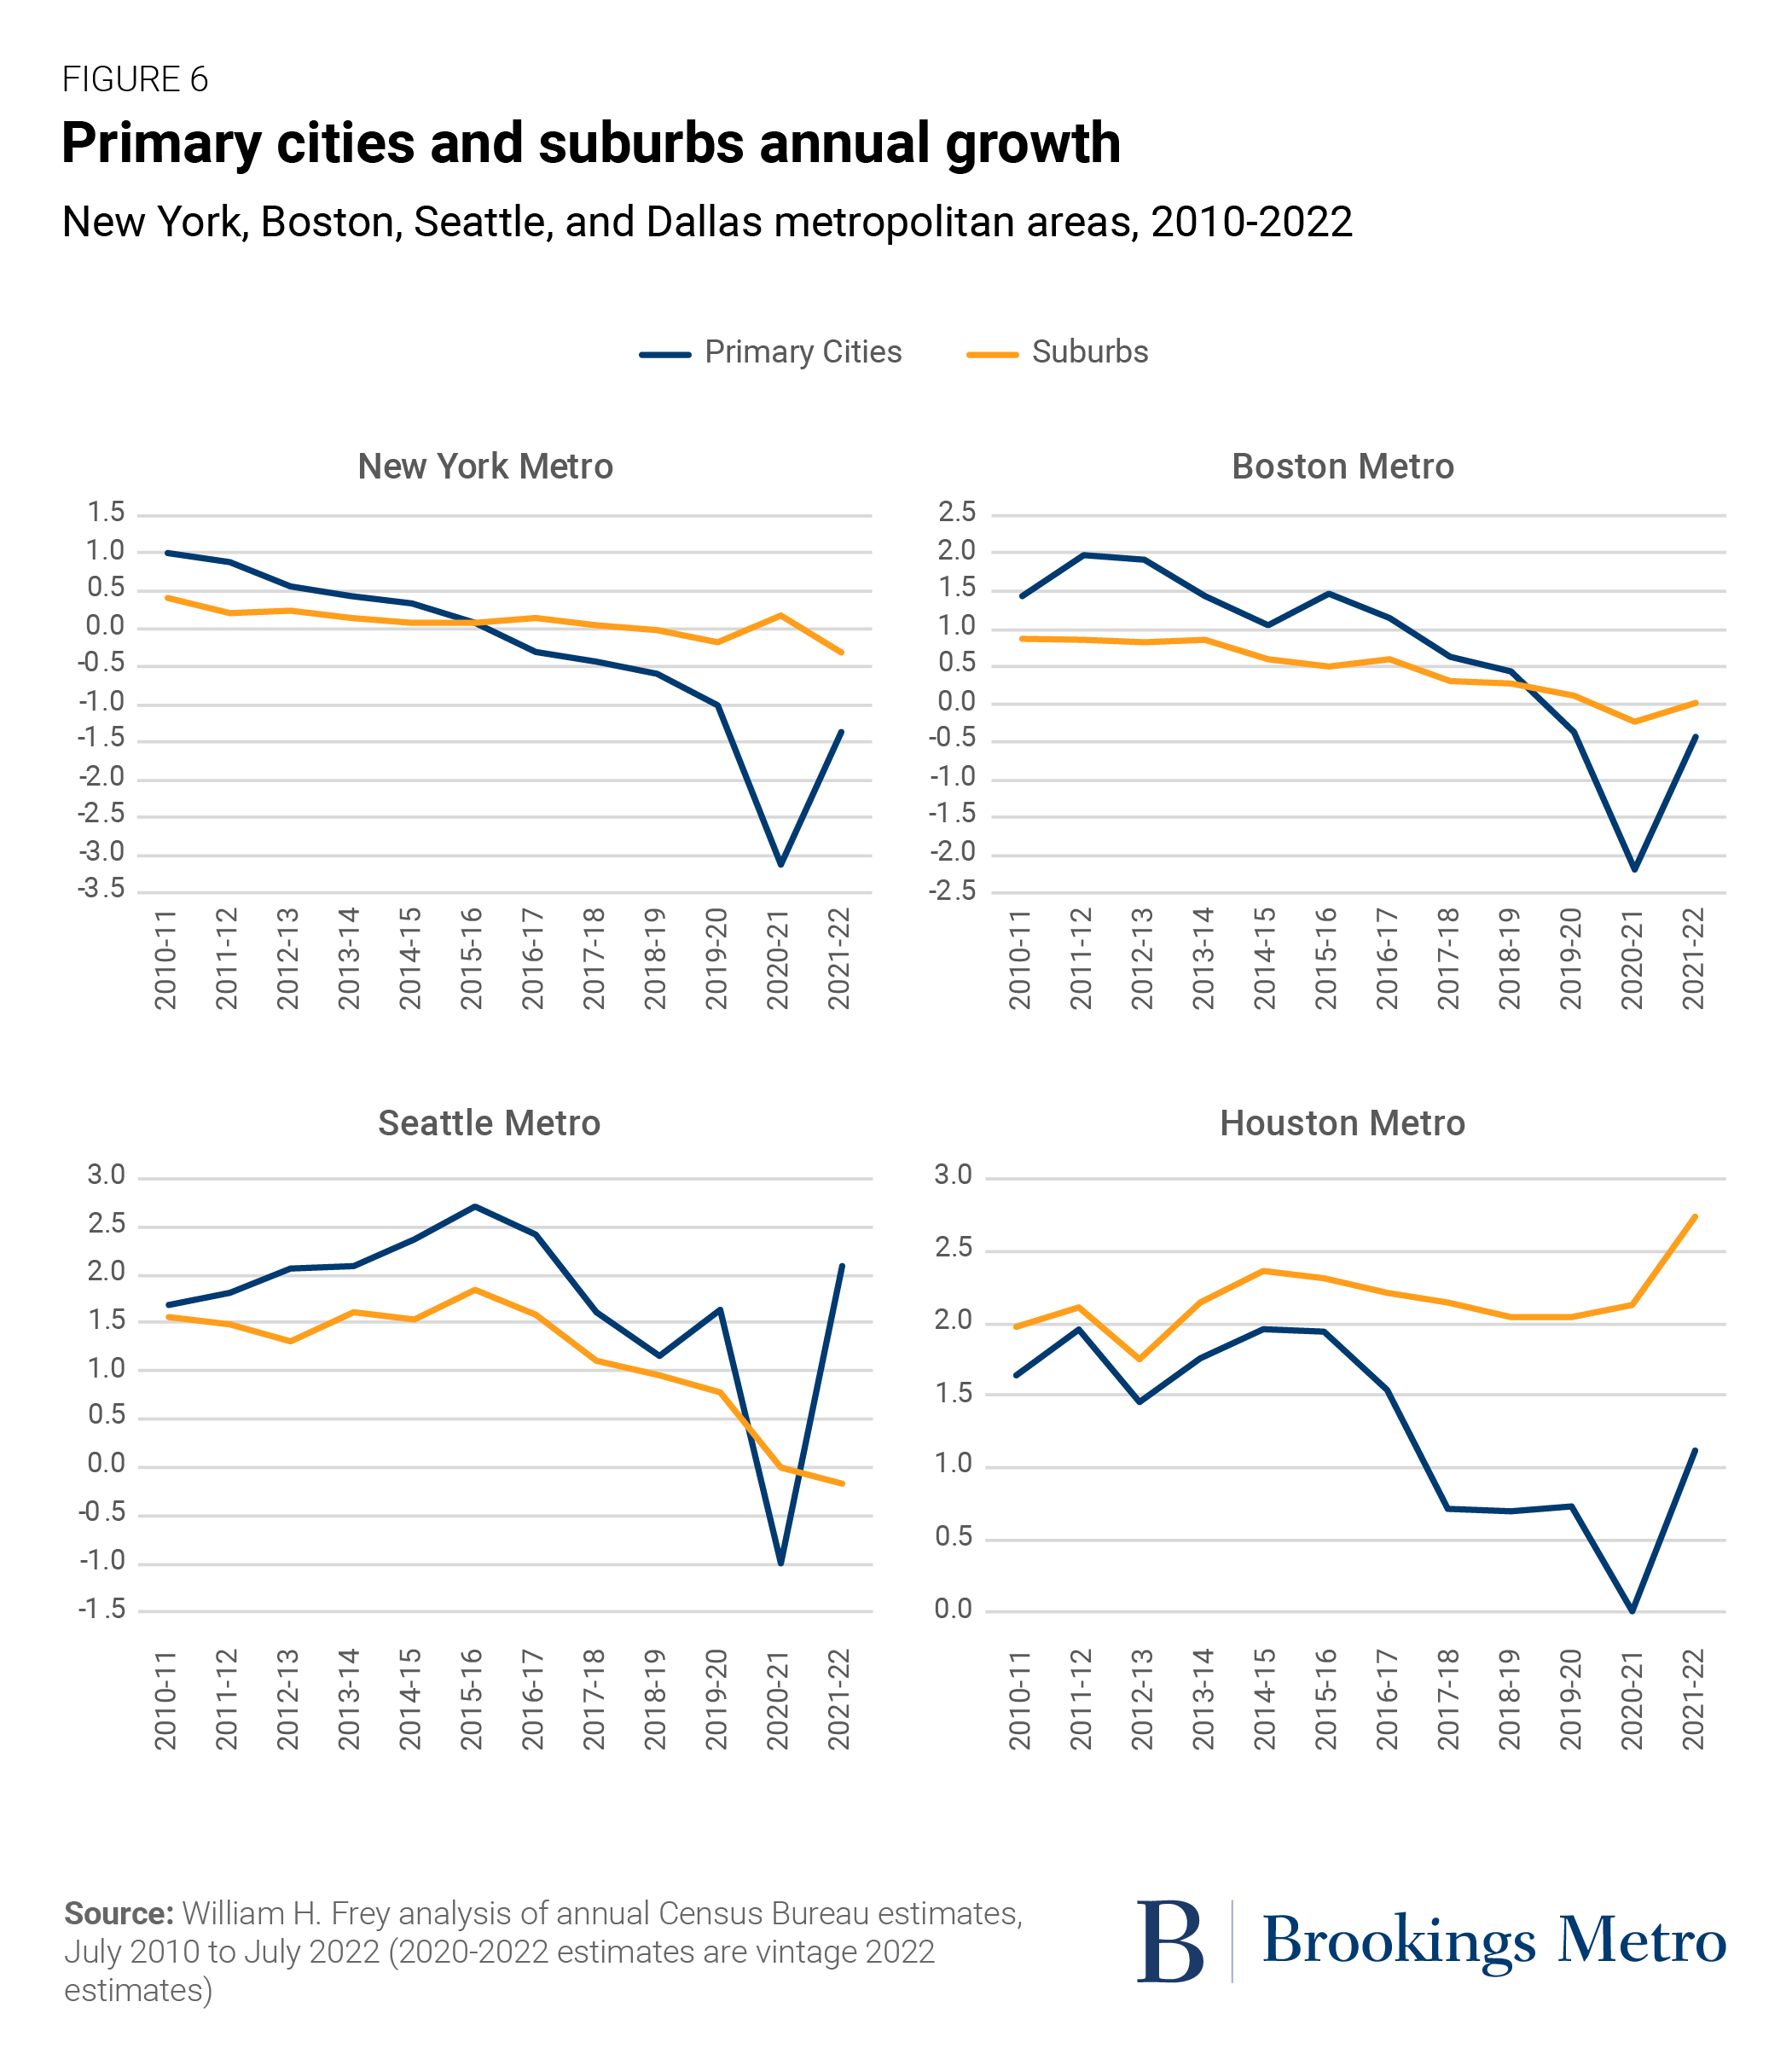
Figure 6 illustrates these shifts for primary cities and suburbs in four metropolitan areas. New York and Boston represent areas that began the 2010s with city growth advantages, shifted to suburban growth advantages as city growth became negative (especially during the 2020-21 prime pandemic year), and finally closed the city-suburban growth gap in 2021-22. (In the case of New York, suburban growth declined as city losses became reduced.)
Seattle exemplifies an area where city growth exceeded suburban growth for the entire period, except in 2020-21, when city growth plummeted into negative territory. It then turned positive and rose above suburban growth. In Houston, a faster-growing metro area, both suburban and city growth stayed positive over the entire decade, with city growth gradually slowing until the prime pandemic year, when the gain was negligible. Yet even here, city growth rebounded enough to modestly close the city-suburban growth gap in 2021-22.
Will cities see a demographic revival?
The new census statistics for the nation’s biggest cities suggest a potential for revival. One year after most of them experienced near historic population losses, the new numbers show they are moving in a positive direction. The vast majority of cities with populations over 500,000 showed greater gains and slower declines than in the year before, the number that experienced overall population losses is smaller, and the level of those losses is generally lower.
A few caveats are in order. First, these latest census estimates for July 2021 to July 2022 represent a period when the pandemic was still affecting decisions about where people live and work. Second, even though there is pattern toward demographic revival in many of these cities, this is different from what may be occurring in downtowns, business districts, and commercial centers, which contribute strongly to economic success. Many of these are still struggling to recover.
This means that it is too soon to come up with a final assessment of cities’ potential for revival. However, as the pandemic recedes, as younger generations make decisions about where to locate, and as immigration continues to rise, there are reasons to be more optimistic about cities’ demographic futures.
Author

Related Content


-
Footnotes
- This data is compiled by the Census Bureau’s population estimates program: evaluation estimates for the period 2010-2020 and vintage 2022 estimates for 2020-2021 and 2021-2022.
- The Census Bureau estimates do not provide demographic components of change for all cities, but only those that coincide with county boundaries, as is the case for the cities shown in Figure 4.
- Brookings Metro defines “primary cities” as one or more cities in the official metropolitan area with populations exceeding 100,000 (see Table C for the list of metro areas).
The Brookings Institution is committed to quality, independence, and impact.
We are supported by a diverse array of funders. In line with our values and policies, each Brookings publication represents the sole views of its author(s).


