
Immigration continues to invoke heated debates, particularly in light of the incoming Trump administration’s proposed policies regarding immigration control and deportations, which could sharply reduce immigrant gains for the U.S. population.
Given that, it is useful to examine the results of a new Census Bureau population release using improved immigration estimates. It shows that the nation’s population growth from July 2023 to July 2024 was the largest in over two decades. And it is net immigration from abroad—not a return to pre-pandemic birth and death levels—that is mostly responsible for this gain. These immigration gains are especially important because it is unlikely that the nation’s levels of natural increase (the excess of births over deaths) will rise substantially in the future due to population aging—making immigration a key component of future U.S. demographic growth.
The new estimates, which revise and extend earlier estimate sets, show larger immigration levels both nationally and for each state.1 Key takeaways include:
- The U.S. population grew by nearly 1% between 2023 and 2024—the highest growth rate since the pandemic, raising the national population size to 340 million (an increase of over 8 million since the 2020 census).
- More than four-fifths of the nation’s recent growth is due to immigration, a result of still low levels of natural increase.
- The South leads other regions in population growth, though not all of the top population-gaining states are located there. California, New York, and New Jersey rank third, fifth, and sixth, respectively, in 2023-24 numeric gains.
- Snow Belt to Sun Belt domestic migration has slowed from peak pandemic levels, with immigration making up for domestic migration declines in many states.
- Immigration contributed to at least half of 2023-24 population growth in 38 states and all of the growth in 16 states. Without immigration, the latter group of states would have lost population due to a combination of domestic out-migration and natural decrease.
Along these lines, the analysis below draws from the new data and historical census sources.2 It shows how post-pandemic population growth in most parts of the country is increasingly reliant on international migration—suggesting that this will need to continue to be the case in order to sustain viable demographic growth in the future.
Immigration fuels a return to pre-pandemic population growth
Last year’s national population growth rate of nearly 1% (0.98%) is higher than any year since 2001, and a substantial pickup from the recent low of 0.16% in the peak pandemic year of 2020-21—a year when deaths rose and births and immigration declined. Yet as Figure 1 shows, the nation has experienced wide variations in population growth due to wars, economic booms and busts, and changing immigration and fertility patterns.
Among the downturns were those occurring during the 1918 Spanish flu pandemic, the Great Depression, the post-baby boom decades of 1970 to 1990, and the years following the 2007-09 Great Recession. Among the upturns were the 1946-64 baby boom years and the immigration and small fertility increases of the 1990s.


Still, the COVID-19 pandemic years were an all-time growth low, and they were preceded by a decline in natural increase during the 2010s as the population started to age—leading to more deaths and a smaller proportion of women in their childbearing years. This is depicted in Figure 2, which contrasts the growth contributions of net immigration and natural increase since 2000. During all the years shown until 2020, natural increase outpaced immigration as a source of population growth, including the relatively low immigration years of the first Trump administration.
But when the pandemic hit, natural increase fell to a level well below immigration. It has since risen some, but hardly to pre-pandemic levels (see downloadable Table A). Thus, most of the nation’s population growth since the pandemic is due to immigration gains. The new Census Bureau estimates show those immigration gains increased sharply in the past three years: from 1.7 million in 2021-22 to 2.8 million in 2023-24, accounting for more than four-fifths of U.S. population growth.
In constructing the new immigration estimates, the Census Bureau makes plain that these are likely to be volatile depending on refugee and humanitarian flows as well as other sources. But if natural increase remains at relatively low levels (as census projections predict), it is likely that the nation will need to rely on immigration as the main contributor to growth.
All regions and most states showed greater population gains, with some shifts from the previous year
The notable rise in the nation’s growth impacted all regions and most states in 2023-24. This continues gains from the previous year, with some shifts.
This is apparent in Figure 3, which shows the continued dominance of the South in population gains. Still, the region’s 2023-24 population gain of 1.77 million slightly trails its 2022-23 gain of 1.86 million. At the same time, each of the three other regions—the Northeast, Midwest, and West—showed substantial gains (though at lower levels than the South) from the previous year, and up from losses during peak pandemic years.


In the past year, the top two population-gaining states were Florida and Texas. Yet as Figure 4 shows, both gained fewer people in 2023-24 than in 2022-23 (with Florida showing smaller gains for two straight years). At the same time, California and New York—two states that registered population declines during the peak pandemic years— not only gained population in 2023-24, but ranked third and fifth, respectively, among all states in numerical population gains (see downloadable Table B).
In 2022-23, all of the top five population-gaining states were located in the South. But in 2023-24, two of the top five are non-Southern states. The other Southern state among the top five is North Carolina (at fourth).
Among all states (including Washington, D.C.), 33 showed higher population gains in 2023-24 than they did in 2022-23. Among them, five are located in the South, 11 in the West, 10 in Midwest, and seven in the Northeast. Fifteen states showed lower growth rates, and only three (Mississippi, Vermont, and West Virginia) showed 2023-24 population declines. This is distinct from peak pandemic years of 2020-21 and 2021-22, when 15 and 11 states, respectively, registered population declines.
In terms of percentage growth in 2023-24, the South and Mountain West states lead the pack, with growth rates exceeding 1.5% (see Map 1). It is also noteworthy that Washington, D.C., included with these estimates, grew more rapidly than any state (at 2.2%) after experiencing a population decline and lower growth during the peak pandemic years—suggesting that other cities may show similar rebounds when the Census Bureau releases that data later this year.
Immigration contributed more to population growth than domestic migration in the South and several large states
Just as net immigration from abroad has come to dominate national growth in past year, it has also become more dominant than domestic migration in state and regional growth. In particular, this is occurring as sharp Snow Belt to Sun Belt domestic migration, which was dominant in peak pandemic years, softened.
This is most apparent when looking at the two types of migration contributions to growth in the South (see Figure 5).
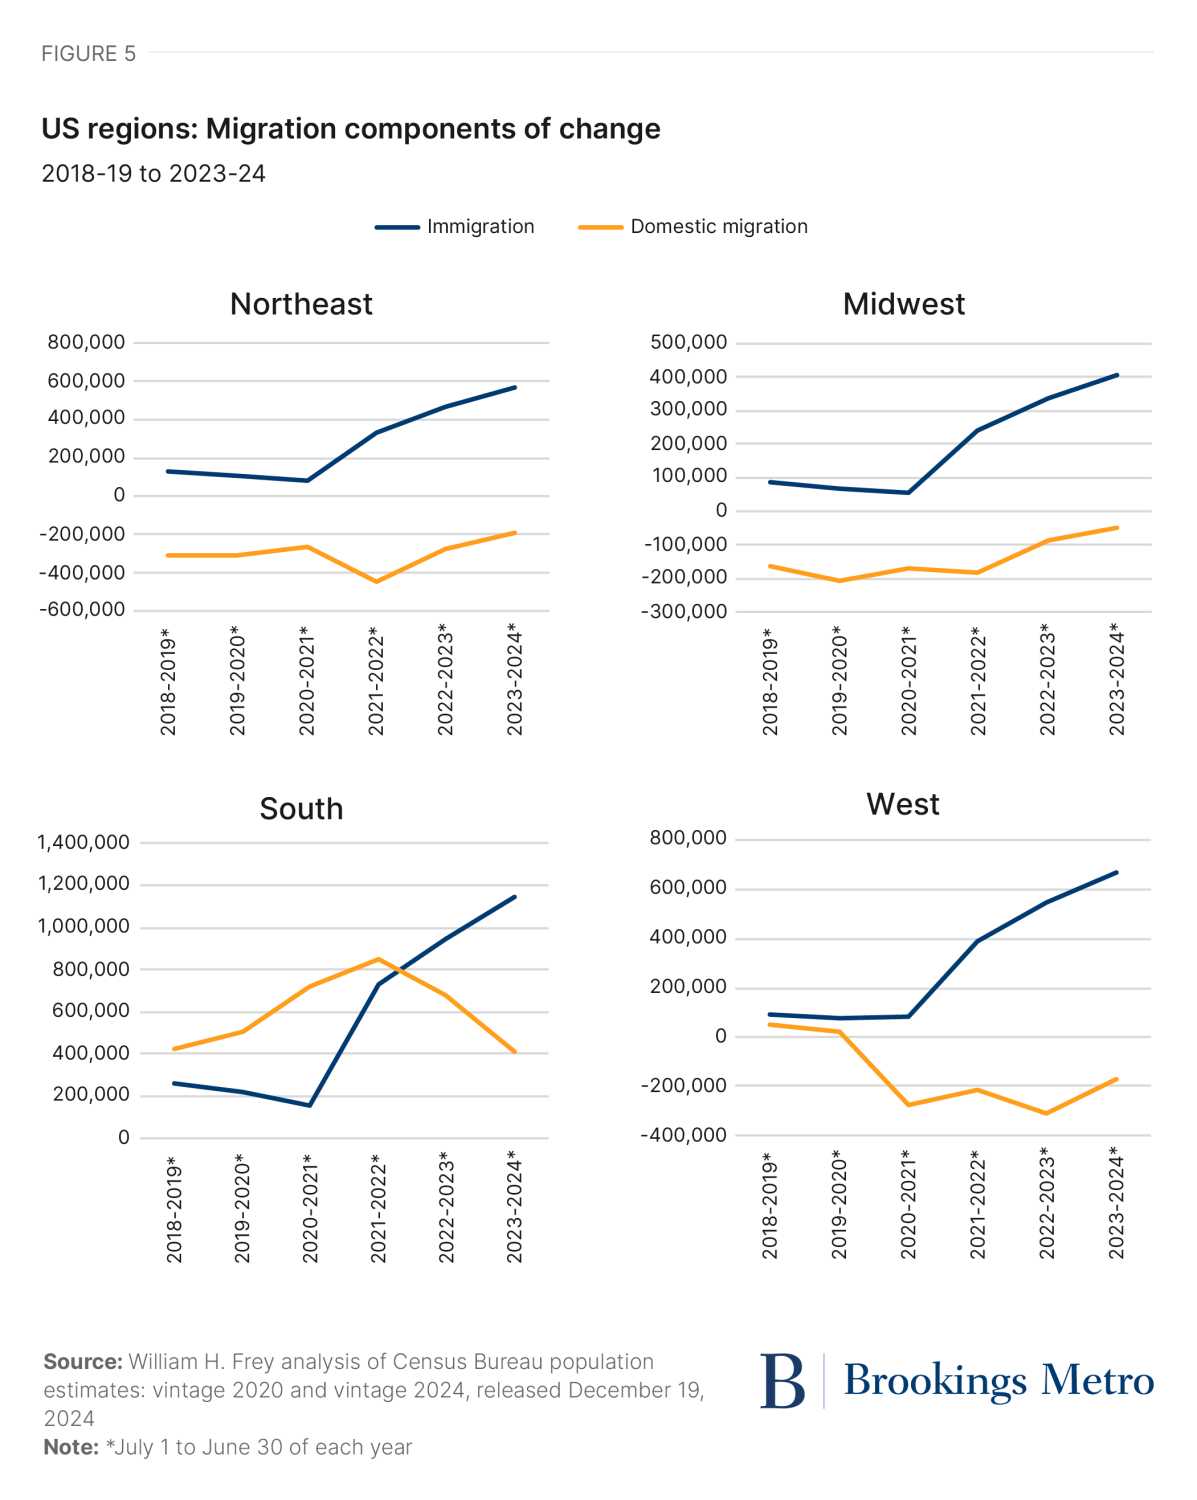
During the peak pandemic years (2020-21 and 2021-22), the South’s population gains came primarily from domestic migration. Yet over the past two years, as domestic migration to the South decreased, the rise in immigration took over as the region’s primary growth contributor. In contrast, the Northeast and Midwest benefitted in the post-pandemic period from reduced domestic out-migration as well as increased immigration.
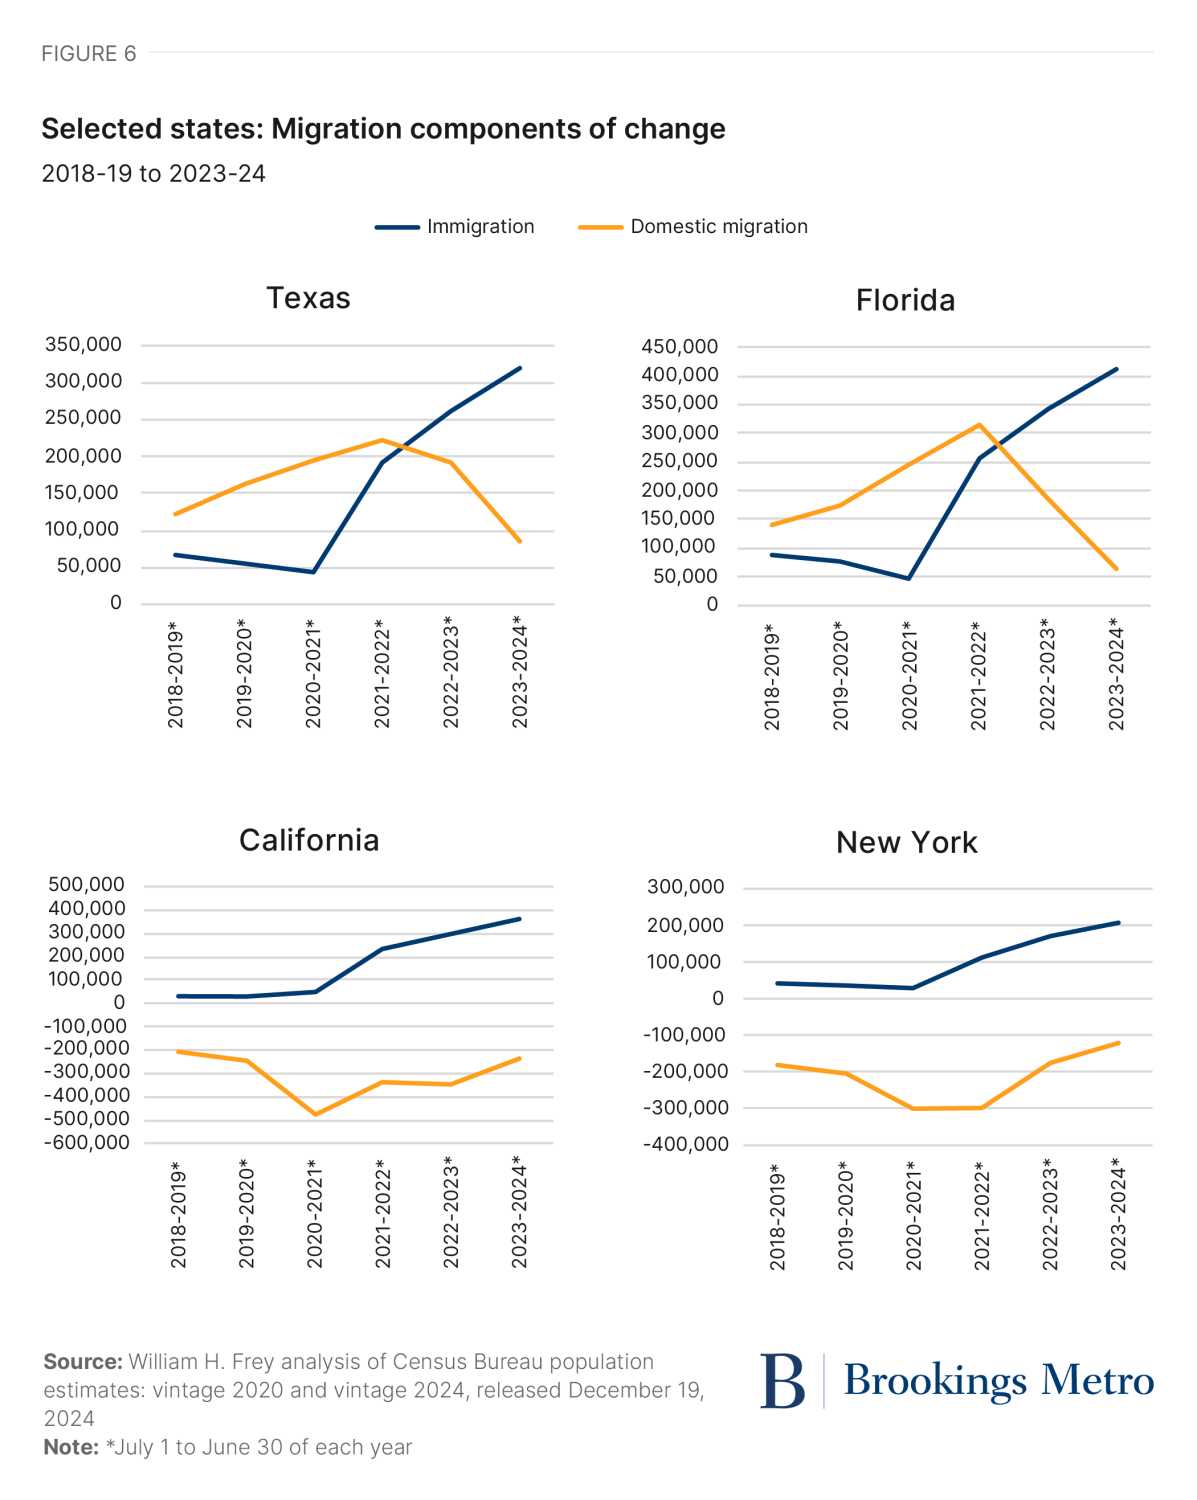
The changing migration patterns are noticeable in the two Southern magnet states: Florida and Texas, which both flipped from gaining population primarily through domestic migration to gaining population primarily from immigration in the past two years (see Figure 6). At the same time, California and New York—two states that are now among the top national population gainers—are benefitting from both greater immigration and reduced domestic out-migration.
All states have increased their gains from immigration in 2023-24. But when looking at domestic migration, the highest-gaining states (e.g., Texas, North Carolina, South Carolina, Florida) tended to have fewer domestic migration gains in the past year. And the states that lost the most population through domestic out-migration (e.g., California, New York, Illinois, New Jersey) had fewer of those losses (see downloadable Table C).
This confirms a softening of the peak pandemic years’ sharp migration from highly urbanized states to Sun Belt magnets. Overall, 24 states (including Washington, D.C.) registered domestic out-migration in 2023-24, but 18 experienced less out-migration than the previous year. Of the 27 states that gained domestic migrants, only nine gained more in-migrants than in the previous year.
A further demographic component of change to note is natural increase. As discussed above, natural increase has risen only slightly since the low point in 2020-21. There are still 17 states with natural decrease (more deaths than births), which is lower than the 26 states with natural decrease in 2020-21, but higher than the four back in 2018-19. While 23 states showed higher natural increase in 2023-24, all states showed lower natural increase last year than in 2018-19 (see downloadable Table C). Hence, both nationally and at the state level, there is little evidence of a return to pre-pandemic levels of natural increase.
In most states, at least half of recent population growth is attributable to immigration
While immigration is often associated with big states and their major cities and metropolitan areas, the new data show that in an environment of low natural increase and widespread domestic out-migration, immigration can be the primary and, in many cases, only component of demographic change in states of all sizes and in all regions.

Figure 7 shows the components of population change (immigration, domestic migration, and natural increase) for the eight states with highest immigration in 2023-23: Florida, California, Texas, New York, New Jersey, Illinois, Massachusetts, and Pennsylvania, all of which house large metropolitan areas. As is apparent, immigration accounts for all or most of their population gains. In Florida and Texas, immigration contributes to most of the state gains, with domestic in-migration and (for Texas) natural increase contributing the rest. But in the remaining six states, immigration contributes to all of state growth, as the sum of domestic out-migration and natural increase is negative.
It’s not just in big states where immigration is the major or sole growth factor. Nationally, 16 states owed 100% of their growth to immigration and, in an additional 22 states, immigration accounts for more than half of 2023-24 growth (see Map 2). Among the former are smaller states such as Louisiana, Rhode Island, and Oregon, as well as the Midwest states of Michigan and Ohio. Among the latter are states in all regions, including New Hampshire and Maine in the Northeast; Iowa, Kansas, Minnesota, Nebraska, and Wisconsin in the Midwest; Georgia, Kentucky, and Virginia in the South; and Arizona, Colorado, Nevada, and Utah in the West.
Clearly, the impact of immigration on population growth is not tied to places of specific sizes and in specific regions. States and areas across all parts of the country have seen immigration contribute to their population gains as they experience low or negative growth from domestic migration or natural increase.
Immigration’s contributions to future growth
This analysis of the new census estimates with larger, more realistic immigration assumptions makes plain how demographically significant immigration can be for population stability in a growth environment of low natural increase. While unusual growth circumstances occurred during this period (initially low natural increase due to reduced births and increased deaths during the pandemic, and unusually sharp rises in immigration due to heightened asylee and humanitarian inflows), this analysis shows how important immigration can be in generating population growth or even just stability in an otherwise low-growth environment.
There is much national debate about the role of immigration for our future demographic and economic growth, and there is clearly room to discuss how the country’s immigration policy can be shaped to assist declining areas and the communities and workforces within them. But merely from a “numbers standpoint,” this analysis shows how much immigration can contribute in the context of low natural growth and domestic out-migration. And while the early pandemic period showed low natural increase levels compared to the past, the most recent U.S. population projections make clear we are an aging population that will experience more deaths and—due to proportionately fewer women in their childbearing years—smaller numbers of births. These projections show continued declines in natural increase, leading to an excess of deaths over births in the not too distant future. Thus, the pandemic scenario gives us a window into our future.
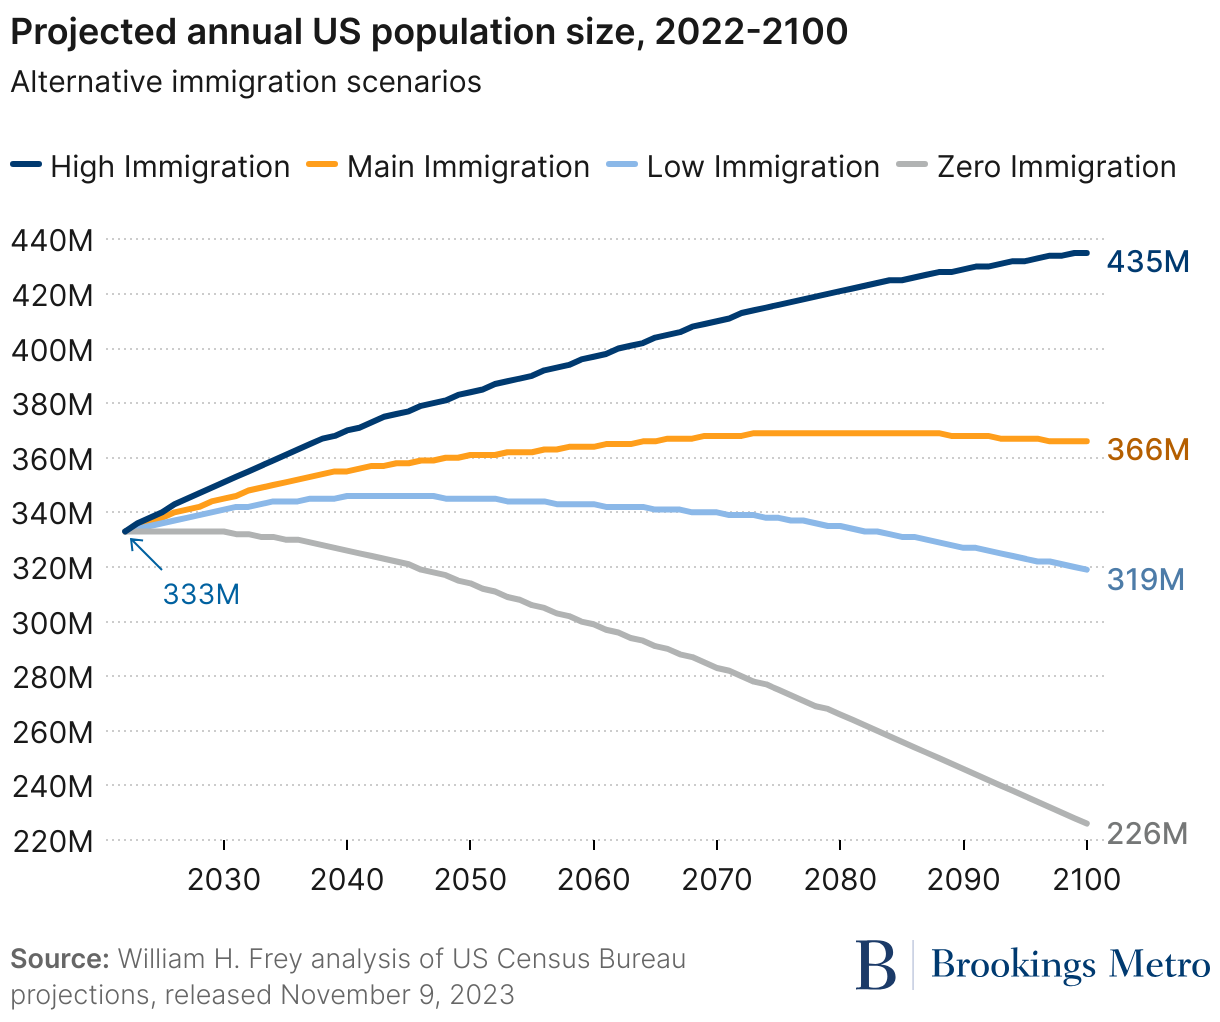
How much immigration will we need going forward? Recent projections, displayed in Figure 8, show that under a hypothetical scenario with zero immigration, we can expect a national population decline very soon; and with immigration at levels seen during the first Trump administration (“low” immigration levels in Figure 8), the population will decline in about 20 years, during which we will see the end of growth in our labor force. Even with immigration levels observed during the early 2010s (classed as “main” in Figure 8), growth will stop after 2080. Only with high immigration (about 1.5 million people a year) will the population continue to grow through the rest of the century.
Of course, these are only projections. But along with the census analyses reported here, they make the case that immigration will be an important ingredient for our future national and economic survival.
Author

-
Footnotes
- The new census estimates for the period 2010-2024, known as vintage 2024 estimates, should be used in place of earlier estimates for this period. A major change is the estimate of net international migration, which takes greater account of recent asylee, humanitarian, and other immigration types as discussed in the methodology provided by the Census Bureau.
- The Census Bureau estimates used in this report’s time series include: vintage 2024 estimates for population totals and components of change for periods July 2020 to July 2024. For population totals in earlier periods: intercensal estimates for July 2010 to July 2020; intercensal estimates for periods July 2000 to July 2010; intercensal estimates for periods July 1990 to July 2000; and historical population estimates for years between 1900 to 1980. For demographic components of change for July 2010-2020: vintage 2020 estimates. For demographic components of change July 2000- July 2010: intercensal estimates for periods July 2000 to July 2010.
The Brookings Institution is committed to quality, independence, and impact.
We are supported by a diverse array of funders. In line with our values and policies, each Brookings publication represents the sole views of its author(s).