The authors have released an updated paper utilizing data over a longer time horizon and an improved empirical design. The revised findings, methodology, and updated conclusions are available in Beyond arrests: How ICE enforcement depressed local employment in 2025. The new research confirms that employment fell in cities where ICE enforcement was most acute and shows that the shortfall has persisted over the period observed with no signs of recovery.
Executive summary
The current administration’s 2025 interior immigration enforcement campaign has been promoted, in large part, as a labor market policy: remove unauthorized workers and create jobs for Americans. This research evaluates that claim and finds the reverse: Enforcement surges cost jobs, including jobs held by American-born workers.
Spearheaded by Immigration and Customs Enforcement (ICE), the 2025 campaign represented a sharp break from prior enforcement policy in scale and tactics. The 2025 approach, in the administration’s own description, was built around “shock and awe” tactics:1 highly visible raids, worksite arrests, and viral videos of detentions—acts designed to induce fear in a broad population. Moreover, where previous administrations across both parties paired enforcement with expanded pathways for lawful presence and entry to meet U.S. labor demand,2 the 2025 approach abandoned that pairing, launching an enforcement-only campaign coupled with policies to squeeze legal migration.
We compare employment outcomes between cities that experienced a sharp surge in ICE activity in the first half of 2025 and those that did not. This approach isolates the specific effect of enforcement surges on local economies and rules out other potential drivers of job loss, such as tariffs, war, inflation, and AI.
We find that employment trajectories in surge and non-surge cities were closely aligned before enforcement began. They diverged precisely when ICE arrests intensified. The gap widened over time, and the knock-on effects extended far beyond those directly targeted. In surge cities, employment fell most in immigrant-intensive sectors, but job losses spread further. American-born workers also experienced job loss.
Updated research

Key findings
The enforcement surge cost 668,000 jobs. Across the top 25% of cities (86 of 341 in our sample) that experienced the sharpest rise in ICE arrests,3 employment fell an average of 0.73% below what those cities would likely have seen absent the surge.4
Job losses far exceeded the number of people arrested. In these 86 surge cities, ICE made around 52,000 excess arrests. But arrests are only a proxy for a far broader disruption, including visible raids and heightened ICE presence. Each excess arrest, as a proxy for the broader enforcement shock, is associated with 13 jobs lost overall, jobs previously held by both immigrants and American-born workers.
Job loss deepened over time. In the 51 cities where we can observe outcomes at least six months after the surge began, that gap widened to 1.48%. The job loss grows over time, and the excess arrest-to-job-losses ratio rises to 30.
American workers were harmed. As firms faced sudden labor shortages, they scaled back operations, delayed projects, and cut headcount. At the same time, declining foot traffic and consumer spending hurt businesses whose customers stayed home. Applying findings from Cox and East (2026), we estimate that, out of the 668,000 jobs lost, 51,000-297,000 would have been held by American-born workers. This implies that for every excess arrest, between one and six of the jobs lost would have been held by American-born workers.
Job loss concentrated in immigrant-intensive sectors, but others were also affected.Sectors where immigrant workers are heavily represented, such as construction and accommodation and food services, sustained the deepest direct job losses. But industries with very few immigrant workers, such as arts and entertainment, also contracted sharply in surge cities. This finding is not consistent with a simple story of workforce removal. It is consistent with fear-driven demand suppression. When enforcement actions dominate the news, and people stop going out, businesses lose customers and cut staff, regardless of who their workers are.
1. A new era of interior enforcement
Beginning in January 2025, Immigration and Customs Enforcement (ICE) launched an interior enforcement campaign with no parallel in recent history in both its scale and its tactics. Consequently, workers saw employment losses of an order of magnitude greater than in previous campaigns. But the losses worked through well-studied channels: labor withdrawal, business disruption, and weaker local demand.
This can be seen in a comparison of 2025 enforcement to the next most recent large-scale federal enforcement effort: Secure Communities (SC), a program that began in 2008 under the Bush administration and scaled up during the Obama presidency. Enforcement under SC worked through the criminal justice system and remained largely out of public view: A person generally had to be arrested for something unrelated to their immigration status before ICE decided whether to begin removal proceedings.5
Still, the program’s effects extended well beyond those that were specifically targeted. Alsan and Yang (2024) and Watson (2014) documented sharp declines in enrollment in government programs like Medicaid, food assistance, and disability benefits among fully eligible recipients, including U.S. citizens. They attributed these declines to a “chilling effect”, whereby immigrant households, including those with legal status, withdrew from public life out of fear of interacting with government officials. The program also reduced employment and wages for American-born workers. East et al. (2023) point to two mechanisms: firms facing sudden labor shortages tend to scale back operations, and local economies weaken when immigrant households reduce everyday spending.
The first major difference was scale. Though SC was a large program by the standards of its era, its removal rate was modest compared to 2025 ICE enforcement, which, in its first year, generated nearly four times as many removals as SC did in its peak year.6 ICE made roughly 380,000 arrests between the January 2025 inauguration and February 2026. Figure 1 illustrates the sharp increase in arrests in early 2025 and the expansion of at-large arrests in the community. Figure 2 shows the cities where enforcement surges were most pronounced.


The scale of the 2025 surge is only part of what makes it historically distinct. The second major difference was how enforcement was carried out. Whereas Secure Communities operated largely behind the scenes, the 2025 campaign was designed to be visible.
Agents conducted worksite raids, entered private homes, and made arrests outside schools, churches, and hospitals. Of the 115,000 arrests ICE made in the first half of 2025, 55,000 were at large, meaning they took place in the community, rather than in jails or detention facilities. Videos of these encounters spread widely on social media, and news coverage was extensive and sustained.
Though unauthorized immigrants were most at risk, legal status offered unreliable protection. ICE deported Kilmar Ábrego García despite a standing court order barring his removal, a case that drew national attention but was not isolated. Furthermore, the Supreme Court’s recent decision to halt a court order requiring DHS not to consider race and language when deciding who to stop and question in effect increased the likelihood of racial profiling as a byproduct of enforcement operations.
The consequences of arrest are serious and well-publicized. Detainees report overcrowded, freezing conditions. At least 46 people died in detention. ICE transferred individuals to a maximum-security prison in El Salvador and sent others to South Sudan. Family members have been unable to locate detained relatives.
Administration officials described the approach explicitly as “shock and awe”—deliberate, highly visible enforcement designed to produce fear across a population far larger than those directly targeted. The data support what the chilling literature would have predicted: These tactics, at scale unparalleled in recent history, resulted in employment losses of an entirely different order.
This paper presents the first causal empirical evidence of the 2025 ICE surge’s impact on employment, city by city, using data covering almost every firm and worker in the country. By comparing trajectories of 86 cities that experienced a sharp enforcement surge against those that did not, we isolate the surge from other forces: tariffs, inflation, and AI, operating simultaneously on the broader economy. The findings are stark: Job losses in surge cities far exceeded the number of people arrested, and the damage extended well beyond the workers who were directly targeted. The pattern of excess job loss is consistent with fear-driven labor withdrawal, business disruption, and weaker local demand. Beyond the direct removal of undocumented residents in the first half of 2025, ICE’s enforcement damaged regional economies.
The findings of this paper are consistent with a growing body of recent research on the 2025 enforcement surge. Cox and East (2026) provide a causal analysis of enforcement at the U.S. state level, finding declines in work among likely undocumented immigrants who remained in the U.S. and negative spillovers to American-born workers, using the Current Population Survey. Hernandez (2026) uses cell phone and credit card data to document declines in foot traffic and consumer spending following enforcement in targeted cities. This paper complements each of these by studying employment effects at the city level where ICE surges occurred, using administrative payroll data that covers nearly all formal employers and workers in the country.7
2. Data and methods
To measure the labor-market effects of the 2025 ICE enforcement surge, we draw on two primary datasets: one tracking where and when ICE made arrests, and one tracking monthly employment in cities across the country. The Appendix provides full technical detail on data cleaning, variable construction, and estimation. This section describes the core data sources, the identification strategy, and the robustness checks used to validate the findings.
Measuring the enforcement surge
Our arrest data come from the Deportation Data Project, a public-records initiative that compiles individual ICE arrest records obtained through Freedom of Information Act requests. Each record includes the month and location of arrest, though location is recorded inconsistently as a city name, county, facility code, or ICE office designation rather than a precise address.
To make these records usable, we develop a multi-step process to map the location information in these records onto cities, using geographic crosswalks, text matching, and mapping tools.8 As a check, we confirm our totals match ICE’s own aggregate figures.9 This process allows us to count how many arrests occurred in each city in each month. We focus exclusively on at-large arrests, which are arrests of people who were not already in criminal justice custody, because these are the arrests most likely to be felt in local labor markets.
Measuring employment
To measure labor-market outcomes, we use monthly employment estimates from Lightcast, a labor market data firm. Lightcast builds its estimates primarily from the Quarterly Census of Employment and Wages (QCEW), a federal dataset compiled from employer payroll tax records that covers nearly all formal jobs in the United States. This data allows us to track total employment and employment within specific sectors such as construction, food service, and manufacturing for each city, month by month. Importantly, since the data come from companies’ payrolls, it is not affected by survey nonresponses, an issue that makes it difficult to estimate changes to overall employment with datasets like the Current Population Survey (CPS), particularly as migrants and undocumented workers have become fearful of contact with any government official (Kolko, 2025).
Identifying cities where enforcement surged
ICE moved from city to city in the first half of 2025. Some cities saw sharp, sudden spikes in ICE arrests beginning in early 2025, while others saw little change from prior years. Our identification of surges involves two steps:
First, we identify where surges happened by classifying a city as having experienced an “enforcement surge” if its cumulative January through June 2025 arrests rose sufficiently above its own 2024 monthly baseline to place it in the top quartile of the surge distribution among eligible cities. In other words, “surge cities” are those with enough of a jump in arrests to place them in the top 25% of all cities in our sample. 86 cities comprise that top quartile. The remaining 255 cities serve as the comparison group. Second, we identify when surges began for each of these 86 cities. Since ICE moved from city to city, the surge onset month varied from January to June 2025. We identify each city’s specific surge onset month by finding the point at which arrests spiked most sharply. (See Appendix A3.)
The comparison
The analytical question is straightforward: Did cities that experienced a surge in enforcement end up with fewer jobs than they would have had otherwise? To answer it, we compare employment trends in surge cities to those in other cities that did not experience a surge. If surge and non-surge cities were tracking each other closely before enforcement began, then any gap that opens afterward can reasonably be attributed to the enforcement itself. We confirm this was indeed the case: Prior to any surge, the employment trajectories of surge cities and comparison cities were closely aligned. The divergence begins precisely when enforcement intensifies.
Stress-testing our findings
We put the results through robustness checks designed to rule out alternative explanations. To ensure our findings are not an artificial result of the 25% threshold used to define surge cities, we estimate the model at various cutoffs and find that the effect is stable across all of them. To test whether larger surges produce proportionally larger job losses, as one would expect from a genuinely causal relationship, we divide cities into quartiles based on arrest intensity and compare job losses between them, confirming greater losses in places with more arrests. To rule out the possibility that any single city is driving our result, we estimate the model while leaving one city out at a time and find that the estimate never moves more than 10% (e.g., 0.7% job loss to 0.63% job loss). Finally, we re-estimate our main finding using year-over-year employment growth as the outcome to remove all city-level seasonality, and we obtain the same job-loss pattern.
Surge cities tend to be larger than non-surge cities, but Figure 3 below shows that the two groups were on a similar employment trajectory before enforcement surged, which helps rule out any national shock that may have affected only big cities. The staggered timing of surges also means an unrelated economic shock would have had to perfectly mirror ICE’s city-by-city rollout to skew our results.
Several important limitations apply, which the appendix discusses in more detail. For one, our estimates capture effects in the 86 surge cities only. They cannot be directly extrapolated to a national total. Additionally, the employment data we use captures formal payroll jobs well, but they do not fully observe gig, informal, or cash-based work. This means the job losses we observe disproportionately affect American-born workers, since recent immigrants are much more likely to work informal, cash-based jobs. It also means that our job loss estimates may reflect a shift into informality rather than complete withdrawal from work. The employment data also ends in September 2025, so our analysis only covers the initial months of enforcement when effects were still materializing. Operation Metro Surge in Minneapolis, for example, took place outside of the timeframe we study, so employment losses there are not included in our results. For these reasons, our estimates are best understood as evidence on short-run local economic disruption in cities that experienced an ICE surge, not as a final measure of national long-run employment effects.
3. ICE surges shrank local economies
In cities where ICE enforcement surged, employment fell, not just among immigrants, but across the local economy. Comparing 86 cities that experienced a sharp enforcement surge in early 2025 with the 255 cities that did not, we find that employment paths were closely aligned before the surge and then diverged after enforcement intensified. Across all 86 surge cities, observed between three and eight months after their local surge onset, employment averaged 0.73% below what would have been expected absent the enforcement shock.10
In the 51 cities where data allow us to observe employment at least six months after the local surge, total employment was 1.48% below what it would have been. These estimates combine job losses to removed immigrants, to other immigrants from chilling effects, and job losses to both natives and immigrants due to disrupted business activity—see Figure 3. The effect appears to level off, though more recent data are needed to determine whether these job losses are permanent or whether cities with more recent surges experienced the same employment loss.
Figure 3. Employment in cities where ICE surged was 0.73% lower across the entire post-surge period and 1.48% lower six months after the surge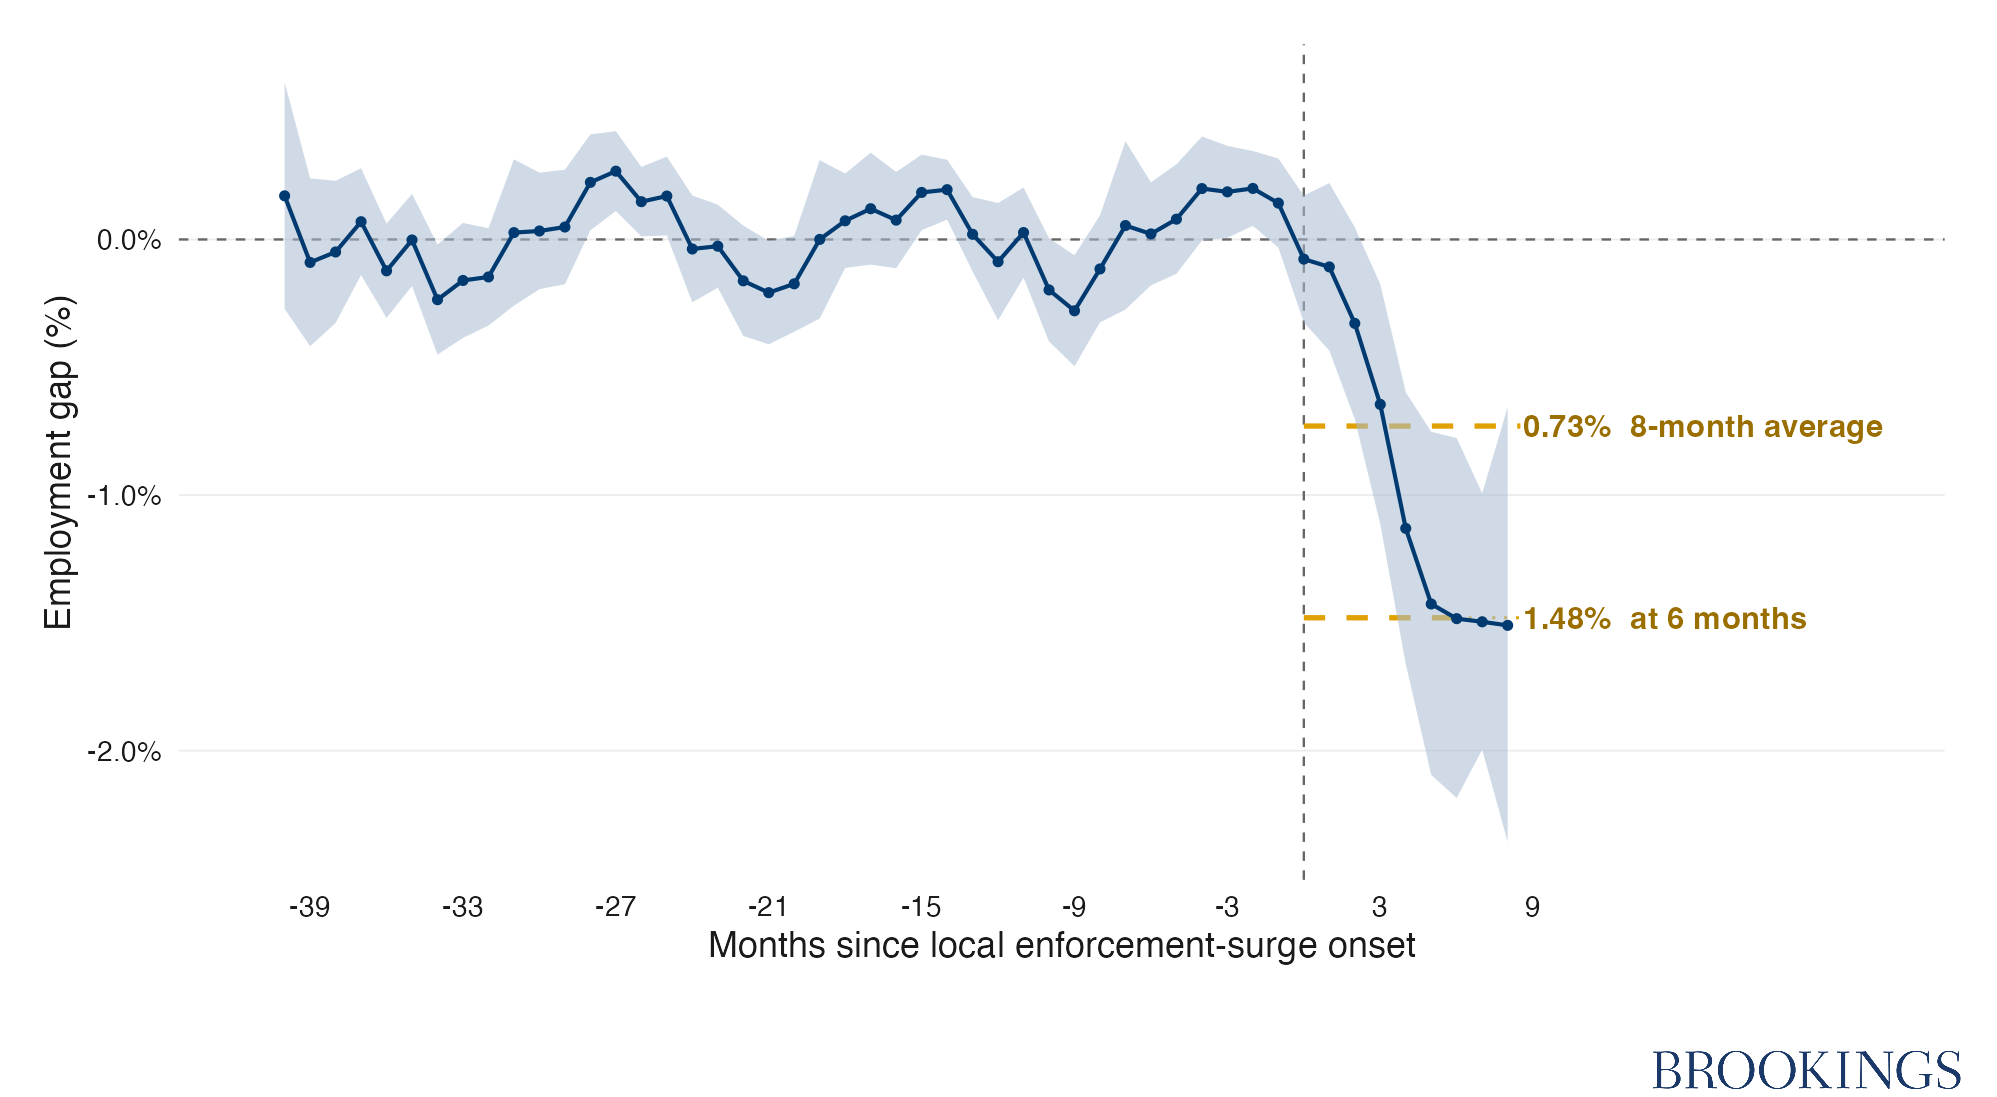 Note: Each point in the figure shows the estimated difference between employment in surge cities versus non-surge cities in the months before and after the local enforcement surge (month 0). Post-surge values below zero indicate that surge cities had lower employment than they would have been expected to have absent the enforcement surge. Shaded areas indicate 95% confidence interval.
Source: Lightcast monthly city employment. Callaway Sant’Anna staggered difference in difference. Treated cities are those whose Jan–Jun 2025 arrest surge fell in the top 25%.
Figure 3 presents the core statistical result: Each point shows the estimated gap in employment between surge cities and non-surge cities at a given number of months before or after the local enforcement surge, after removing any pre-existing trend differences between the two groups. Points to the left of zero show that the two groups were tracking closely for three years before enforcement. Points to the right show that surge cities fell increasingly behind after enforcement began. The gap, averaged across all post-surge months, is -0.73%; among the 51 cities observed for at least six months out, it reaches -1.48%.
Job losses far exceed arrests
The most striking feature of our results is the gap between the number of arrests and the number of jobs lost. Ostensibly, ICE targeted undocumented immigrants, but the economic fallout reached much further.11 Even if every single person arrested had been employed, their removal from the workforce alone cannot explain the total number of jobs lost in these communities. Three broad forces explain these excess job losses.
First, as discussed above, fear spread further than enforcement did. The chilling effect caused by the “shock and awe” tactics of the 2025 enforcement surge sent a message heard clearly by immigrant workers, regardless of their legal status. Immigrant workers who were never targeted stopped reporting to work, started avoiding public spaces, and postponed travel. A 2025 survey found that concern over potential detention increased most among lawfully present immigrants (rising from 33% to 50%) and naturalized citizens (from 12% to 31%) compared to 2023. One-third of documented immigrants reported avoiding activities outside their home, including going to work.
Second, earlier evidence suggests businesses do not quickly replace missing workers when facing sudden labor shortages (Charlton and Kostandini, 2020). When a food processing plant, for example, loses a critical mass of its crew overnight, it cannot instantly pivot to recruit and retrain a new workforce. Instead, it scales back production, alters operations, or even shuts down entirely. When this happens, Americans working in adjacent and interdependent roles also lose their jobs (Chassamboulli and Peri, 2014). This knock-on effect has been well documented in earlier enforcement periods (Lee et al., 2017; East et al., 2023; Clemens et al., 2018). For example, in 2019, ICE arrested 680 workers across seven Mississippi poultry plants in a single day. Many people who were not arrested also lost their jobs, and the raids severely harmed the regional economy for years as local consumption plummeted. More recently, in the summer of 2025, ICE raided a meatpacking plant in Omaha, Nebraska, and arrested about 70 workers. In the days and weeks that followed, many of the remaining staff stayed home from work, and the plant’s output fell by nearly 70%.
Third, when ICE removes workers, it also suppresses demand for goods and services. People, many of whom have no direct contact with ICE, stop going out, and they spend less money (East et al, 2023). A 2025 survey found that one in six Americans reported avoiding public venues due to immigration enforcement concerns. The share rose to one in four among Hispanic adults, with visits to bars, entertainment venues, and malls all declining. Another study finds that in Los Angeles, spending fell 20-25% in neighborhoods with high concentrations of foreign-born residents in the two months following an announcement of ICE enforcement in the area. Hernandez (2026) uses cell phone and credit card data to show that ICE enforcement caused an estimated 2.9% decline in foot traffic and 6.9% decline in spending, equivalent to 8.1 billion fewer visits and at $3.1-$14 billion in foregone spending. He also shows that the effects increased over time, that local businesses are hurt more than chain stores, and, interestingly, that the decline in spending does not depend on the demographic profiles of visitors nor on the demographics of neighborhoods in which stores are located.
Local businesses feel the effect of ICE enforcement: Restaurants lose customers, events get canceled, and retail sales drop. This channel explains some of the sector-level effects documented in the next section, where employment drops sharply in sectors such as arts and entertainment that employ only a small share of immigrant workers.
It is tempting to think of enforcement in simple, one-to-one terms: One person deported, one job vacated, perhaps one job freed up for someone else. But that framing does not account for the three forces described above, nor is it borne out in the data. ICE arrests did not create jobs for Americans. Instead, early 2025 ICE raids shrank local economies and destroyed jobs, at least in the short run.
4. Sector-level effects show mechanisms driving job loss
The overall job losses described in the previous section spread unevenly across sectors. Some sectors, like construction, were hit harder than their likely undocumented workforce share would predict.12 Others, like arts and entertainment, were affected despite having a small, likely undocumented workforce. These patterns are consistent with the three mechanisms outlined above: direct labor supply shocks, operational disruptions, and suppressed local demand.

Figure 4 shows how we apply the same methods described in Section 2 to specific sectors. The figure compares total employment losses to employment losses in construction across all cities that experienced a surge in ICE enforcement. Whereas total employment losses level out at about 1.48%, losses in construction are deeper, leveling out at nearly 4%. Averaging out the effect in sector-level employment across all 86 surge cities, over the eight months following a surge in ICE enforcement, gives the estimates shown in Figure 5. That figure shows that in the months following a surge in ICE enforcement, employment losses in construction averaged 2.2%, equivalent to 102,000 jobs across all 86 surge cities.13 That employment loss is comparable to 0.73% city-wide employment as described in the previous section.
Figure 5. Employment losses vary by sector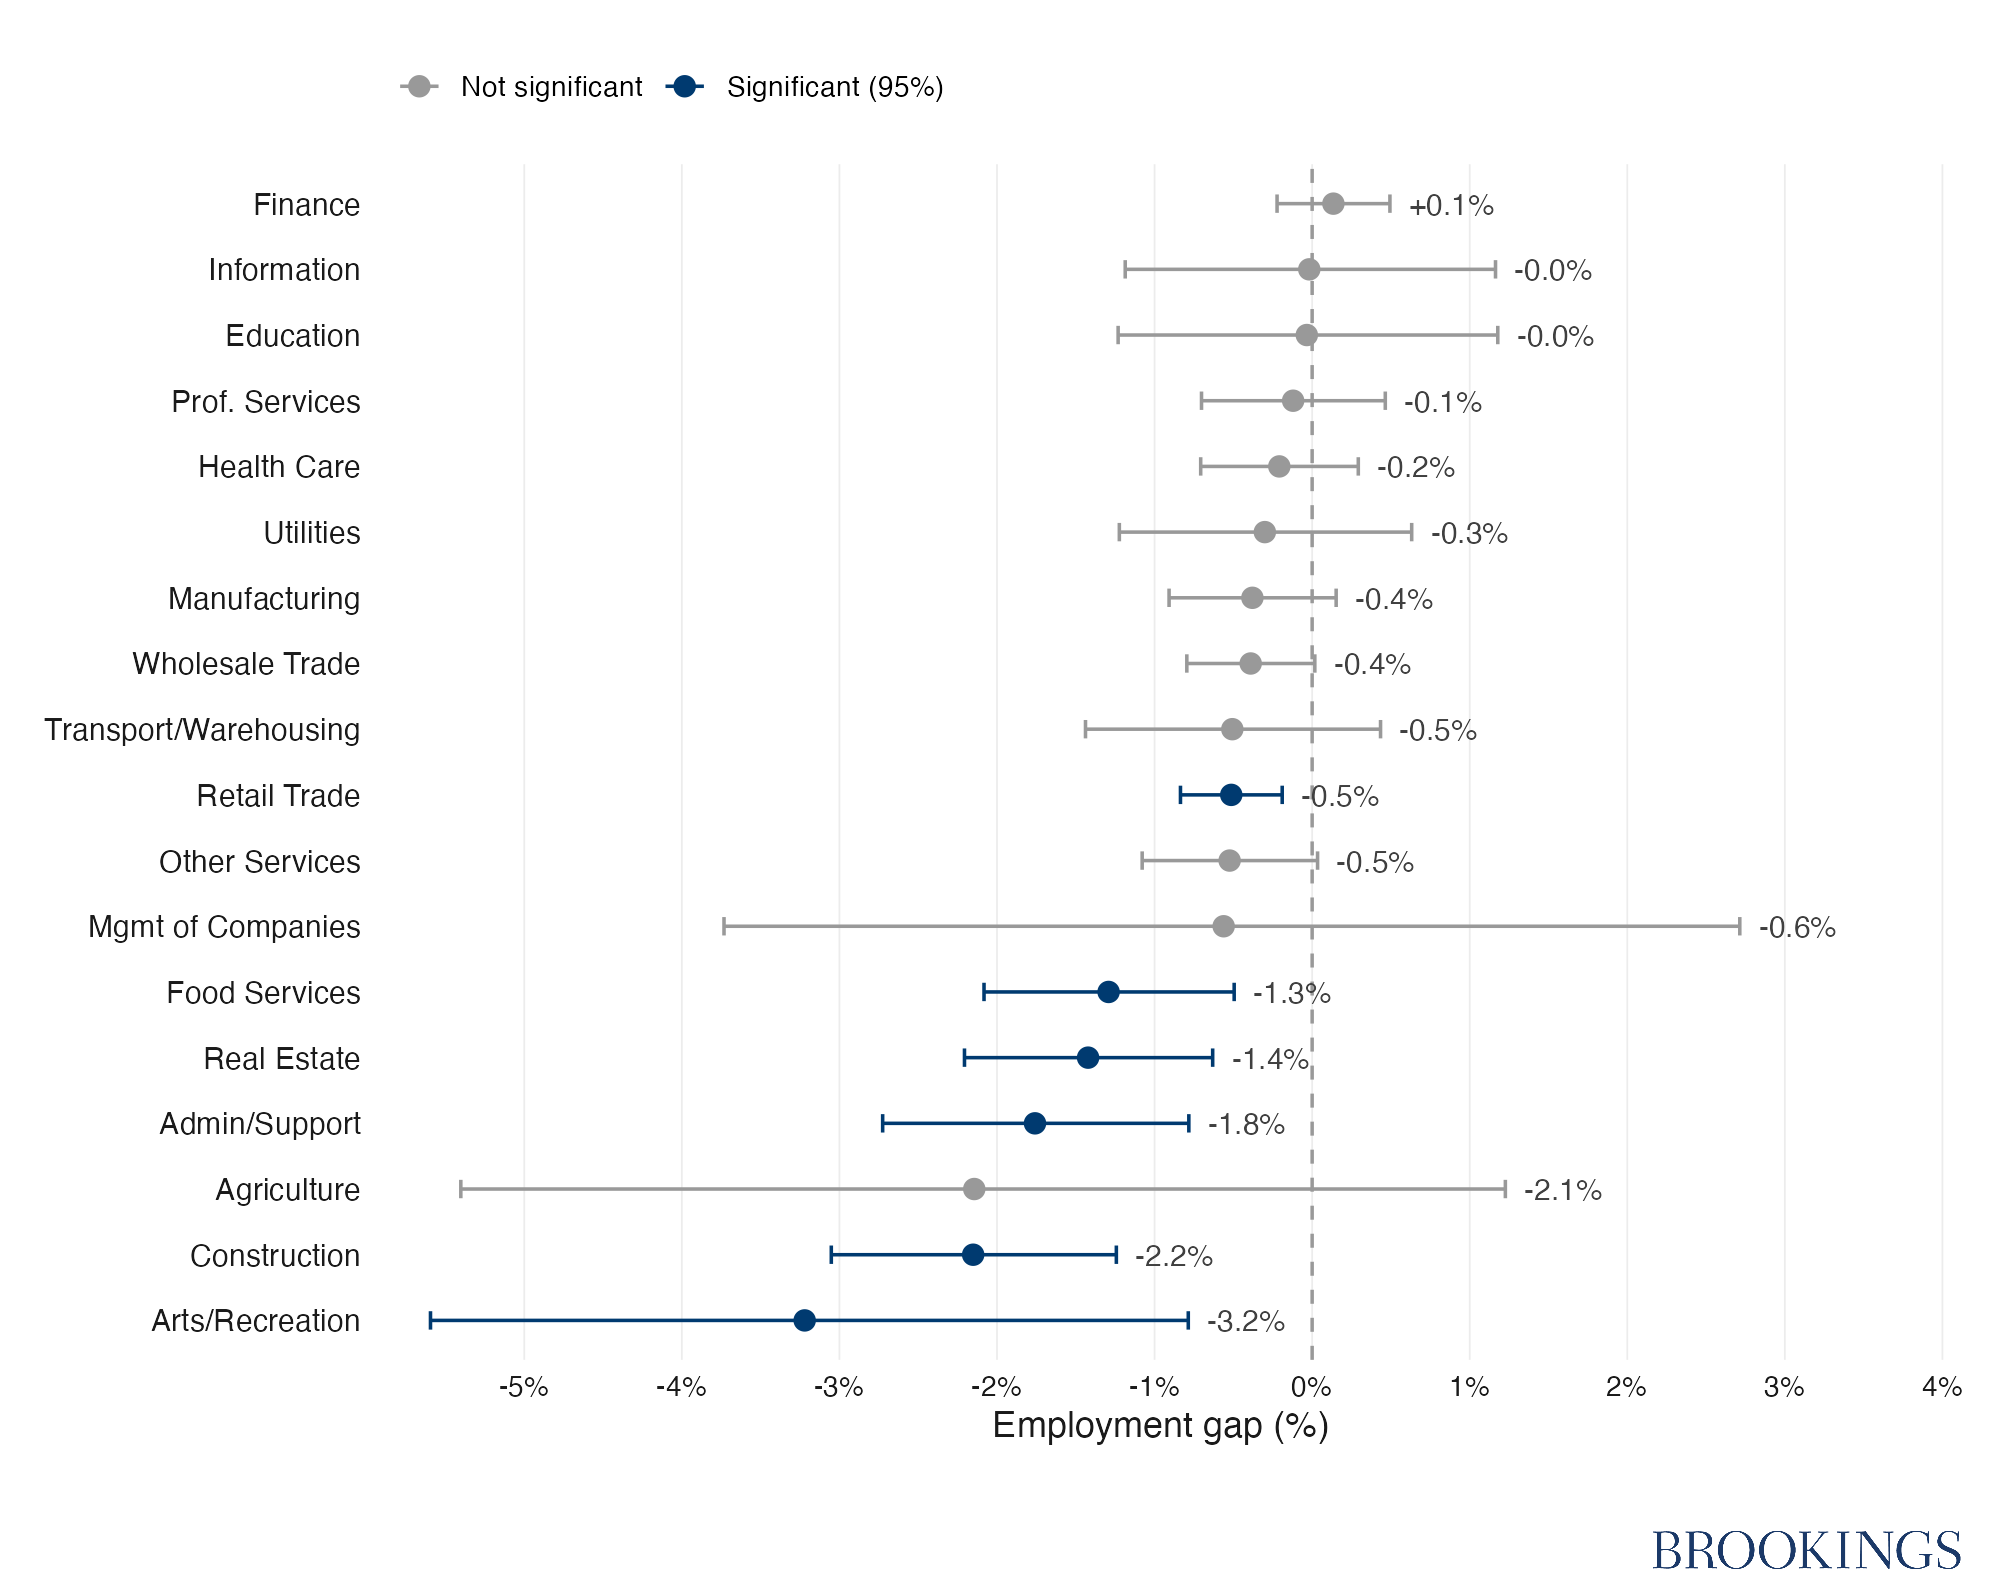 Note: Each point in the figure shows the estimated difference between sector employment in surge cities versus non-surge cities, averaged over the months following local enforcement surges. Values below zero indicate that sectors in surge cities had lower employment than would have been expected absent the enforcement surge.
Source: Lightcast monthly cities employment. Each row: estimated employment effect for the sector, averaged across treated cities and the post-surge window.
A baseline for comparison
To put the sector results in context, consider what we would expect to see if enforcement had affected every industry in the same proportion to its likely undocumented workforce share. Under that uniform removal scenario, we would expect job losses to be largest where likely undocumented workers are most concentrated and smallest where they are least concentrated. Construction, for example, employs roughly 27% likely undocumented workers in our sample of cities; a sector with only 9% likely undocumented workers should, under this logic, be hit about one-third as hard. We use this uniform removal scenario as a reference point and ask: Which sectors lost more jobs than uniform removal would predict, and which lost fewer?
Figure 6 maps each sector’s observed job loss against this expected baseline. It shows that four sectors experienced job loss deeper than a uniform removal of their likely undocumented workers would predict, meaning they suffered excess losses that direct workforce removal cannot fully explain.
Figure 6. Some sectors lost more jobs than their likely undocumented share predicts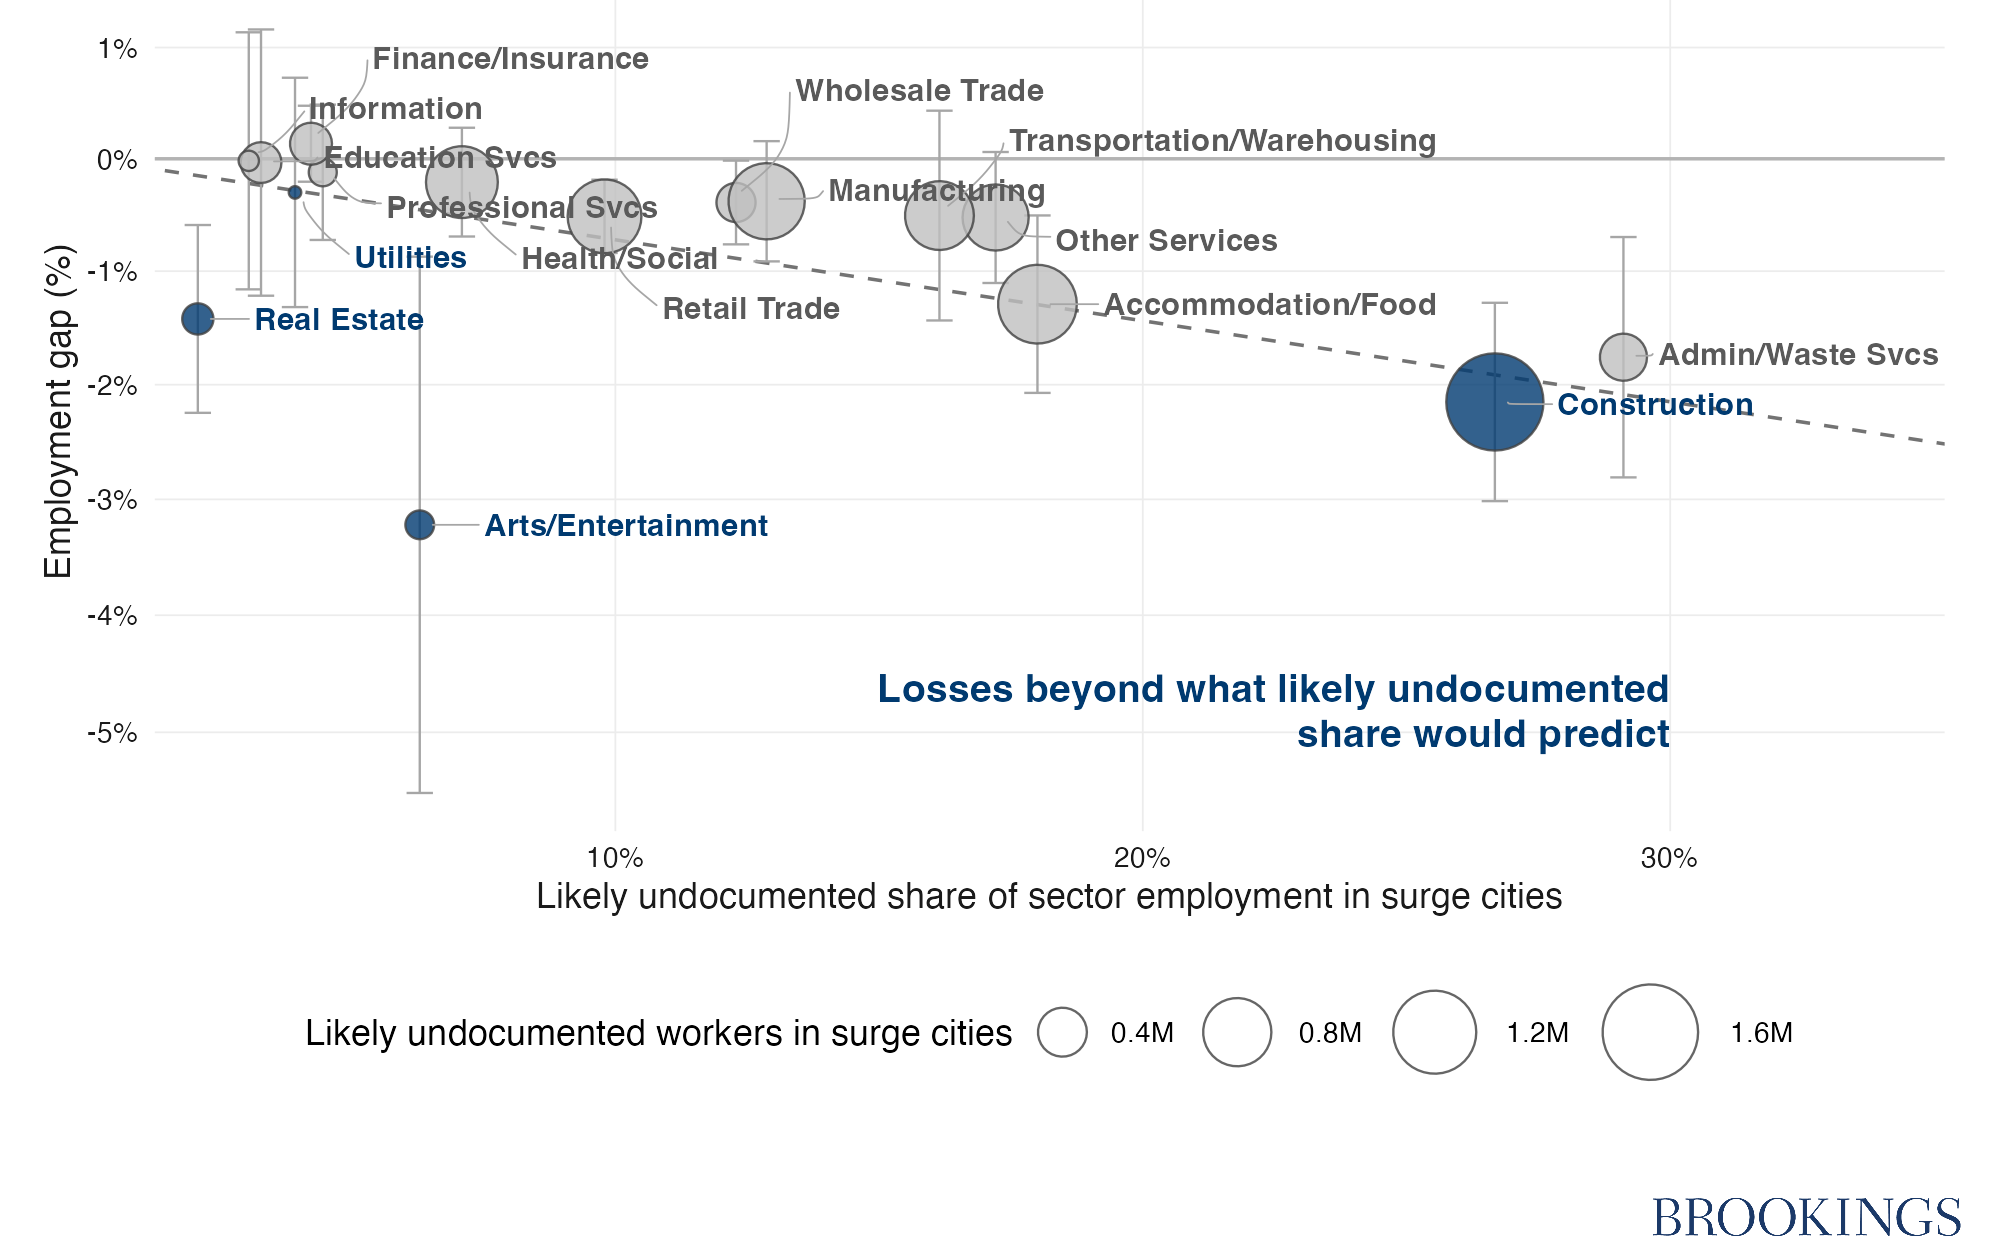 Note: Each point in the figure shows the estimated difference between sector employment in surge cities versus non-surge cities, averaged over the months following local enforcement surges. Sectors below the dashed benchmark line lost more jobs than proportional removal predicts. Area of the circles indicates likely undocumented employment in millions.
Source: Lightcast monthly city employment; ACS 5-year sector share estimates based on CBSA in the panel.
Construction experiences excess job losses even greater than what one might predict based on the large share of likely undocumented individuals it employs. The losses in that sector suggest that enforcement did not just remove workers in proportion to their presence; it disrupted operations in ways that cost additional jobs beyond what simple removal would explain. But the excess job losses we observe are consistent with the way construction operates. Crews are specialized, and projects are interdependent. A framing crew cannot hand off to a roofing crew if the framing crew is suddenly missing half its workers. And firms cannot quickly replace missing workers without delaying or canceling work altogether. When that happens, job losses can ripple outward to affect everyone working on the project, hitting project managers, equipment operators, electricians, and building inspectors—roles predominantly filled by American workers.
Howard et al. (2025) traced this mechanism in their study of the impacts of Secure Communities. They find that immigration enforcement reduced construction employment for American-born workers and slowed homebuilding enough to raise new-home prices. That same mechanism appears to be operating today. A recent industry-led survey of construction firms found that 45% reported project delays attributable to ICE-related labor shortages, and one in five reported that subcontractors had lost staff directly due to fear of enforcement. Such delays are likely to be felt by homebuyers and renters.
Accommodation and food services show declines nearly on par with what their likely undocumented workforce shares would predict (Figure 6). This sector shares features with construction that make it especially vulnerable to sudden labor disruptions, thin operating margins, workers who are difficult to replace on short notice, and business models that depend on consistent staffing. A National Restaurant Association survey found that 18% of restaurant operators reported employees not coming to work because of immigration enforcement, and 55% reported an overall negative impact from ICE enforcement. From Los Angeles to Washington, D.C., a significant number of restaurant workers resigned, requested leave, or simply did not show up to work out of fear.
The demand channel: Sectors with little direct exposure to ICE
The excess job losses we observe in the Arts and Entertainment sector tell a different story. This is not a sector especially likely to have seen its workers arrested by ICE. Likely undocumented workers make up a relatively modest fraction of employment in theaters, concert venues, and stadiums. Nor is it a sector where a relatively small number of missing workers can collapse an entire project, like in construction. The more plausible explanation for excess job losses is suppressed demand: ICE enforcement reduced the number of people going out, attending events, and visiting businesses.14
As referenced in the previous section, surveys and studies of cell-phone location data show that following enforcement surges, large numbers of people stopped going to public places, avoided entertainment venues, and reduced their spending in stores. When enforcement fills the news and social media feeds, when people see videos of ICE agents making dramatic arrests in public spaces, a share of the population simply stops going out. When that happens, businesses in this sector lose customers and revenue, and they cut staff. Here, job losses occur because immigration enforcement reduces consumer demand.
It is also worth noting which sectors did not show excess losses. Like the Arts and Entertainment sector discussed above, professional services, information, and utilities, employ few likely undocumented workers. However, these sectors are not sensitive to foot traffic or discretionary spending patterns. The null results in those sectors (shown in Figures 5 and 6) serve as an informal check on our results. If the patterns we observe were driven by some broader trend affecting surge cities, we would expect them to show up in these sectors too. They do not. This finding is consistent with research by East et al. (2023) on Secure Communities, which found that nontradable local services absorbed a disproportionate share of the employment losses driven by enforcement.
Taken together, the sector-level results are consistent with the forces described at the end of Section 3: (1) A direct labor supply shock as immigrants are removed or stop reporting to work; (2) a business disruption channel, most visible in construction, where the loss of specialized workers cascades through entire projects; (3) and a local consumer demand channel, most visible in Arts and Entertainment, where fear kept people home and spending fell. The result was job losses far greater than the number of people arrested.
Box 1: A lower and upper bound on jobs lost by American-born workers
QCEW data do not allow us to directly observe which missing jobs would have been held by American-born workers. We apply results from Cox and East (2026)’s analysis of the Current Population Survey (CPS) to estimate a lower and upper bound. See the summary table below.
Lower bound. We begin with ACS counts of American-born, high-school-or-less male workers employed in the four sectors Cox and East study (agriculture, construction, manufacturing, and wholesale) within our treated cities (roughly 3.9 million workers). Cox and East estimate that ICE activity reduced the employment rate of this group by 1.3%, implying roughly 50,620 jobs lost that would have been held by American-born workers. This is a lower bound primarily because Cox and East’s estimate applies only to a narrow group. But other groups likely also suffered job loss due to the forces described in this paper.
Upper bound. Not all the 668,000 jobs lost due to ICE surges were held by American-born workers. To estimate how many were held by undocumented workers, we multiply the QCEW baseline employment in treated CBSAs (roughly 90.9 million) by our ACS-estimated likely-undocumented share of employment in those cities (10.2%) and by Cox and East’s estimated reduction in employment among likely-undocumented workers (4.0%). If we conservatively assume that the chilling effect on likely undocumented workers is completely observed in formal jobs, subtracting that estimate of jobs lost by undocumented workers from our estimate of total jobs lost gives an upper bound of about 297,000 jobs lost by American-born workers. Out of our estimate of the total job loss, this is an upper bound because it attributes all remaining losses (beyond undocumented workers) to American-born workers, without deducting job losses among authorized workers, foreign-born Americans, or workers who left the country and thus are not captured in either the CPS or the QCEW.
Comparing methods
It is worth noting how the datasets underlying our respective analyses pair with one another to offer a richer picture. The QCEW, derived from employer-reported data, offers estimates of formal job numbers with rich geographic and sectoral resolution, but the data do not distinguish jobs held by American-born workers. On the other hand, CPS data comes from monthly surveys of individuals. It captures rich information on respondents, enough to allow reasonable guesses of legal status. But as Kolko (2025) details, the CPS is unreliable for estimating employment levels and population changes because totals are anchored to Census population controls predetermined in 2024, while estimates of foreign-born and likely undocumented workers have become less reliable as response rates have declined.
Together, the analyses show that, of the total job loss we estimate, the true number of jobs lost that would have otherwise been held by American-born workers likely lie within the range of 51,000-297,000 jobs.

5. Discussion
The 2025 enforcement surge was sold, in part, as a way to help American workers. The underlying logic is not difficult to follow: if undocumented immigrants occupy jobs in the United States, removing them should open those positions for American-born workers. This argument has real resonance, particularly at a moment when many Americans are worried about automation, rising costs, and economic uncertainty.
Our findings, however, directly contradict this story. In the 86 cities that experienced a sharp rise in ICE arrests, employment fell below what one would have expected absent the enforcement shock, with losses spreading far beyond the workers directly arrested.
The reason is twofold. Local economies do not operate on a one-for-one logic in which removing one worker simply frees up one job for someone else. When firms suddenly lose workers they rely on, they often cannot replace them quickly enough to keep production on track. At the same time, highly visible enforcement triggered broader fear and withdrawal from economic life, reducing both labor supply and local demand. The sector-level results are consistent with that pattern: Losses were especially severe in several immigrant-intensive sectors, but they also showed up in places like arts and entertainment, where a drop in local spending is a more plausible channel than direct worker removal alone.
Our estimates capture effects on formal employment only in the cities where the surge in ICE enforcement was sharpest and only in the short run. The full economic toll on household finances, housing markets, local tax revenues, and businesses deterred from opening almost certainly runs deeper than what employment data alone can show.
Still, the policy implication is hard to avoid. The 2025 enforcement surge broke from prior practice, supported across Democratic and Republican administrations, of a measured and proportional combination of enforcement with an expansion of lawful pathways.
If the objective is to protect American workers and support resilient local economies, a wide-scale, “shock and awe” enforcement approach in American cities is a costly and counterproductive tool. Businesses in sectors like construction need predictability and stable workforces to take on projects, commit to timelines, and hire. Capricious enforcement that removes employees without notice is a source of economic volatility, the kind of uncertainty that causes businesses to pull back, delay investment, and reduce employment.
Enforcement at this scale and speed—visible, shocking, designed to produce fear beyond the directly targeted population—destroys jobs, disrupts businesses that Americans own and run, and depresses the local economies in which Americans live and work. Any policy that aims to improve labor market outcomes for American workers must reckon with this evidence.
Authors


References
Alsan, M., & Yang, C. (2024). Fear and the safety net: Evidence from Secure Communities. Review of Economics and Statistics, 106(6), 1427–1441. https://doi.org/10.1162/rest_a_01250
Amuedo-Dorantes, C., & Antman, F. M. (2022). De facto immigration enforcement, ICE raid awareness, and worker engagement. Economic Inquiry, 60, 373-391. https://doi.org/10.1111/ecin.13041
Callaway, B., & Sant’Anna, P. H. C. (2021). Difference-in-differences with multiple time periods. Journal of Econometrics, 225(2), 200-230. https://doi.org/10.1016/j.jeconom.2020.12.001
Charlton, D., & Kostandini, G. (2020). Can technology compensate for a labor shortage? Effects of 287(g) immigration policies on the U.S. dairy industry. American Journal of Agricultural Economics, 103(2), 1-20. https://doi.org/10.1111/ajae.12125
Chassamboulli, A., & Peri, G. (2014). The labor market effects of reducing the number of illegal immigrants (NBER Working Paper No. 19932). National Bureau of Economic Research. https://www.nber.org/papers/w19932
Clemens, M. A., Lewis, E. G., & Postel, H. M. (2018). Immigration restrictions as active labor market policy: Evidence from the Mexican Bracero exclusion. American Economic Review, 108(6), 1468-1487. https://doi.org/10.1257/aer.20170765
Cox, E., & East, C. N. (2026). Labor market impacts of ICE activity in Trump 2.0 (NBER Working Paper No. 35129). National Bureau of Economic Research. https://www.nber.org/papers/w35129
Deportation Data Project. (2025). ICE ERO arrest records [government data provided by ICE in response to FOIA request]. https://deportationdata.org
East, C. N., Hines, A. L., Luck, P., Mansour, H., & Velásquez, A. (2023). The labor market effects of immigration enforcement. Journal of Labor Economics, 41(4), 957–. https://doi.org/10.1086/721152
Hernandez, Exequiel. (2026). “ICE-ing the Economy: Immigration Enforcement Under Trump 2.0.” SSRN Working Paper. Revised May 22, 2026. https://doi.org/10.2139/ssrn.6759278
Howard, T., Wang, M., Zhang, D. (2025). Cracking down, pricing up: Housing supply in the wake of mass deportation. Available at SSRN. https://doi.org/10.2139/ssrn.4729511
Kolko, Jed. (2025). “That Reported Multi-Million Decline in US Immigrants Just Doesn’t Add Up.” Peterson Institute for International Economics, Realtime Economics (blog). Peterson Institute for International Economics. https://www.piie.com/blogs/realtime-economics/2025/reported-multi-million-decline-us-immigrants-just-doesnt-add
Lee, J., Peri, G., & Yasenov, V. (2017). The employment effects of Mexican repatriations: Evidence from the 1930s (NBER Working Paper No. 23885). National Bureau of Economic Research. https://www.nber.org/papers/w23885
Lightcast. (2025). Monthly metro employment series [dataset]. https://lightcast.io
Massey, D. S. (2020). The real crisis at the Mexico-U.S. border: A humanitarian and not an immigration emergency. Sociological Forum, 35(3), 787-805. https://doi.org/10.1111/socf.12613
Ruggles, S., Flood, S., Sobek, M., Backman, D., Cooper, G., Rivera Drew, J. A., Richards, S., Rogers, R., Schroeder, J., & Williams, K. C. W. (2025). IPUMS USA: Version 16.0 [dataset]. Minneapolis, MN: IPUMS. https://doi.org/10.18128/D010.V16.0
Watson, T. (2014). Inside the refrigerator: Immigration enforcement and chilling effects in Medicaid participation. American Economic Journal: Economic Policy, 6(3), 313-338. https://doi.org/10.1257/pol.6.3.313
-
Acknowledgements and disclosures
The authors thank Michael Clemens for thought partnership and insights on methods, Tara Watson, Stan Veuger, and Greg Wright for helpful comments. Alvaro Morales provided outstanding research assistance, including fact-checking, code review, and replication of our findings. All errors remain our own.
-
Footnotes
- White House immigration enforcement coordinator Tom Homan used the phrase “shock and awe” to describe the administration’s immigration strategy.
- The pairing of interior enforcement with lawful work authorization has had bipartisan support from the Reagan administration’s sweeping 1986 reforms through the Bush and Obama administrations.
- This paper uses arrests made “at large” meaning they took place in the community. We define excess arrests as the cumulative (at large) arrests after a surge, beyond what would have occurred otherwise, assuming 2024 trends in the 86 cities experiencing the sharpest surge. Those 86 cities, referred to as “surge cities”, comprise the top quartile of surge arrest cities, out of 341 total cities in our sample. See Appendix A3.
- See Figure 3. We measure city employment for as few as three and for up to eight months after an ICE surge. Averaging effects over as many months as data allows over the 86 surge cities gives an average effect of an ICE surge on city employment of -0.73%.
- East et al. (2023) gives a detailed description of SC mechanics.
- Secure Communities generated approximately 363,400 removals over nearly a decade from 2008 to 2017, with a pause after 2014. In FY 2012, the peak year of SC, it generated about 83,600 removals. In FY 2025, ICE reported 319,980 removals.
- Additionally, Aslim et al. (2026) show that the 2025 enforcement surge reduced employment of immigrant women in center-based childcare and shifted work into less-visible private household settings without replacement by native-born workers, while De Balanzó et al. (2026) find a roughly 1.7 percentage point decline in aggregate consumer spending in high-enforcement states. Sojourner and Rosenthal (2026) document substantial hospitality and construction job losses in Minneapolis–Saint Paul following Operation Metro Surge, and Wu and Li (2026) provide complementary evidence on broader community-wide economic costs of the new enforcement era, all consistent with broad labor market and demand-side disruptions from heightened ICE activity that align with our city-level payroll evidence.
- The geographic unit of analysis is core-based statistical areas, referred to as cities for readability.
- See Appendix A2. We map each ice arrest record to a city through a multi-stage pipeline combining a curated crosswalk between ICE office codes and their service area counties, n-gram matching, OpenStreetMap geocoding, and for records lacking specific detail or reference to an ICE sub-office, proportional allocation across the AOR-state or ICE office jurisdiction, weighted by foreign-born population and the distribution of other arrests in the panel.
- For example, in Denver and Oklahoma City ICE enforcement surged in January 2025, so we can follow employment outcomes for eight months (February to September, the latest month for which employment data is available). In Kansas City and Birmingham ICE enforcement surged in June, so we can only follow employment outcomes for three months. The figure 0.73% reflects average employment loss among all 86 surge cities across all post-surge months for which employment data is available.
- This pattern is consistent with findings on earlier enforcement periods. In addition to findings discussed in Section 2, Amuedo-Dorantes and Antman (2022) find that awareness of ICE raids (not just actual deportations) is associated with reduced labor force participation and employment among likely undocumented immigrants, with effects concentrated in industries historically targeted by ICE.
- Likely undocumented workers are foreign-born workers aged 20–64 with a high school degree or less. This is a standard proxy used in literature because documentation status is not asked in Census surveys. See East et al. (2023).
- 2.2% job loss times construction baseline employment across 86 surge cities of 4,763,000 approximates the number of jobs lost in construction.
- Appendix B shows the result of excess job losses in Real Estate is driven by excess losses in the subsector Rental and Leasing, which encompasses activities such as rentals of trucks, consumer goods, appliances, formal wear, costumes, and construction equipment: all types of businesses vulnerable to reductions in local spending and community activity.
The Brookings Institution is committed to quality, independence, and impact.
We are supported by a diverse array of funders. In line with our values and policies, each Brookings publication represents the sole views of its author(s).