
Introduction
Last June’s Supreme Court decision in cases brought by Students for Fair Admissions (SFFA) against Harvard College and the University of North Carolina at Chapel Hill (UNC) significantly curtailed colleges’ ability to consider race or ethnicity in admissions. However, the ruling left open the possibility that colleges could substitute class-based “affirmative action” for race-based affirmative action to maintain racial diversity, an idea that some have promoted as a fairer alternative.1 After all, Black, Latino, and American Indian/Alaska Native (AIAN) students are over-represented among those growing up in lower-income families or who would be the first in their families to graduate from college (“first gen”).
In this report, we use data from the 2015-2016 National Postsecondary Student Aid Survey (NPSAS) to better understand the viability of using class-based affirmative action as a replacement for race-based affirmative action. Could such an approach maintain racial diversity? How much would it cost?
Our simulations suggest a university policy providing a substantial “admissions bump” to lower-income applicants might help maintain racial and ethnic diversity at selective colleges but only if a large number of students were enrolled because of that advantage. Policies favoring first gen students or more modest policies favoring lower-income recipients would be less effective at doing so.2 These conclusions are based on our analysis of institutions that are moderately to extremely selective.
However, more selective institutions within that group will have even more difficulty maintaining racial diversity using class-based affirmative action.3 Critically, we show that admitting and enrolling more lower-income students would require a substantial increase in the financial aid budgets of selective colleges. These institutions use their own resources to provide financial aid for existing students, but that support is already inadequate to meet the financial need of students at many institutions. Collectively, selective institutions would need to double their institutional support for financial aid to meet the full financial need of students enrolled under the current system. A class-based affirmative action plan would entail enrolling many more lower-income students, which would increase the need for financial aid further. Our simulations indicate that institutions would need to almost triple their spending on financial aid to meet all of the financial need of enrolled students under a strong class-based affirmative action policy. This may be an insurmountable hurdle to overcome, reducing the likelihood that lower-income students would be able to enroll even if admitted.
Enrolling more lower-income and first-gen students is an important goal, separate from the impact on racial and ethnic diversity. Most selective colleges do not enroll many lower-income students, who offer unique and diverse perspectives that could enhance the educational experience of all students. Research also shows that lower-income students benefit more from attending selective colleges compared to their more-advantaged peers. Whether class-based affirmative action is pursued for its own sake, to maintain racial diversity, or a combination of the two, the implications for financial aid are considerable. It cannot be successful without increasing financial aid budgets considerably.
Overall, our analysis shows that selective colleges could use class-based affirmative action to make progress in maintaining racial diversity after the SFFA ruling, but it will be difficult to achieve. Ultimately, class-based affirmative action is considerably less efficient at achieving racial diversity than race-based affirmative action, and it cannot succeed without a considerable infusion of funding to help cover the greater need for financial aid. Perhaps a handful of institutions have endowments large enough to support the necessary increases in financial aid, but most do not. If selective colleges adopted class-based affirmative action policies aggressive enough to maintain racial diversity, many institutions would struggle to find the necessary funds to support more low-income students without threatening their academic mission.
New class-based affirmative action simulations
We are not the first to simulate the impact of class-based affirmative action policies. For the most part (although not universally), previous studies find that such a policy would not be successful in maintaining enrollments of Black and Latino students at the same levels achieved by race-based affirmative action policies. In this section, we discuss prior studies and compare them to the approach we take in our analysis.
We know from past research (and our own intuition) that affirmative action policies are only relevant at more selective institutions. Those that practice open-enrollment or accept a high percentage of applicants typically admit all students who meet basic eligibility requirements. Existing studies therefore focus on the most selective institutions. Beyond that, though, some studies focus on specific institutions, like UNC and Harvard because of their involvement in the SSFA litigation. These institutions are extremely selective. Others examine national samples and admission or enrollment at a broader set of selective institutions.
We focus here on enrollment in selective institutions, defined in the data we use as those in the top quartile of test scores and admissions rates among institutions that do not use open enrollment. They are broadly less selective than the elite colleges that only accept a small share of applicants and whose students score very highly on standardized exams (such as Harvard or UNC). Going forward, we refer to them as “selective” colleges.
Past studies also differ in the types of race neutral affirmative action programs they simulate. Alternative policies include those that provide an “admissions bump” for applicants from lower-socioeconomic status (SES) families typically defined by factors like income, educational attainment, and occupational status; those that provide admissions to students in the top percentiles of their high school class; and combinations of the two. In our analysis, we simulate policies that target lower-income or first-gen students. We do not consider top percentile policies since they are mainly viable at public institutions, and we are interested in both public and private institutions.
A final distinction is the magnitude of the affirmative action policies considered: How large an admissions bump do targeted applicants receive in the simulated system? Simulations of policies that provide a very large admissions bump for lower-SES students suggest the enrollment of Black and Latino students might be maintained. In our analysis, we simulate policies of different magnitudes to better understand their role in enrollment outcomes.
We use data from the 2015‒2016 NPSAS for this purpose. These data provide a more recent snapshot compared to most previous simulations using national data.4 Other more recent analyses focus specifically on the SFFA case and the experiences of Harvard and UNC. Updating these earlier national analyses is one of the contributions of this research.
These data include information on over 89,000 enrolled undergraduate students along with sampling weights that allow us to make nationally representative estimates. The data do not cover the universe of high school graduates, only those who are enrolled in some post-secondary education. For our purposes, this is not a major concern, because few students with academic records sufficient to be admitted to more-selective institutions do not enroll in any college. We limit our analysis to dependent undergraduates enrolled full-time who started college in the fall of 2015. Over three-quarters of enrolled students in selective institutions satisfy these conditions.5
These data include detailed information on the institution in which students are enrolled, the cost of those institutions, family finances, students’ high school GPA (reported in categories: 3.5 to 4.0, 3.0 to 3.5, and so on), college entrance exam scores (ACT composite scores are translated to SAT equivalent total scores), and self-identified race/ethnicity. We code race into mutually-exclusive categories: Asian and Pacific Islander (API – referred to below as Asian for simplicity), Black, Latino, white, and other (which includes students who identify as American Indian/Alaska Natives, Native Hawaiian/Other Pacific Islander, and those who identify with more than one race).6
The data also indicate whether a student received a Pell Grant, the main grant-based federal financial aid benefit offered to students from low-income families (the median income of a dependent Pell Grant recipient’s family is below $30,000 and 95% have incomes below $70,000). We use Pell Grant receipt as our main measure of growing up in a lower-income family. We assign “first gen” status to those students who do not have a parent that graduated from college with a four-year degree.
For our analysis of how class-based affirmative action would change the need for financial aid at selective colleges, we need to know what students’ can afford to pay, the financial aid currently available at selective colleges, and the full cost of attendance (known as COA, which includes tuition, room, board, fees, and other living expenses) at selective colleges.
Our calculation of what a student and their family can afford assumes the student is able to pay their “expected family contribution” (EFC), as calculated by FAFSA, directly to the institution (i.e., “write a check” for this amount). We also assume that students will borrow the maximum Federal Direct Student Loan (subsidized and unsubsidized, totaling $5,500 for freshman) and that they can use earnings from employment subsidized by the Federal Work-Study program.7 We refer to the total of these values as the “meet full need net price”—it is the price a student will pay if they get enough financial aid (which includes federal loans and work-study) to meet their need. While this calculation may not accurately capture the financial situation for every student and families may find it difficult to cover the EFC or prefer not to borrow, the meet full need price provides a reasonable benchmark for what students and their families can afford to contribute. When students are asked to pay more than this amount, they (or their parents) will generally need to borrow excessively or they may need to work too much to achieve the full benefit of their education.
Who attends selective colleges in the status quo?
Before turning to the simulations, we show how students currently enrolled in selective colleges differ from the broader population of high school graduates and those attending college more generally. Selective institutions are defined in the 2015-2016 NPSAS data as those in the top quartile of an index of admissions rates and test scores among institutions that do not have open enrollment. There are 153 institutions, enrolling about 277,000 of the 1.8 million newly enrolled, full-time dependent students (15%) at four-year colleges and universities in our sample.8
Students who attend selective colleges have substantially stronger academic qualifications, as expected. They are 28 percentage points more likely to have a high school GPA above 3.5 (on a 4.0 scale), and their average SAT scores are 191 points higher compared to the full sample of college students. Long-standing inequality and discrimination in schools and other domains contribute to racial disparities in academic preparation, and Black and Latino students are less likely to have the higher levels of grades and test scores typical of students enrolled in selective colleges compared to their white or Asian counterparts.
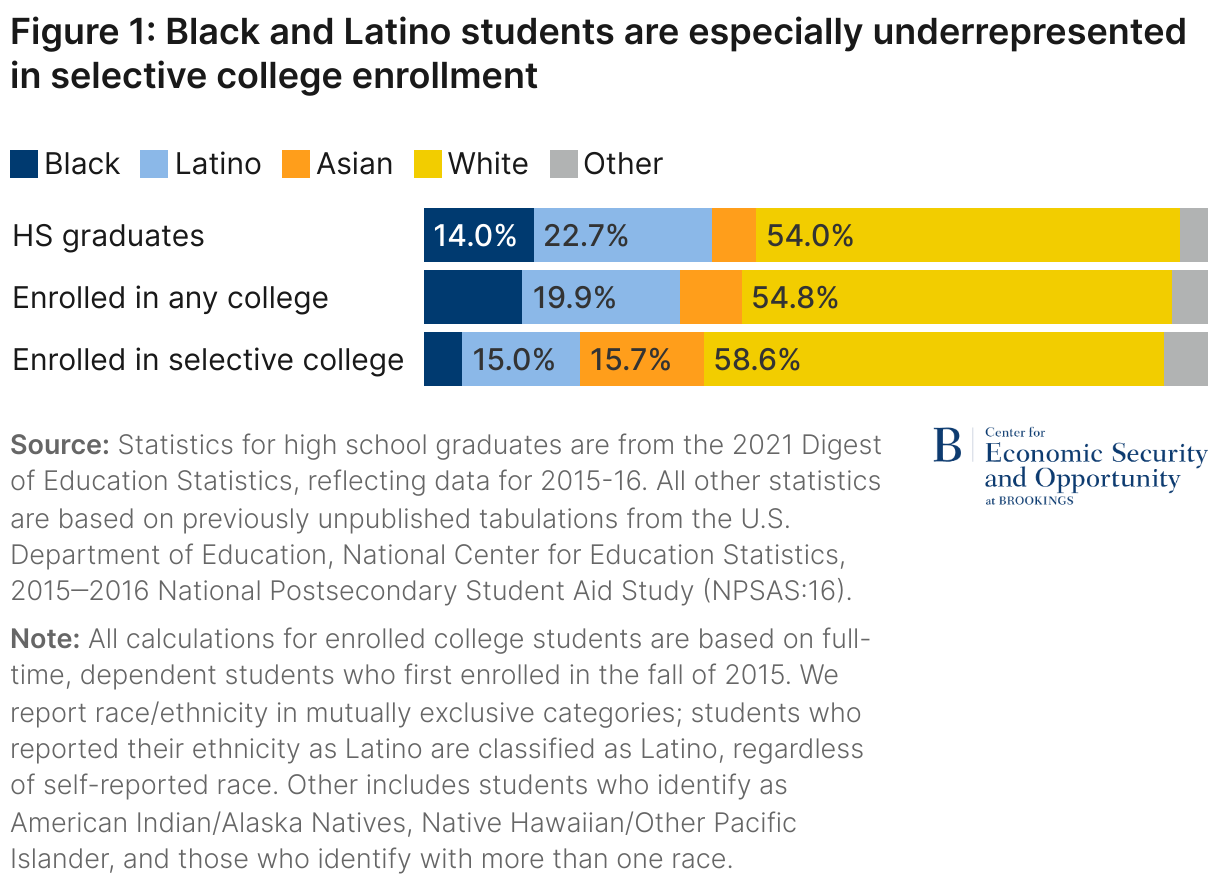
Figure 1 shows that Black and Latino students are under-represented among the college-going population, and especially at selective colleges (many of whom used race-conscious admissions in this period). White and especially Asian students are over-represented at selective colleges. For example, Black students comprise 14.0% of high school graduates, 12.7% of all college enrollment, and 5.0% of enrollment at selective colleges; Asian students comprise 5.7% of high school students, 7.9% of all college enrollment, and 15.7% of enrollment at selective colleges.
Simulating alternative admissions policies
Selective colleges consider a range of factors when they choose whom to admit. Ideally, we would use data on all of the factors institutions incorporate, including race, to rank students by their probability of admissions under the current system. Then we could “turn off” the racial preference to assess the impact of eliminating affirmative action. We could also add a bonus for Pell recipients or first-gen students, re-rank students, and see how the composition of top-ranked students changes. David Card performed such an analysis in his expert report on behalf of Harvard, but he had access to much richer data from Harvard’s admissions process than what is available in the NPSAS data we are using. We do not have information on the broad range of factors—such as the rigor of their academic curriculum, participation in extracurricular activities or athletics, legacy status, the characteristics of the high school the student attended, essays and letters of recommendations —that colleges might consider in a holistic admission process.
We use an approach conceptually similar to Card’s, but our ranking considers only high school GPA and test scores, simulating a system that relies exclusively on academic achievement. Those are the features of a students’ high school record available in our data. This approach eliminates the role played by nonacademic and other less quantitative factors. This could bias our estimates of the role that high school grades and test scores play in determining where students enroll. We discuss this issue further when we interpret the results of our analysis below.
Another limitation of our data is that we do not actually observe applications and admissions decisions, only enrollment.9 And our simulations do not consider geography; we assume any student is available to be enrolled in any college. Incorporating some geographic restrictions—for example, assuming at least some students stay in their home state or region—would likely make it more difficult to achieve racial diversity goals using class-based affirmative action than the simulations described below suggest. For many higher-income students, where they can be admitted is the primary determinant of where they attend. Such students typically enroll in the college they like the best (among those where they are admitted), which can be a function of a number of factors like institutional ranking, geography, cultural fit, and others. For lower-income students, those characteristics matter as well, but cost also tends to matter more than for higher-income students. While some selective institutions provide enough financial aid to “meet full need,” many do not. Indeed, we show below that many students who attend selective colleges have unmet financial need.
Because we observe enrollment and not admissions, we will likely overstate the ability of admissions policies to affect enrollment, especially among lower-income students. A class-based affirmative action program that increases the likelihood of admission for lower-income students may have a smaller impact on the likelihood of enrollment. Despite these limitations, we believe this analysis can still address the viability of using class-based affirmative action in place of race-based affirmative action and, importantly, provide estimates of the costs of such a policy.
All the simulations start with an index of academic qualifications based on high school GPA category and SAT/ACT scores.10 Our first simulation relies on this ranking exclusively to generate an alternative to the status quo based purely on these academic qualifications. In this simulation, we “enroll” the students in the top 15% of the distribution of this “academic index” to match the observed share of students enrolled at selective institutions.
Then we simulate a system where either Pell Grant recipients or first gen students get an admissions bump equivalent to a 100- or 200-point increase in their composite SAT score or ACT equivalent (bounded by 1600). We then recalculate the index of academic qualifications and, again, enroll the top 15% of students ranked by the index. We specify the admissions bumps in terms of test scores alone because we do not have access to a continuous measure of GPA, but a bump could be applied in terms of GPA (or any other measure) or implemented as part of a holistic admissions process.11
In practice, admissions committees might take this numeric approach, assigning extra points based on family income or other socioeconomic characteristics; for example, the University of Colorado at Boulder experimented with this approach over a decade ago.12 Or admissions committees might achieve something similar in holistic admissions. For example, University of California campuses consider applicants’ academic accomplishments in the context of the opportunities they have had, which effectively gives a bump to lower-income applicants compared to their higher-income counterparts with similar academic credentials. Even if most admissions committees wouldn’t take such a formulaic approach to increasing enrollment of lower-income or first gen students, these simulations can help us understand what more holistic approaches might achieve.
Who would be enrolled in selective colleges under alternative policies?
As described earlier, our analysis focuses on five alternative simulations:
- Ranking students solely based on test scores and grades—“Academic Only”
- Adding 100 points to the test scores of Pell Grant recipients—“Pell 100”
- Adding 200 points to the test scores of Pell Grant recipients—“Pell 200”
- Adding 100 points to the test scores of first generation students—“First Gen 100”
- Adding 200 points to the test scores of first generation students—“First Gen 200”
In each case, we re-rank students and “enroll” the top 15%.
Figure 2 presents the racial composition of students enrolled in selective colleges in the status quo and in the five simulated scenarios. In the status quo, about 5% of students enrolled in selective institutions are Black and 15% are Latino. In the “Academic Only” scenario those percentages would drop to 3.1% and 8.5%, respectively. The white share of enrollment would rise from 58.6% in the status quo to 70%, and the Asian share would fall slightly.13
The percentage of Black students and Latino students is higher in all the simulations based on class-based affirmative action policies than in the Academic Only scenario. The only policy, though, that roughly approximates the current racial and ethnic distribution of students is Pell 200, the policy that provides Pell Grant recipients with a 200-point bump in the SAT score. In that simulation, Black students and Latino students would comprise 4.8% and 13.7% of the classes of selective institutions, respectively, compared to 5.0% and 15.0%, respectively, in the status quo. None of the other simulated policies achieve similar levels of racial and ethnic diversity.
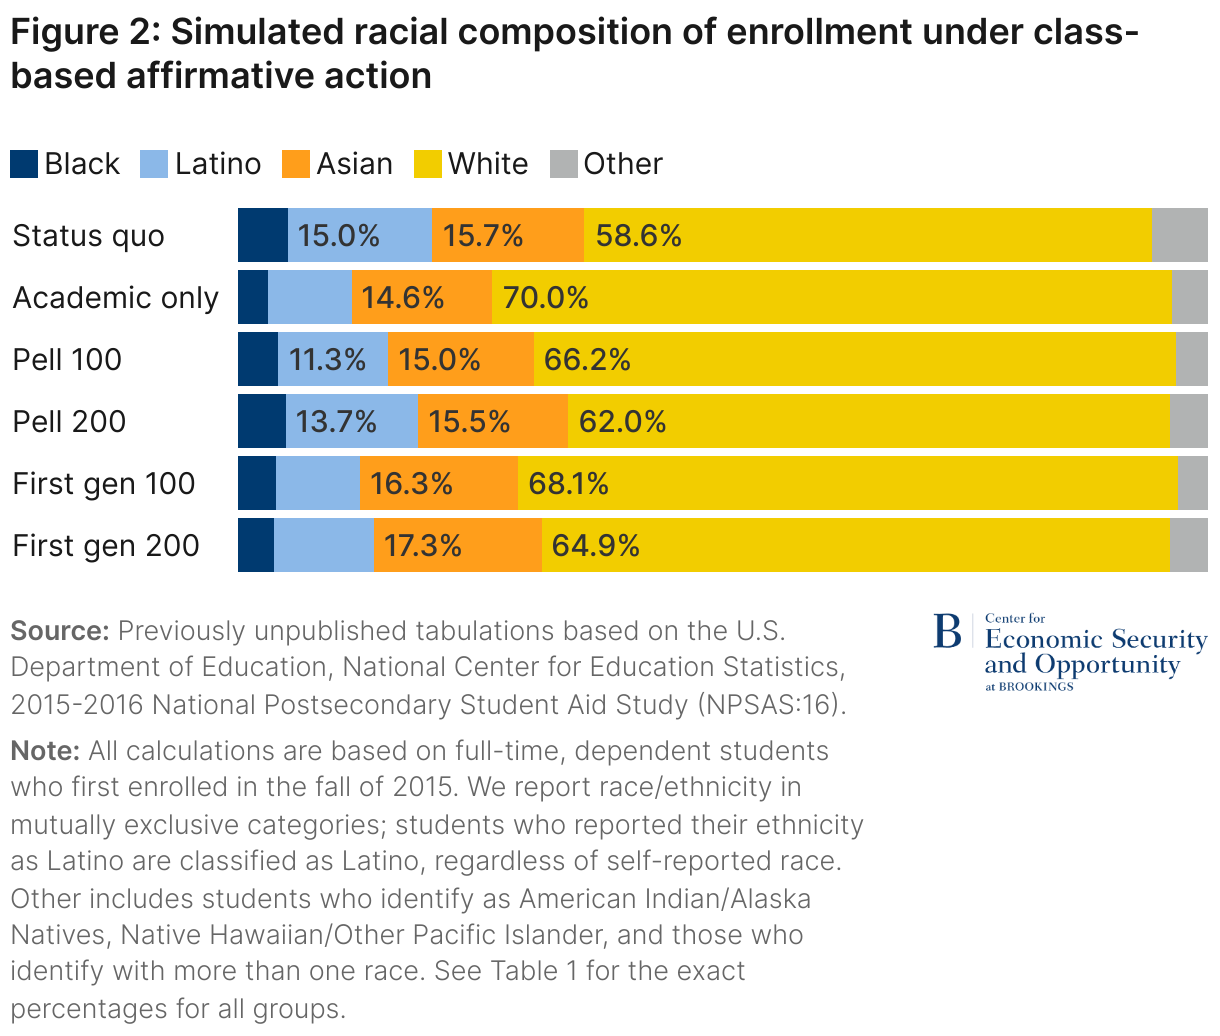
Table 1 provides additional detail regarding the composition of enrolled students in the status quo and in the simulations. The percentage of students who are Pell-eligible or first gen are both about 2 percentage points lower in the Academic Only scenario (around 22%) compared to the status quo (around 24%). The one policy that roughly maintains the racial and ethnic status quo (Pell 200) generates a very large increase in the percentage of enrolled Pell Grant recipients. Around half the classes at these selective institutions would be comprised of Pell Grant recipients in this scenario. Over one-quarter of students enrolled in selective institutions under this scenario (“% Seats filled through AA” in Table 1) would not have been enrolled in the Academic Only scenario. It would represent a massive shift in who enrolls in selective colleges.
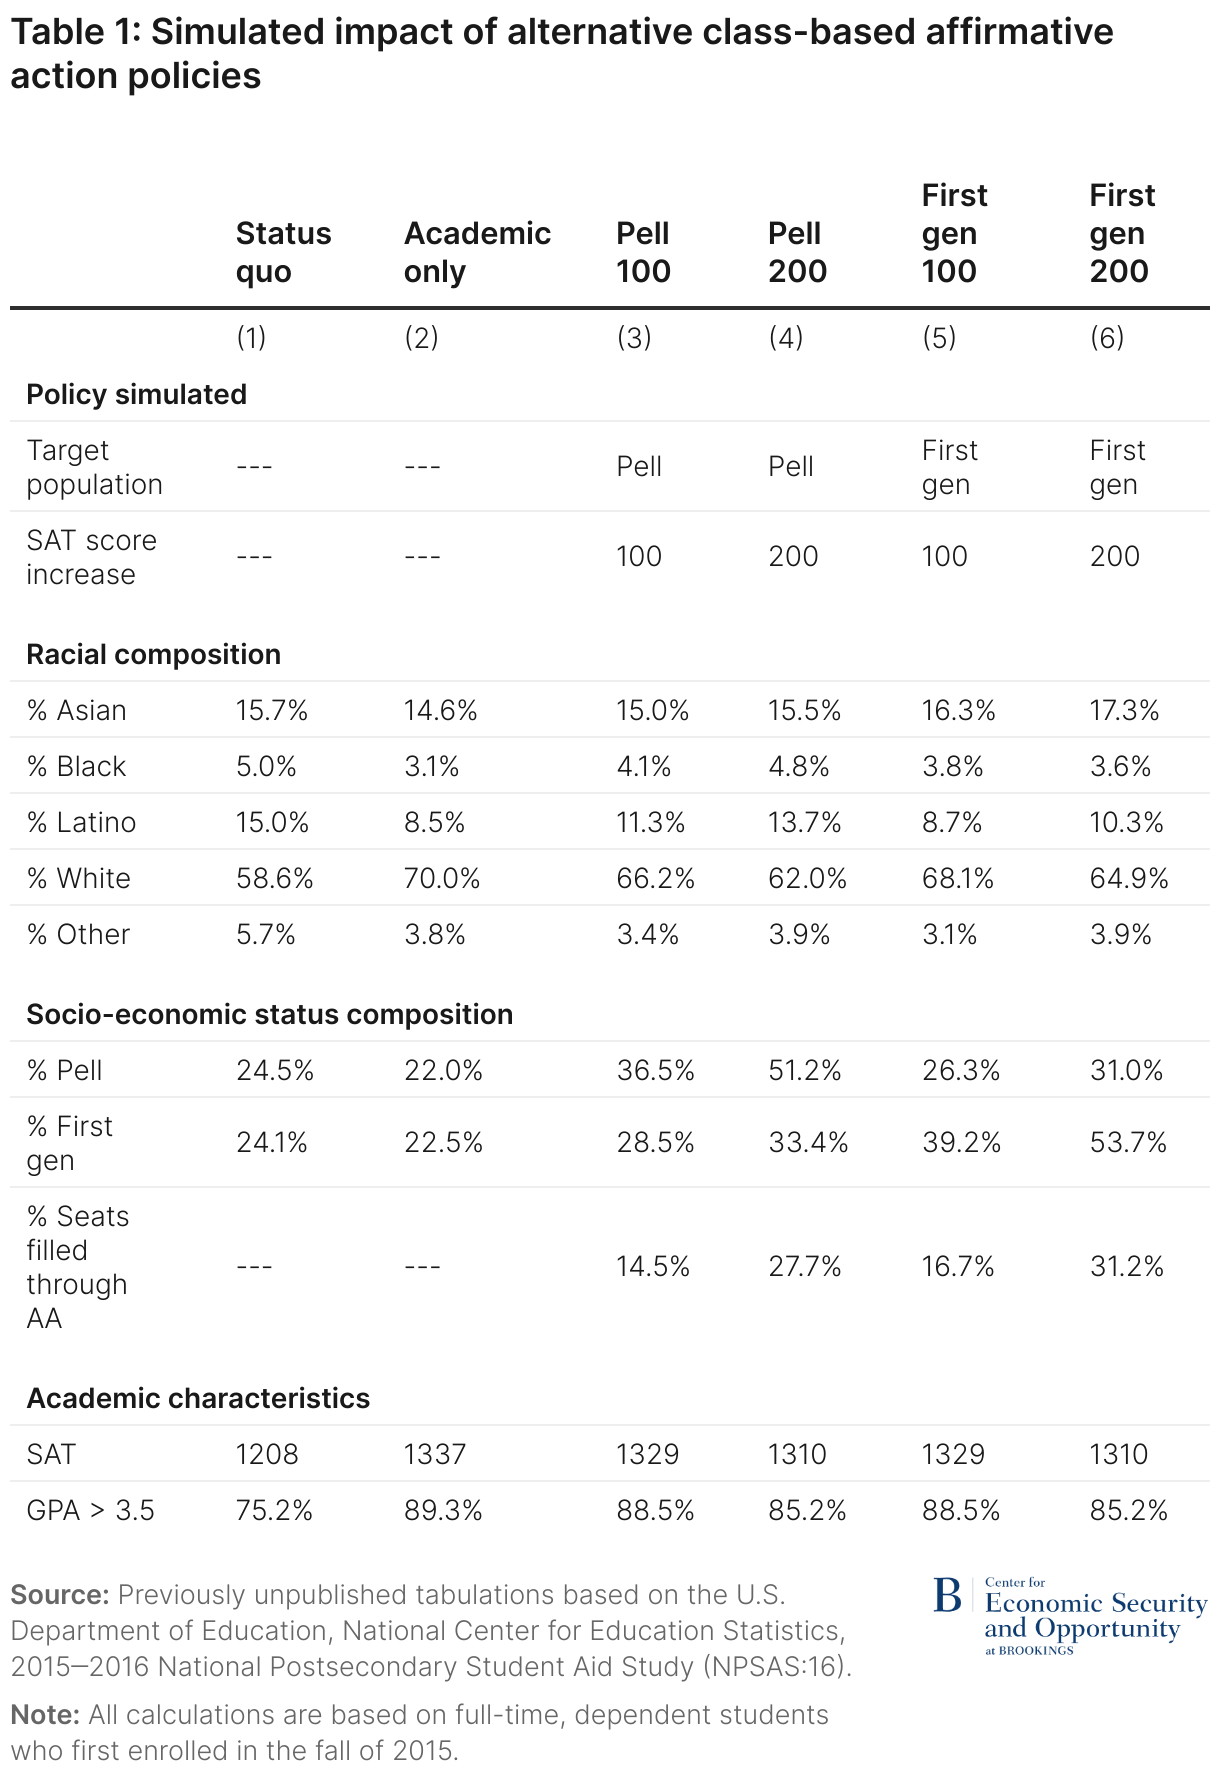
Table 1 also shows the average academic characteristics of students enrolled in selective colleges in the different scenarios. In the Academic Only scenario—where enrollment is allocated strictly based on test scores and grades—the academic qualifications of enrolled students would be higher than in the status quo. This is not surprising since colleges, in fact, consider a range of non-academic factors in admissions and students may not enroll in the most selective college to which they could be admitted. Average academic achievement is lower in the class-based affirmative action scenarios. For example, the average SAT score is 27 points lower and the percentage of students with GPAs above 3.5 is 4.1 percentage points lower in the Pell 200 scenario than in the Academic Only scenario.14
This demonstrates a more general point: Putting more weight on any factor in admissions trades off against other characteristics colleges value. That may well be true in the case of enrolling more lower-income or first gen students. Institutions may recognize that a more well-rounded academic community enables all students to learn more from each other. Institutions may be willing to accept lower academic credentials in exchange for those benefits. One impediment in doing so is the impact on institutional finances and the need to provide greater financial aid to those students. We will explore that issue in more depth below.
Class-based affirmative action is inefficient for achieving racial diversity
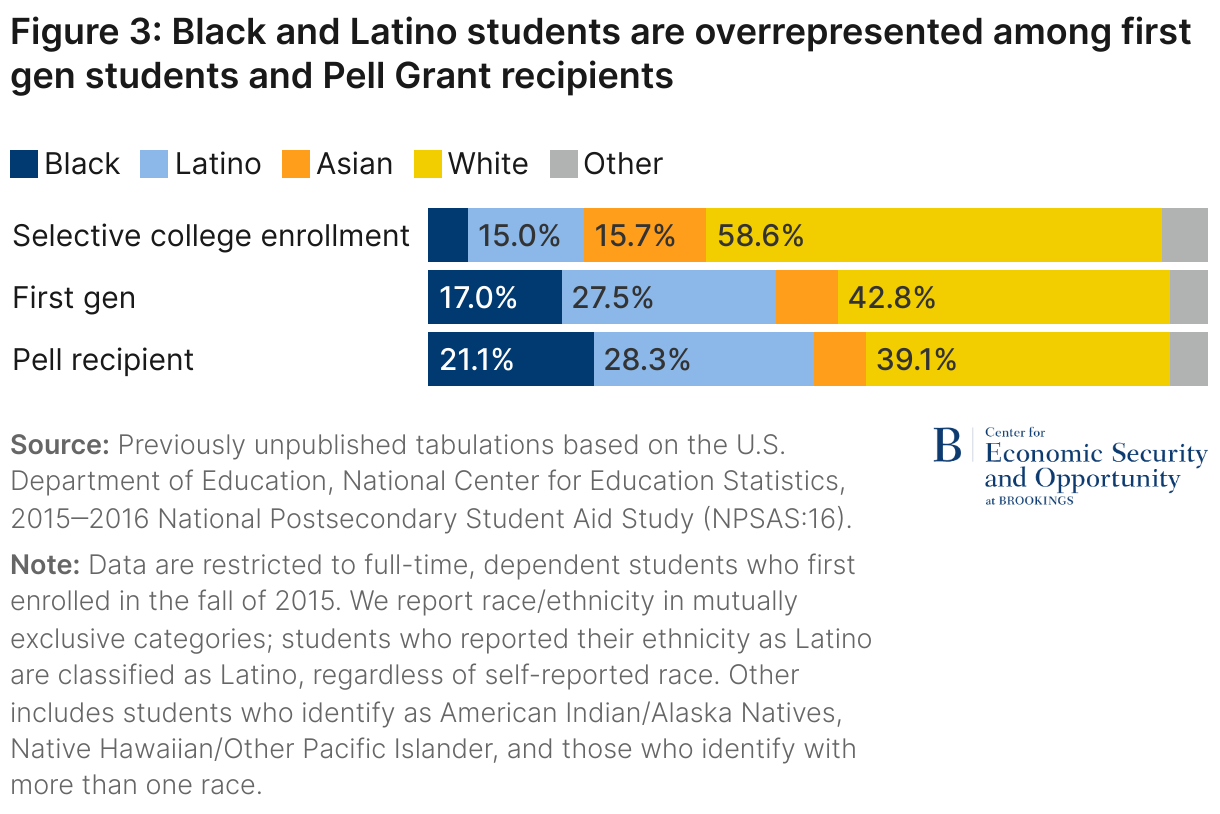
Intuitively, class-based affirmative action seems like a reasonable approach to improve racial and ethnic diversity because Black and Latino students are over-represented among students from lower-income families or those who are first-gen. This is reflected in Figure 3, which shows the percentage of college students who are Pell-eligible or first gen by race and ethnicity. Only 20% of students at selective colleges are either Black (5%) or Latino (15%), while 49.4% and 44.5% percent of all Pell Grant recipients and first gen students, respectively, are Black or Latino. This suggests that enrolling more Pell Grant recipients or first gen students at selective colleges and universities should increase Black and Latino representation.
Although Black and Latino students would benefit from such an approach, over half of Pell Grant recipients and first gen students are not Black or Latino. Many white or Asian students would also benefit from a class-based affirmative action program. In terms of maintaining racial diversity, this approach is poorly targeted.
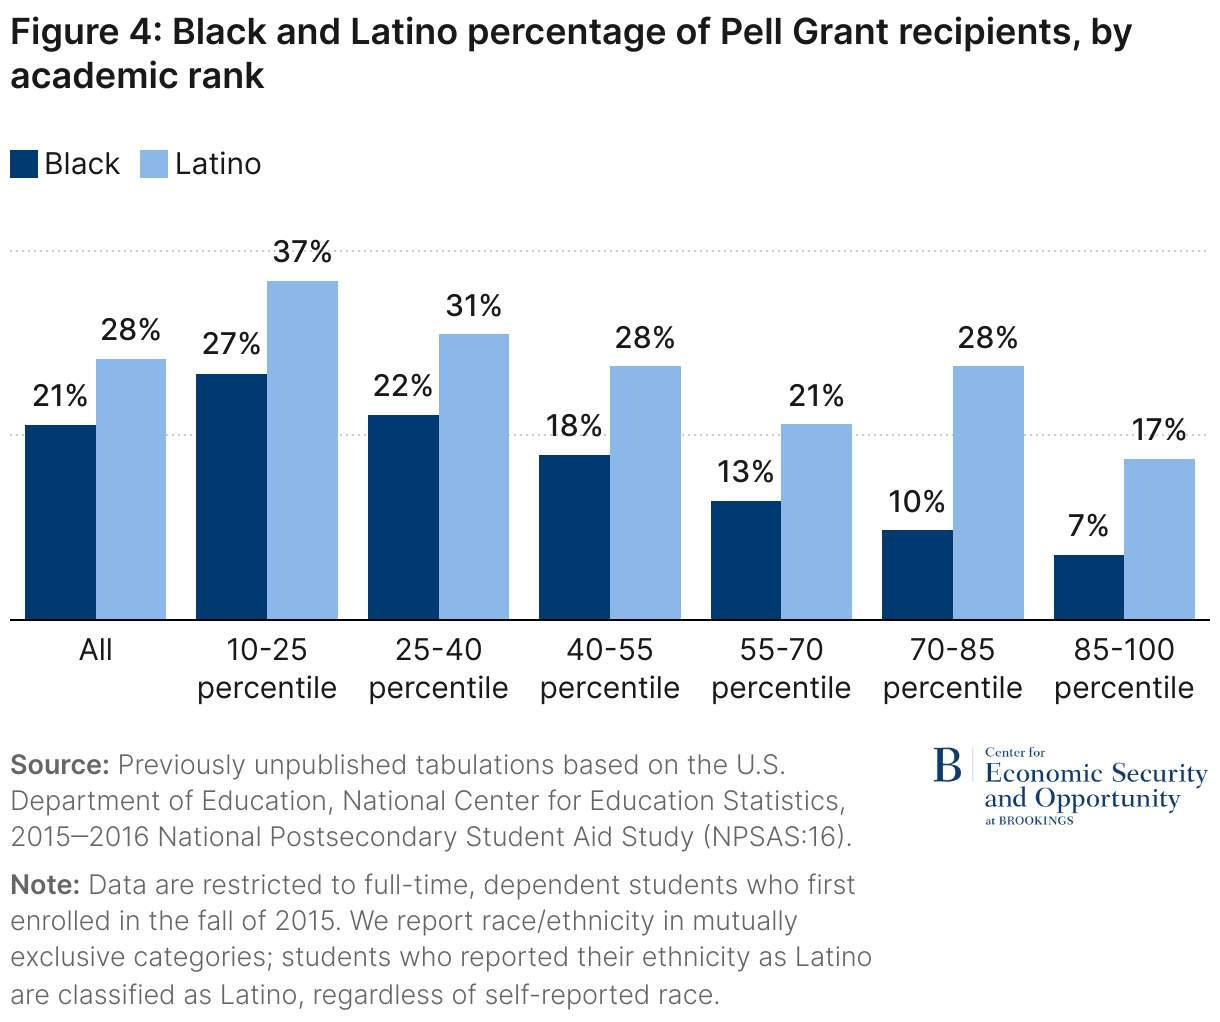
This issue is compounded because lower-income Black and Latino students tend to have lower scores and grades, on average, than other lower-income students. Figure 4 shows the representation of Black and Latino students among Pell Grant recipients overall and by the academic index we use above in the simulations. Selective institutions account for about 15% of enrollment, so the Academic Only scenario enrolls the top bin of Figure 3. The remainder of the figure shows the percentage of Black and Latino students in successively lower, equal-sized bins of the academic index. Black students in particular are underrepresented in the bins just below the top level compared to their representation among Pell Grant recipients overall. As a result, a larger bump in test scores would be necessary to meaningfully alter their admissions outcomes.
Among Pell-eligible students, Black and Latino families tend to have even lower income and wealth compared to their white and Asian counterparts. This could explain part of the racial disparities in academic characteristics among Pell eligible students. More fundamentally, disparities in the academic index reflect long-standing issues of inequality and discrimination in education and across society.15 This is another reason why targeting lower-income or first gen status is an inefficient approach to increasing representation of Black and Latino students. Again, we emphasize that increasing representation of lower-income or first gen students is a laudable goal, but it is not the same goal as increasing racial diversity.
In practice, selective colleges consider factors in admissions other than academics, and students with strong academics may not apply to selective colleges or choose to enroll elsewhere even if admitted. So in fact selective colleges draw from a broader range of the academic index, but the same logic would apply if we could observe a broader range of qualifications.
This analysis also suggests that class-based affirmative action policies would have even greater difficulty maintaining racial diversity at institutions that draw from the highest levels of academic achievement. They admit students from perhaps the top few percentiles of performance. Expanding their net somewhat further down that distribution to capture more lower-income students would yield a smaller share of Black and Latino students than in the simulations we report here. Indeed, this is what the experts in the Harvard and UNC cases found.
Class-based affirmative action requires a lot more financial aid
Providing a large admissions bump for Pell-eligible students may allow selective colleges to achieve Black and Latino representation in enrollment similar to current levels, but it would require a very large increase in enrollment of Pell-eligible students. However, if selective colleges enroll more lower-income students, someone needs to pay for it. It is possible, but we think unlikely at least in the short run, that additional funding could come from the federal or state governments. Under the current financial aid system, though, this funding would need to come from colleges in the form of “institutional aid.” We therefore focus here on the ability of selective institutions themselves to provide the additional financial aid needed to support a class-based affirmative action program.16 How much additional financial aid would they need to provide to make college affordable for students? Will colleges be able to provide that level of funding?
Using the 2015-2016 NPSAS data, we estimate that in the status quo, selective institutions collectively provide $2.5 billion in institutional aid to full-time first-year students (all values are adjusted for inflation and reported in 2023 $; see the appendix to this report for detail on how we make all subsequent calculations. That only covers one cohort, and students will typically need a similar level of support for four years.17 Considering all enrolled cohorts, the total annual institutional aid budget is about four times that, or $10 billion.
Yet combining this institutional aid with all other sources of financial aid does not provide enough support to enable all students to be able to “afford” the institutions they attend. How much a student can afford to pay is a nebulous concept, but the “expected family contribution” (or EFC, soon to be replaced by the Student Aid Index, or SAI) is designed to capture that concept. A student has “unmet need” if all sources of financial aid combined with the estimated EFC is less than the cost of attendance, also known as the “sticker price.”18
In the status quo, we estimate that students enrolled in selective colleges face unmet need of $10.1 billion. In other words, the $10 billion in financial aid that colleges and universities provide to their students only provides around half of the funding those students need, according to the financial aid formula, to afford the cost of attendance. Those students would need to find other sources of funding, like working or borrowing more, to cover the balance. Institutions would need to double their financial aid budgets just to meet existing financial need.
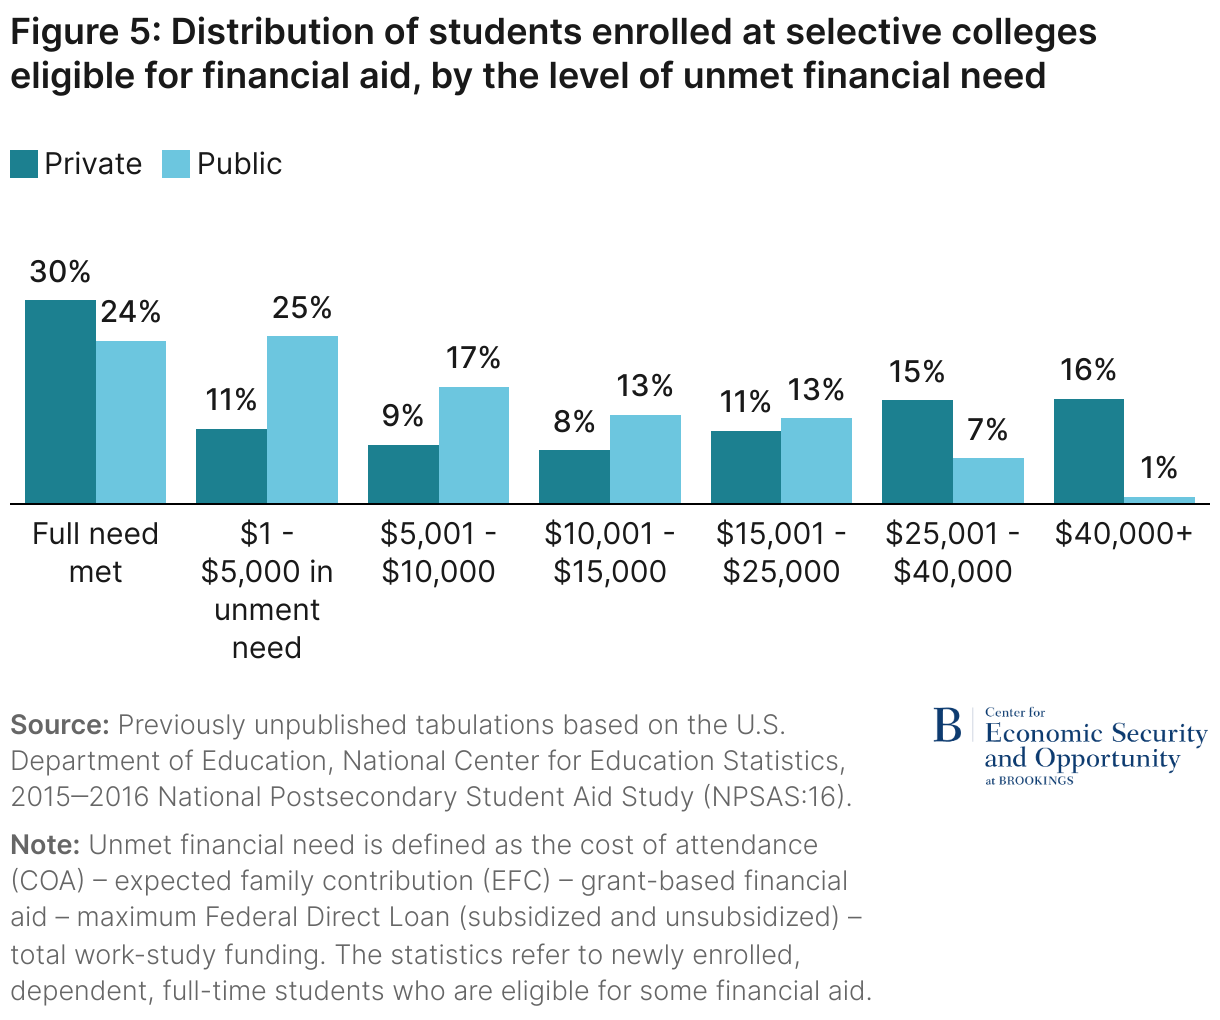
Figure 5 shows the distribution of existing unmet financial need among those eligible for financial aid at selective colleges from the student perspective. Almost three-quarters (73%) of students enrolled at these institutions are eligible for aid. Less than a third of eligible students at private selective colleges and less than a quarter of eligible students at public selective colleges receive enough financial aid to cover their financial need. Many students, especially those at private institutions, pay much more than they can reasonably afford. For example, 41.8% of eligible students enrolled at private selective colleges pay $15,000 or more above what they can afford. And this reflects the costs of just the first year of a four-year program. The share of eligible students attending public selective colleges who have very high levels of unmet need is smaller, but still substantial.
A class-based affirmative action program would place even greater demands on the financial aid budgets of selective institutions—or put even more students in a position where they are asked to pay more than they can reasonably afford. For each of the affirmative action scenarios shown above, we calculate the additional financial need students enrolled at selective institutions would face. The need for greater financial aid follows directly from the increase in the share of (simulated) enrolled students who are eligible for Pell Grants relative to the status quo. Replacing higher-income students with lower-income (Pell-eligible) students would certainly increase the need for institutional aid; the goal of this analysis is to estimate by how much.
The results are shown in Figure 6. The blue segment of each bar represents total collective financial aid offered currently ($10 billion), and the orange segment shows the current level of unmet financial need ($10.1 billion). The additional financial need, compared to the status quo, under each scenario is shown in gray. The overall height of each bar represents the size of the total financial aid budget at these institutions that would be necessary to meet the full financial need of all students in each scenario. Those needs will change as the socioeconomic composition of the student body changes.
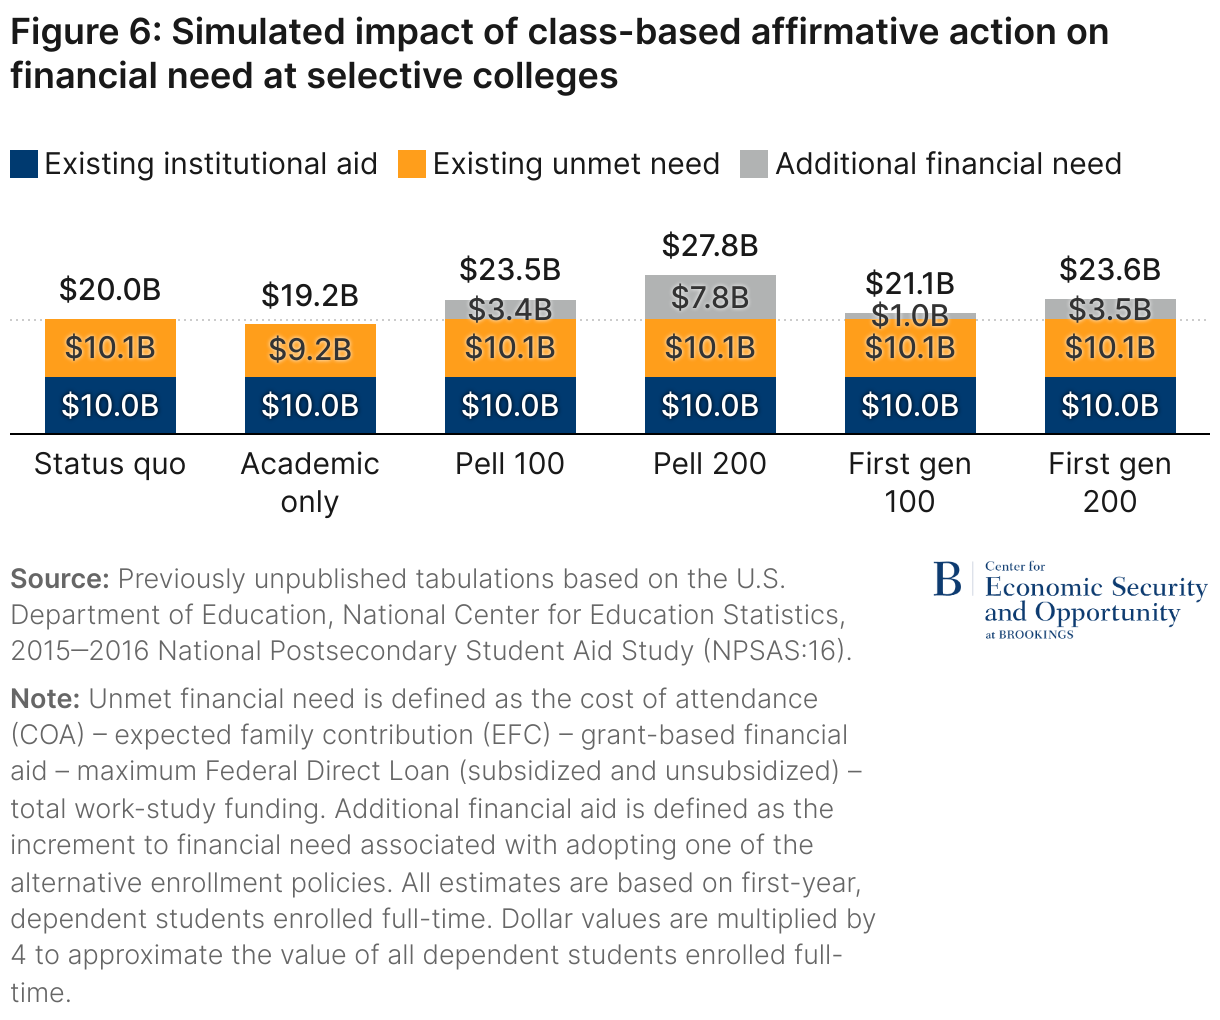
In the Academic Only scenario (the second bar), unmet financial need would be lower relative to the status quo. That is, if selective colleges enrolled students strictly based on the academic index, the total need for financial aid would be slightly lower than in the status quo. This is not surprising given the well-known relationship between income and academic achievement and is consistent with colleges using a modest amount of some form of class-based affirmative action currently.19
In all of the class-based affirmative action scenarios, though, total financial need is considerably higher. Adding a large number of lower-income Pell Grant recipients, as in the Pell 200 simulation (the fourth bar), would have a very large effect on financial need. Selective institutions would collectively need to provide $7.8 billion of financial aid to meet the additional need of these newly enrolled, lower-income students under this scenario. That new unmet need would be on top of the existing unmet need of $10.1 billion, a 77% increase. To meet the full financial need of all students in this scenario, institutions would need to almost triple their institutional financial aid budgets from $10 billion to $27.8 billion per year.
A handful of private institutions with very large endowments may have the resources available to provide such funding. They likely already meet full need. But the magnitude of the current funding gap suggests that more students are enrolled at institutions without this extreme level of wealth. Both the willingness and the capacity of institutions to devote additional resources to implement class-based affirmative action surely varies across the selective college sector, but this analysis suggests that on average, funding is likely to be a formidable hurdle.
No silver bullet for maintaining diversity
Racial inequality in the United States is long-standing and widespread. Historical and ongoing discrimination—especially against Black Americans—leads to large racial disparities in academic preparation at the end of high school. In addition, many colleges do not provide enough financial aid to make college affordable for lower-income students. Without addressing inadequate financial aid and disparities in academic preparation, maintaining racial diversity after SFFA and increasing representation of lower-income and students who would be the first in their family to get a bachelor’s degree is going to be a major challenge for selective colleges.
What else might selective colleges do to maintain diversity in the wake of the SFFA decision? Other options are potentially available—for examples top percent plans, targeted outreach and recruitment, pathways programs, or enrolling more transfer students—that are likely consistent with the SFFA ruling. These approaches may increase enrollment of students from historically excluded racial groups, but usually the effects are small.
Colleges may also be able to evaluate their admissions procedures to make sure they consider the opportunities students have had and obstacles they have faced (including those related to their race or ethnicity). As the Supreme Court warned, though, such an approach cannot be used to replicate current affirmative action policies through a back door. But any strategy that significantly increases enrollment of lower-income students will likely be ineffective if they are not coupled with significant increases in financial aid. That would be expensive.
Ultimately, improving educational outcomes for Black, Latino, and AIAN students goes beyond the need to target their enrollment at selective colleges. Most college students do not attend such institutions; Black, Latino, and AIAN students are over-represented at less selective and open access institutions. Policymakers and advocates who care about equity would be wise to redouble efforts to improve quality at the types of institutions most students attend, including community colleges, open-access regional four-year colleges, Historically Black Colleges and Universities (HBCUs), Minority Serving Institutions (MSIs), and Tribal Colleges and Universities. Even successful changes in admissions policies at selective colleges can only be a small part of the solution.
Authors


Related Content


Appendix: Simulating Unmet Need and Increased Financial Need Associated with Class-Based Affirmative Action
To calculate the observed level of unmet need in the 2015-2016 NPSAS data, we start with students’ Expected Family Contribution (EFC), which represents an estimate of the amount the student can afford to pay. Then we assume that students take out the maximum Federal Direct Student Loan (both subsidized and unsubsidized), which currently amounts to $5,500 for freshman. Finally, we include earnings from work-study jobs that we observe in the data. The total of these values represents a broader measure of what students can “contribute” on their own. Earlier in the text, we labeled this amount the “meet full need net price.” We subtract this amount along with any grant-based financial aid (governmental or institutional) that students receive from the full cost of attendance (COA) they face at their institution where they are enrolled. We define the result of these calculations to be unmet need.
To simulate the impact of class-based affirmative action on institutional financial aid budgets we start out with the total level of financial need that students at selective institutions currently face. Financial need is defined as COA – EFC. These values are directly observed in the data. We generate the total amount of financial need for first-year, dependent, full-time students at all selective institutions. In subsequent calculations, we multiply financial need by four, assuming that four cohorts of students are enrolled at one time.
Then we simulate these students’ financial need at selective institutions under each of the class-based affirmative action scenarios. Our earlier discussion describes the process of determining which students would be enrolled at selective institutions under each set of assumptions. Students’ EFCs do not depend on where they enroll. We simulate enrollment in the selective sector, not in specific institutions, so we cannot assign an institution-specific simulated COA for each student. Instead, we calculate their financial need separately at public and private institutions using the average observed COA in each sector. Then we take the weighted average of these values, noting that 55% of selective enrollment is at public institutions. The resulting value represents the simulated level of financial need at an average selective institution.
Finally, we compare these simulated levels of financial need to the observed levels of financial aid. The difference represents the increment to institutions’ financial aid budgets that would be necessary to cover the change in financial need.
-
Acknowledgements and disclosures
The Brookings Institution is financed through the support of a diverse array of foundations, corporations, governments, individuals, as well as an endowment. A list of donors can be found in our annual reports published online here. The findings, interpretations, and conclusions in this report are solely those of its author(s) and are not influenced by any donation.
-
Footnotes
- In a “Dear Colleague” letter on the decision, the U.S. Departments of Education (ED) and Justice (DOJ) note that “institutions may also continue to consider a wide range of factors that shape an applicant’s lived experiences,” including “financial means and broader socioeconomic status.”
- Unfortunately, we do not have a large enough sample in the data we use to study the effects on American Indian/Alaska Native (AIAN) enrollment, though we would expect similar effects as for Black and Latino enrollment.
- This would include Harvard and the University of North Carolina, which were the subjects of the SFFA case. Indeed, the detailed analysis conducted by the experts on behalf of those institutions confirms it is difficult for them to achieve racial diversity without explicitly considering race.
- Carnevale, Campbell and Mabel conduct a similar exercise using data for the cohort graduating from high school in 2013. We use the 2015-16 wave of the NPSAS data rather than the more recent 2019-2020 wave for two reasons. First, at the time we began this analysis, the 2019-20 data was not yet available and there is a time lag involved in obtaining access to the restricted use version of these data we require. Second, the use of test optional admission policies was less prevalent in 2015-16 (although the far greater use of such a system did not begin until after the COVID pandemic) and we rely on the near universal availability of test scores for students enrolled at selective institutions.
- Our results are similar if we include part-time students in our analysis. We cannot do a simulation including independent students because the data do not include high school grades for them.
- Race and Hispanic or Latino ethnicity are asked in separate questions. We classify students as Hispanic or Latino regardless of race; students we classified as API, Black, white, or other did not identify as Hispanic or Latino. We omit the “non-Hispanic” modifier, refer to students identifying as Hispanic or Latino as “Latino,” and refer to these categories as “race” rather than “race/ethnicity” for ease of exposition.
- Not all colleges administer the Federal Work-Study program, and participation depends not only on student eligibility but also the availability of FWS opportunities at the student’s institution. FWS tends to be available at more selective colleges, but to the extent that students are unable to access these funds, we will understate the need for additional financial aid in our simulations.
- There were 3.6 million total newly enrolled students in 2015-16, half of them satisfy the restrictions we imposed that they be dependent and enrolled full-time.
- Card does not consider yield in his analysis, effectively assuming the students who enroll are a random subset of those who are admitted. This is a plausible assumption for Harvard, which has an exceptionally high yield rate. Even at colleges that are less selective than Harvard but still very selective, characteristics admitted and enrolled students could differ significantly. Indeed, Caroline Hoxby considers yield in her analysis of race-blind admissions on behalf of UNC.
- The race-neutrality of test scores (or lack thereof) could also influence the interpretation of our results. Our methods, though, are based on the existence of these test scores as they are, which provide us with a method of assessing student qualifications that does not directly incorporate race. Altering the content of those tests is still a possibility, but it is beyond the scope of this exercise.
- If we conduct the analysis using only SAT/ACT scores to rank students academically (instead of the index we use here that also incorporates high school grades), as in the analysis reported in Chapter 15 of “The Future of Affirmative Action: New Paths to Higher Education Diversity after Ficher,” the results are similar.
- The University of Colorado experimented with this approach in anticipation of a state ban on using race in admissions; the ban did not pass, and as far as we know they did not adopt the changes permanently. Numeric admissions bumps based on race were already illegal under the 2003 Grutter ruling, but those decisions do not speak to consideration of socio-economic status.
- This is perhaps surprising considering the high academic achievement of Asian students and some evidence that Asians are disfavored in admissions. This finding could indicate that Asian students are more likely to apply to selective colleges or enroll when they are accepted compared to other students with similar academic characteristics.
- Based on similar analysis by Carnevale, Rose, and Strohl (2014), some have argued that class-based affirmative action scenarios similar in scale to Pell 200 could enroll a class that is as racial diverse as the status quo and has stronger academic credentials on average. However, comparing the academic credentials in the class-based affirmative action scenario to the status quo can be misleading about the potential trade-offs involved in implementing a class-based affirmative action program. Compared to the status quo, the class-based AA scenarios not only simulate an admissions bump based on Pell eligibility or first-gen status, but also implicitly reduce the weight placed on all other factors considered in admissions or that affect applications and yield (which is necessary given the data). Selecting students based only on test scores and grades naturally increases the average test scores and grades relative to the status quo. For this reason, the Academic Only scenario is a better basis of comparison when considering the potential effects of class-based AA on average academic credentials.
- Indeed, this is one rationale for race-based affirmative action, though the 1978 Bakke decision ruled this out as a legal basis for race-conscious admissions, even prior to SFFA.
- From a societal perspective, this exercise amounts to a reallocation of students among colleges without changing overall spending on higher education. Selective colleges have higher cost of attendance, on average, than other colleges. Replacing a higher-income, full-pay student at a selective college with a lower-income student who cannot afford to pay the full cost of attendance directly increases the need for financial aid at that selective college. Most likely, if the higher-income student is displaced from the selective college sector, they will attend a lower cost of attendance college, where they will pay less due to the lower average cost of attendance, so total student payments for higher education would be lower. In theory, governments (state or federal) could implement transfers from less selective to more selective institutions by changing taxes and financial aid policy or the allocation of funding across campuses within a state system. But these would be significant changes to policy, and in any case, private institutions cannot implement these transfers on their own.
- Some students may drop out and others may spend longer than four years to get their degree; for simplicity, we assume these effects roughly offset each other.
- Note that all sources of financial aid include the maximum Federal Direct Student Loan (currently $5,500 for freshman) and funding from the Federal Work-Study Program.
- This finding may seem inconsistent with recent work from Opportunity Insights (OI) suggesting that students in the top 1% of the parental income distribution are much more likely to be to be admitted to twelve highly selective “Ivy Plus” colleges compared to lower-income counterparts with similar test scores; a situation that looks more like affirmative action for the rich. But there are potential explanations for the inconsistency. First, the Ivy Plus schools in the OI study are much more selective than the average “selective” college by our definition and account for a small share of selective enrollment overall. In addition, that study showed the largest “excess admissions” is for students in the top 0.1% of the parental income distribution, but students from the bottom half of the income distribution (who likely all need financial aid) also have higher-than-average admissions probabilities. It is possible that even for this set of colleges, the admitted class has on net more financial need than would be the case if students were admitted based on test scores and other academic credentials only.
The Brookings Institution is committed to quality, independence, and impact.
We are supported by a diverse array of funders. In line with our values and policies, each Brookings publication represents the sole views of its author(s).