Several developments in Russia’s oil trade suggest Western sanctions are hampering Putin’s ability to profit from oil exports. First, a sanctioned Russian ship reemerged as an active tanker this July, the first time there has been such a reappearance in our data since the U.S. sanctioned 14 further Sovcomflot ships in February (Sovcomflot is the largest state-owned shipping company in Russia). Second, July saw an unprecedented shuffling of activity within the Sovcomflot fleet, with a shift toward less-heavily used ships. Third, Russia’s seaborne oil export volumes are down versus last year, and volumes carried on Sovcomflot ships have been falling steadily. Fourth, and perhaps most importantly, the average number of departures per ship declined.1 As we explain below, these developments are a sign of mounting strain on Russia’s shipping operations. Limited oil tanker capacity remains Russia’s Achilles’ heel, which the West can exploit through further sanctions and enforcement.
Recent changes in Sovcomflot’s shipping operations
Two months ago, we published a blog arguing that the U.S. can sanction more Russian-owned tankers with little risk of spiking the price of oil. In that post, we noted that Russia was partially able to trade around the price cap because much of the Sovcomflot fleet had yet to be sanctioned and was still actively trading out of Russia. As a result, we argued that the U.S. should sanction additional Sovcomflot tankers, flagging the 15 most active ships that had not yet been sanctioned.
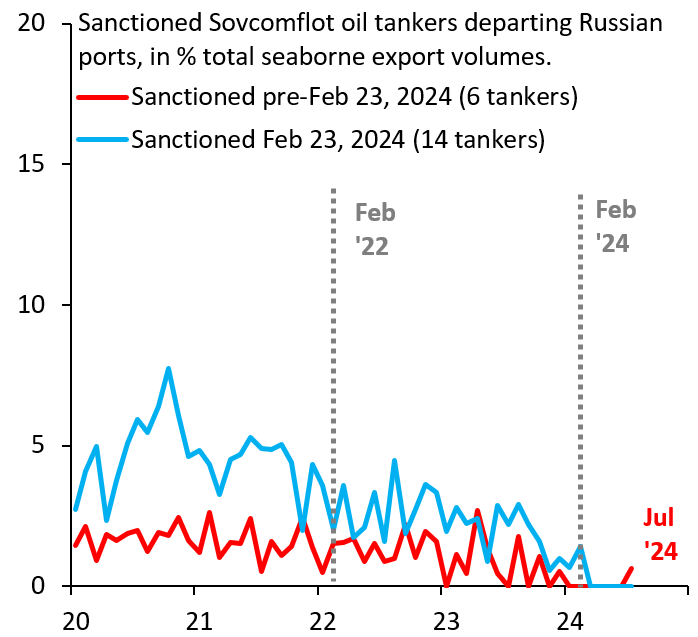
Since then, there have been two important developments. First, an oil tanker that was sanctioned in December named “Viktor Bakaev” (International Maritime Organization 9610810) became active in July (Figure 1, red line), the first such reappearance in our data since the February 2024 sanctioning of additional Russian ships. While somewhat speculative, the reintroduction of a previously sanctioned tanker suggests that Russia is exhausting suitable options for the transport of its oil to various trading partners.
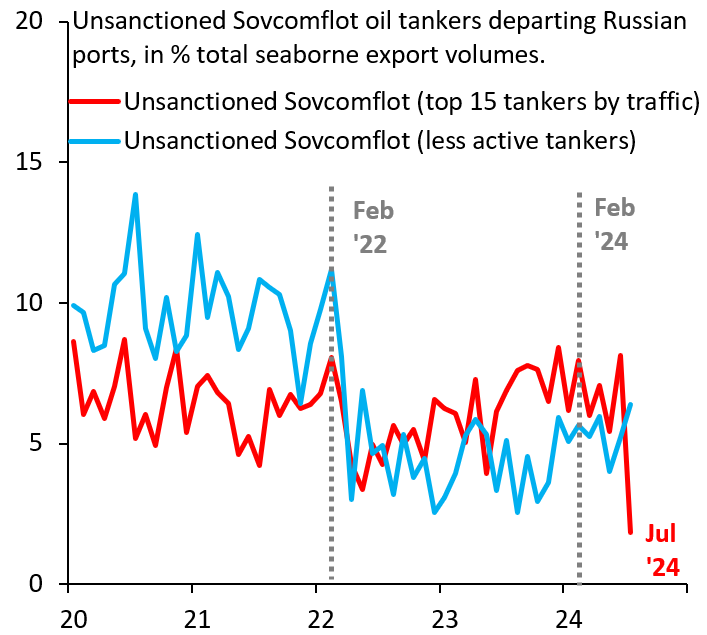
Second, July saw a big churn in the unsanctioned Sovcomflot fleet, with activity shifting to previously less-heavily used ships. Volumes on the 15 most active ships fell sharply (Figure 2, red line), with previously less-actively used ships unable to offset this drop (Figure 2, blue line). The severity of this reshuffling—which is unprecedented—could be indicative of mounting stress on the Sovcomflot fleet, potentially because wear and tear on actively used ships forced maintenance breaks.
Figure 1. Sanctioned Sovcomflot oil tankers departing Russian ports, in % total seaborne export volumes
Figure 2. Unsanctioned Sovcomflot oil tankers departing Russian ports, in % total seaborne export volumes
The mounting strain on Sovcomflot over 2024
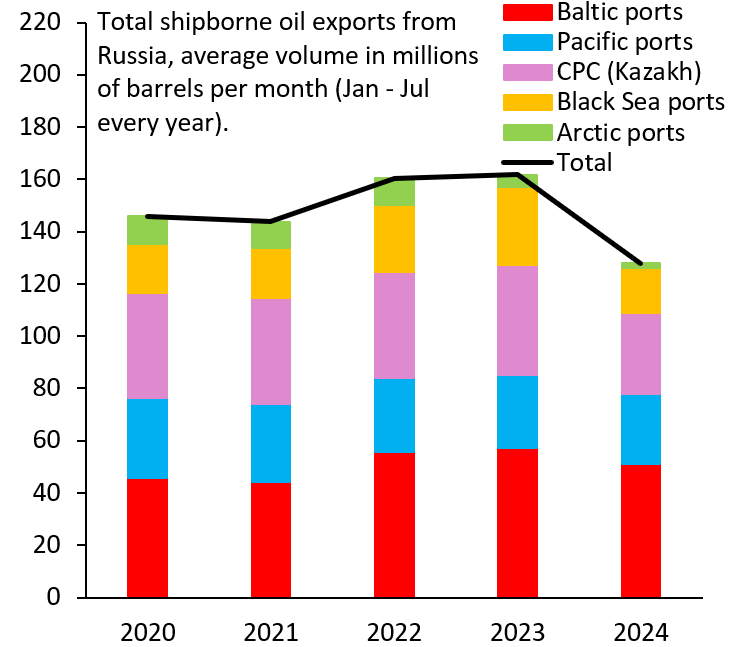
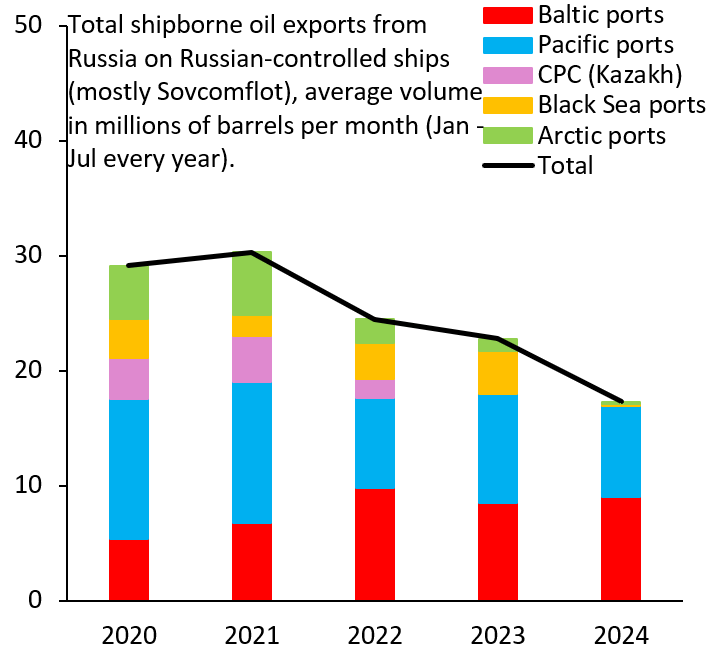
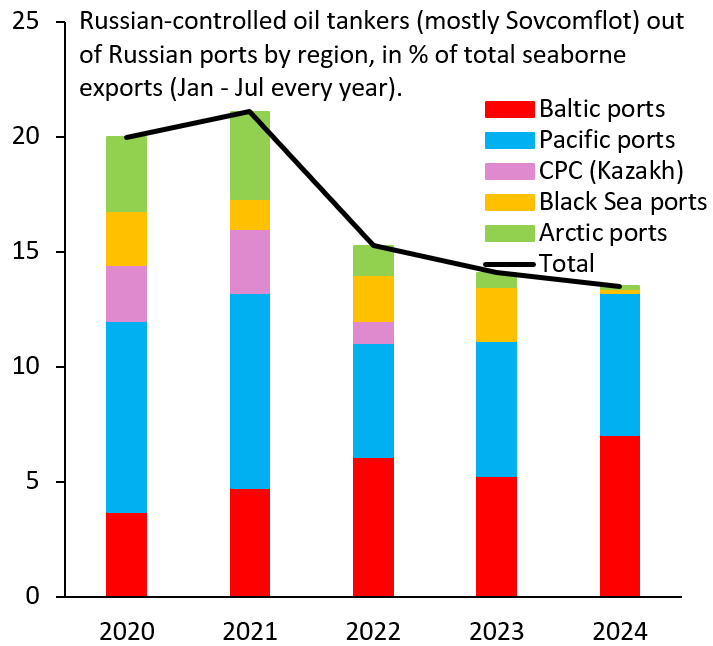
In addition to signs of stress that have materialized in recent months, other indications of rising pressure on the Russian fleet have been building for some time. This can be seen by comparing Figures 3 and 4. Figure 3 shows the breakdown by region for all seaborne oil exports out of Russia. As an approximate year-to-date comparison, the chart shows average volumes from January to July for every year between 2020 and 2024. This snapshot shows that overall export volumes were roughly stable, especially out of ports in the Baltic and Pacific, although 2024 is seeing some declines. Figure 4 presents the same analysis for Russian-controlled ships. (This is mainly Sovcomflot tankers but includes also ships owned by the Russian energy company Rosneft, for example, and ships using Russia’s Ingosstrakh insurance.) Sovcomflot ships stopped lifting Kazakh oil out of the Caspian Pipeline Consortium (CPC) terminal in the Black Sea in 2022, a testament to the efficacy of the G7 price cap, as Russia needed all its tankers to operate as much as possible outside the cap. Furthermore, export volumes on Sovcomflot ships have been steadily declining, especially out of the Black Sea and Arctic ports. This could again be the result of maintenance issues, similar to the recent Sovcomflot fleet churn.
Figure 3. Total shipborne oil exports from Russia, average volume in millions of barrels per month (Jan-Jul every year)
Figure 4. Total shipborne oil exports from Russia on Russian-controlled ships (mostly Sovcomflot), average volume in millions of barrels per month (Jan-Jul every year)
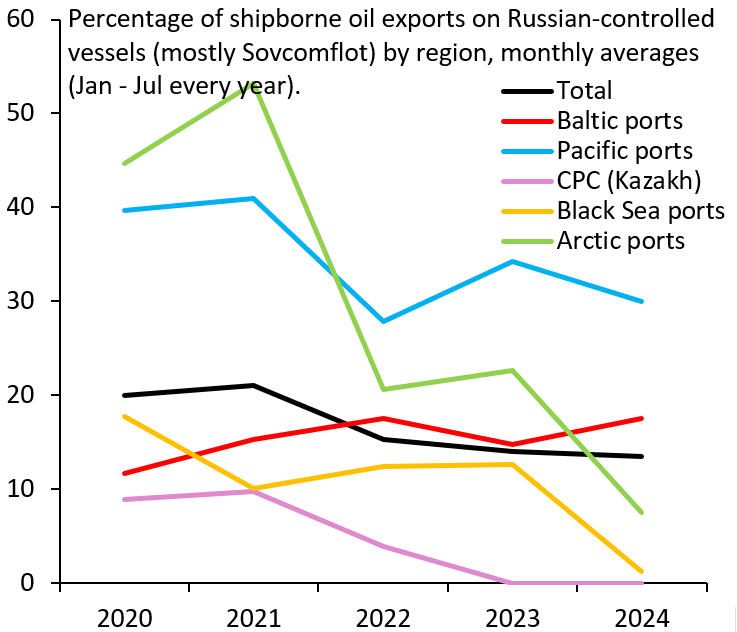
Figure 5 shows the importance of Russian-controlled tankers in overall seaborne exports (it gives the ratio of the bars in Figure 4 to the black line in Figure 3). Russian tankers are most active in the Baltic and Pacific, while they have almost withdrawn from everywhere else. In terms of overall capacity out of these different regions, Russia devotes the biggest share of its tanker resources to ports in the Pacific, where trip distances are shorter and oil is essentially shuttled to China. In the first seven months of 2024, 30% of the capacity out of Pacific ports was on Russian ships (Figure 6, blue line), while this share is substantially lower and falling everywhere else—a testament to the importance of China as a trading partner for Russia.
Figure 5. Russian-controlled oil tankers (mostly Sovcomflot) out of Russian ports by region, in % of total seaborne exports (Jan-Jul every year)
Figure 6. Percentage of shipborne oil exports on Russian-controlled vessels (mostly Sovcomflot) by region, monthly averages (Jan-Jul every year)
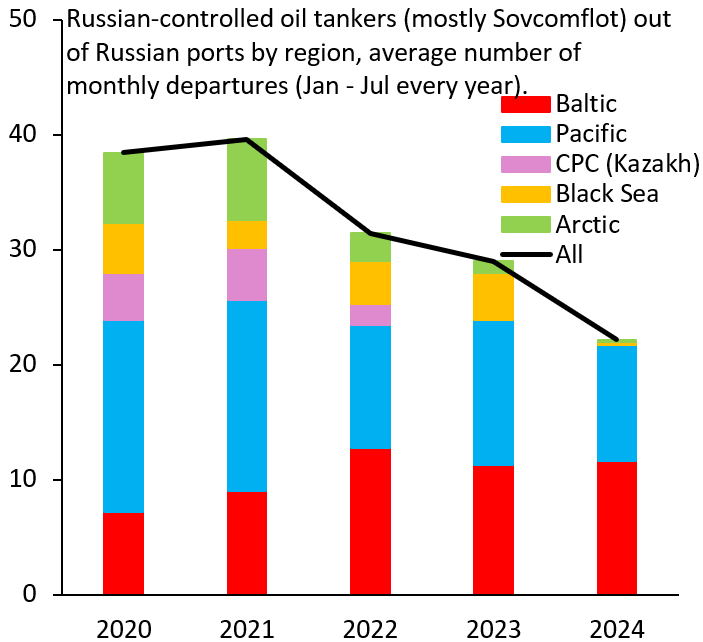
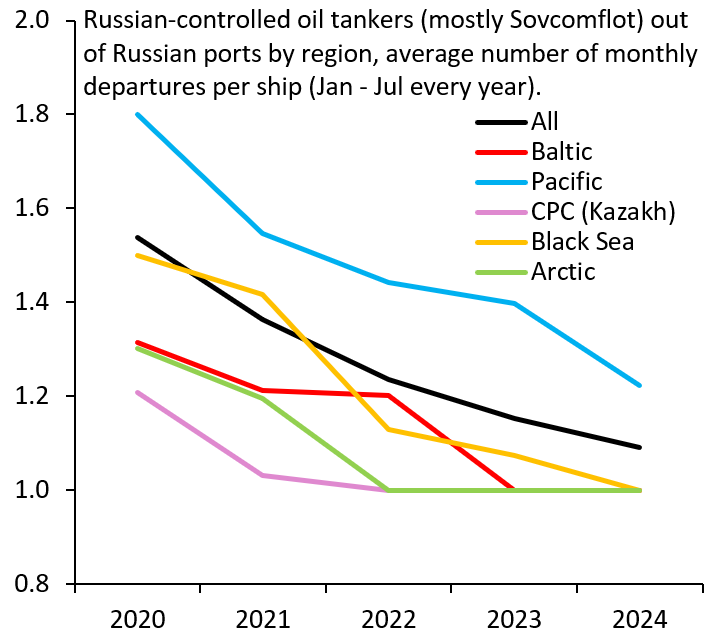
A further development is that the average number of monthly trips made by Sovcomflot tankers has fallen as trip distances lengthened; Figure 7 shows the average number of monthly departures by Russian-controlled tankers by region. Figure 8 divides these departures by the number of ships to present an average monthly number of departures per ship. This number has fallen steadily, especially after 2022 for the Baltic, illustrating the monumental impact of the EU ban on seaborne Russian oil. Along both dimensions—the exit of Russian ships from the CPC terminal and falling number of trips per ship—we see signs of mounting strain on Sovcomflot. Russia’s dependence on oil tankers remains its Achilles’ heel, which the West can exploit by sanctioning more Sovcomflot ships. Additional sanctions, coupled with stricter enforcement, will push more of Russia’s seaborne exports onto either Western oil tankers or the shadow fleet, putting downward pressure on the Urals oil price without driving up global oil prices.
Figure 7. Russian-controlled tankers (mostly Sovcomflot) out of Russian ports by region, average number of monthly departures (Jan-Jul every year)
Figure 8. Russian-controlled tankers (mostly Sovcomflot) out of Russian ports by region, average number of monthly departures per ship (Jan-Jul every year)
-
Acknowledgements and disclosures
Elijah Sheets—an undergraduate student at Southern Methodist University—provided research assistance for this blog post.
-
Footnotes
- Of course, these results are conditional on our data, which cover 85% of traffic out of Russian ports and are therefore highly representative. However, it is possible that activity of certain tankers drops out of the data once they are sanctioned. As a result, our findings should be seen as indicative, not conclusive.
The Brookings Institution is committed to quality, independence, and impact.
We are supported by a diverse array of funders. In line with our values and policies, each Brookings publication represents the sole views of its author(s).



Commentary
Strains on the Sovcomflot oil tanker fleet
August 29, 2024