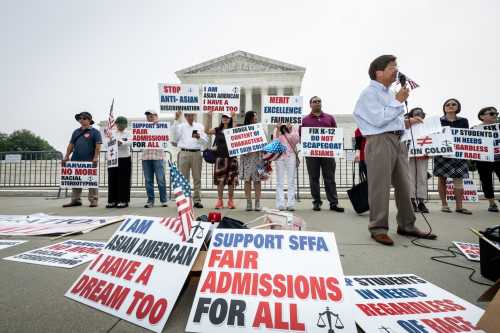
Since 1978, the law allowed colleges to consider race or ethnicity as one factor in admissions to achieve the educational benefits of diversity. That has changed. In his majority opinion in Students for Fair Admissions v. Harvard (SFFA), Chief Justice John Roberts writes that “the Harvard and UNC admissions programs cannot be reconciled with the guarantees of the Equal Protection Clause” and those colleges must change how they use race and ethnicity to decide who is admitted. Although the Court’s opinion does still allow universities to consider “an applicant’s discussion of how race affects his or her life, be it through discrimination, inspiration, or otherwise,” most colleges that previously considered race in admissions will likely need to revise their practices to comply with the decision.
How many students will be affected by college admissions policy changes in the wake of the decision? The number of colleges that say they have race-conscious admissions has declined in recent decades, and older research (based on the high school class of 1982) suggests that only the most selective fifth of colleges put significant weight on race in admissions decisions. Further, in nine states1 affirmative action in admissions for public colleges was already banned prior to the decision.
We report on newly collected data about which colleges say they considered race/ethnicity in admissions in recent years. This data confirms earlier findings that show affirmative action was used mostly at a relatively small number of selective universities, and thus most college students are enrolled in institutions that did not practice affirmative action prior to the Students for Fair Admissions decision. Declines in Black, Hispanic/Latino, and Native American enrollment at highly selective colleges seem likely, though that will depend on how institutions interpret the decision and guidance issued by the U.S. Departments of Education and Justice. But the effects will likely be much smaller—or non-existent—at the less-selective colleges most students attend. Indeed, some of these institutions may see enrollment of Black, Hispanic/Latino, and Native students increase as more-selective colleges admit fewer of those students.
Data on admissions practices
Colleges that participate in federal financial aid programs are required to report a range of information about their enrollment and admissions practices to the Integrated Postsecondary Education Data System (IPEDS), but this does not include whether they consider race in admissions. Most four-year colleges participate in the Common Data Set (CDS), a collaboration of the College Board, U.S. News, and Peterson’s. The survey asks colleges a series of questions about whether various factors are “very important,” “important,” “considered,” or “not considered” in their admissions decisions. This list includes both academic factors like standardized test scores and high school grades and non-academic factors, including “racial/ethnic status.”
U.S. News, College Board, and Peterson’s use the CDS for their rankings (U.S. News) and their college guides (College Board and Peterson’s), though these organizations appear to no longer post or use the information on consideration of racial/ethnic status in admissions specifically.2 Many colleges post their full responses to the CDS on their website. We collected and coded colleges’ responses to the question about whether they consider racial/ethnic status in admissions from colleges’ websites3 and merged it to data on enrollment by race and ethnicity and institutional characteristics from IPEDS; we also merged to data on Barron’s selectivity classification. We describe the data collection and construction in more detail here.
Interpreting colleges’ answers on the CDS is not completely straightforward. While some data colleges provide on the CDS—like how many students they enroll—could (at least in theory) be checked against other sources, there is no way to know whether a college really considered racial/ethnic status in admissions or how it was weighted. We cannot use these data to, for example, predict changes in enrollment under race-blind admissions. The measure we use here is whether a college said they consider racial/ethnic status in admissions and publicly posted that information, albeit as part of a larger data collection. The CDS contains extensive information not only about admissions but also other institutional characteristics. The decision to post the CDS data is most likely not specifically related to the desire to share information about the use (or not) of affirmative action in admissions. More-selective colleges are more likely to post the CDS data on their website, probably because they are competing for applicants who might wish to consult that information.
Many undergraduates attend two-year and less-selective four-year colleges
Discussions about college admissions tend to focus on selective four-year colleges, but many undergraduates attend public two-year colleges (community colleges), for-profit colleges, or open-access four-year colleges, which typically have minimal admissions requirements. Because these institutions do not ration access through admissions, who is allowed to attend will be largely unaffected by the Court’s decision. Such institutions may have other race-conscious programs such as scholarships or targeted recruitment programs that might be affected depending on how they interpret the decision; we do not have data on the prevalence of these practices.
In the analysis here, we focus on first-time, full-time undergraduates, but we note that many college students attend part-time or return to college later in life; those students also mostly attend institutions that do not have selective admissions so will not be affected by the Court’s decision. Figure 1 shows the distribution of enrollment across institution types for the fall of 2019. Overall, a quarter of full-time first-year undergraduates attend public two-year colleges, 43% attend open-access or minimally selective four-year colleges, and 3% attend for-profit institutions; the remaining 30% attend four-year colleges that have selective admissions, though even in this category many institutions admit most applicants.4 Students from historically excluded racial and ethnic backgrounds (i.e., Hispanic/Latino, Native American, and Black students) are more likely to attend public two-year colleges or non-selective four-year colleges. For example, 29% of Black students, 34% of Hispanic/Latino students, and 37% of Native American students attend public two-year colleges. Compared to the other groups, white, Asian/Pacific Islander (PI), and multi-racial students are more likely to attend a four-year institution with selective admissions.
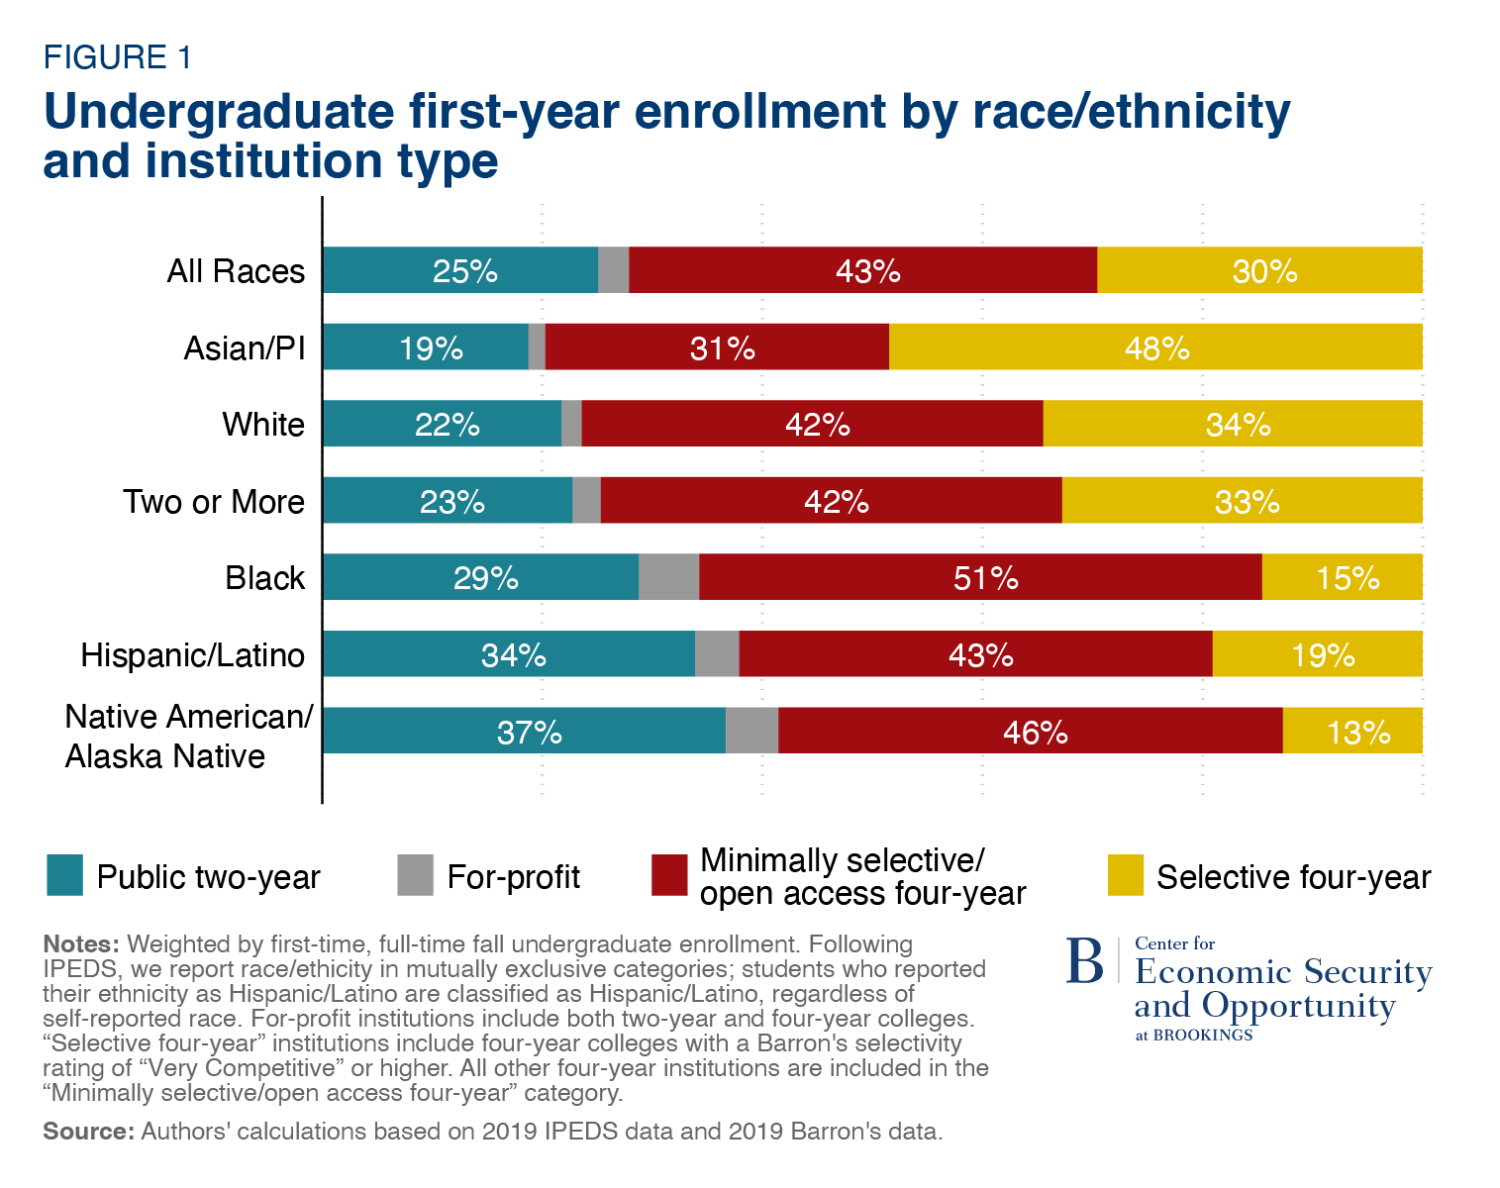
Even without the data on which colleges said they considered race in admissions, Figure 1 suggests that a large share of Black, Hispanic/Latino, and Native undergraduates attend institutions that will be largely unaffected by the Court’s decision, since they do not ration access with selective admissions.
Highly selective colleges were most likely to consider race in admissions
Our newly collected data shows that more selective institutions were substantially more likely to consider race in admissions, consistent with earlier research. Going forward, we refer to colleges that indicated they consider racial/ethnic status in admissions as practicing “affirmative action” (or AA) for ease of exposition, although as noted above, we do not know whether in fact they put weight on race in their decisions, or how much.
The first panel of Figure 2 shows how AA use varied among four-year colleges, depending on their Barron’s selectivity category and weighted by first-time full-time enrollment.5 Barron’s categorizes colleges based on their admissions rates and the standardized test scores, high school grades, and class rank of the entering class. The classifications provide a reasonable ranking by selectivity, even if there is some arbitrariness to the exact category in which any particular college is placed.
Among the most competitive institutions, 76% used AA (the orange bars), but this percentage declines consistently with selectivity. In the three least selective categories, which together account for over half of enrollment, 8% or less of students attend colleges that used AA.6 The second panel shows the more selective institutions that were most likely to practice AA do not collectively enroll a large share of students. That is, in some sense, what it means to be selective. The top two groups enroll 21%, and the next group enrolls another 20%. Institutions in the bottom three categories—where AA was rarely used—enroll 59% of students.
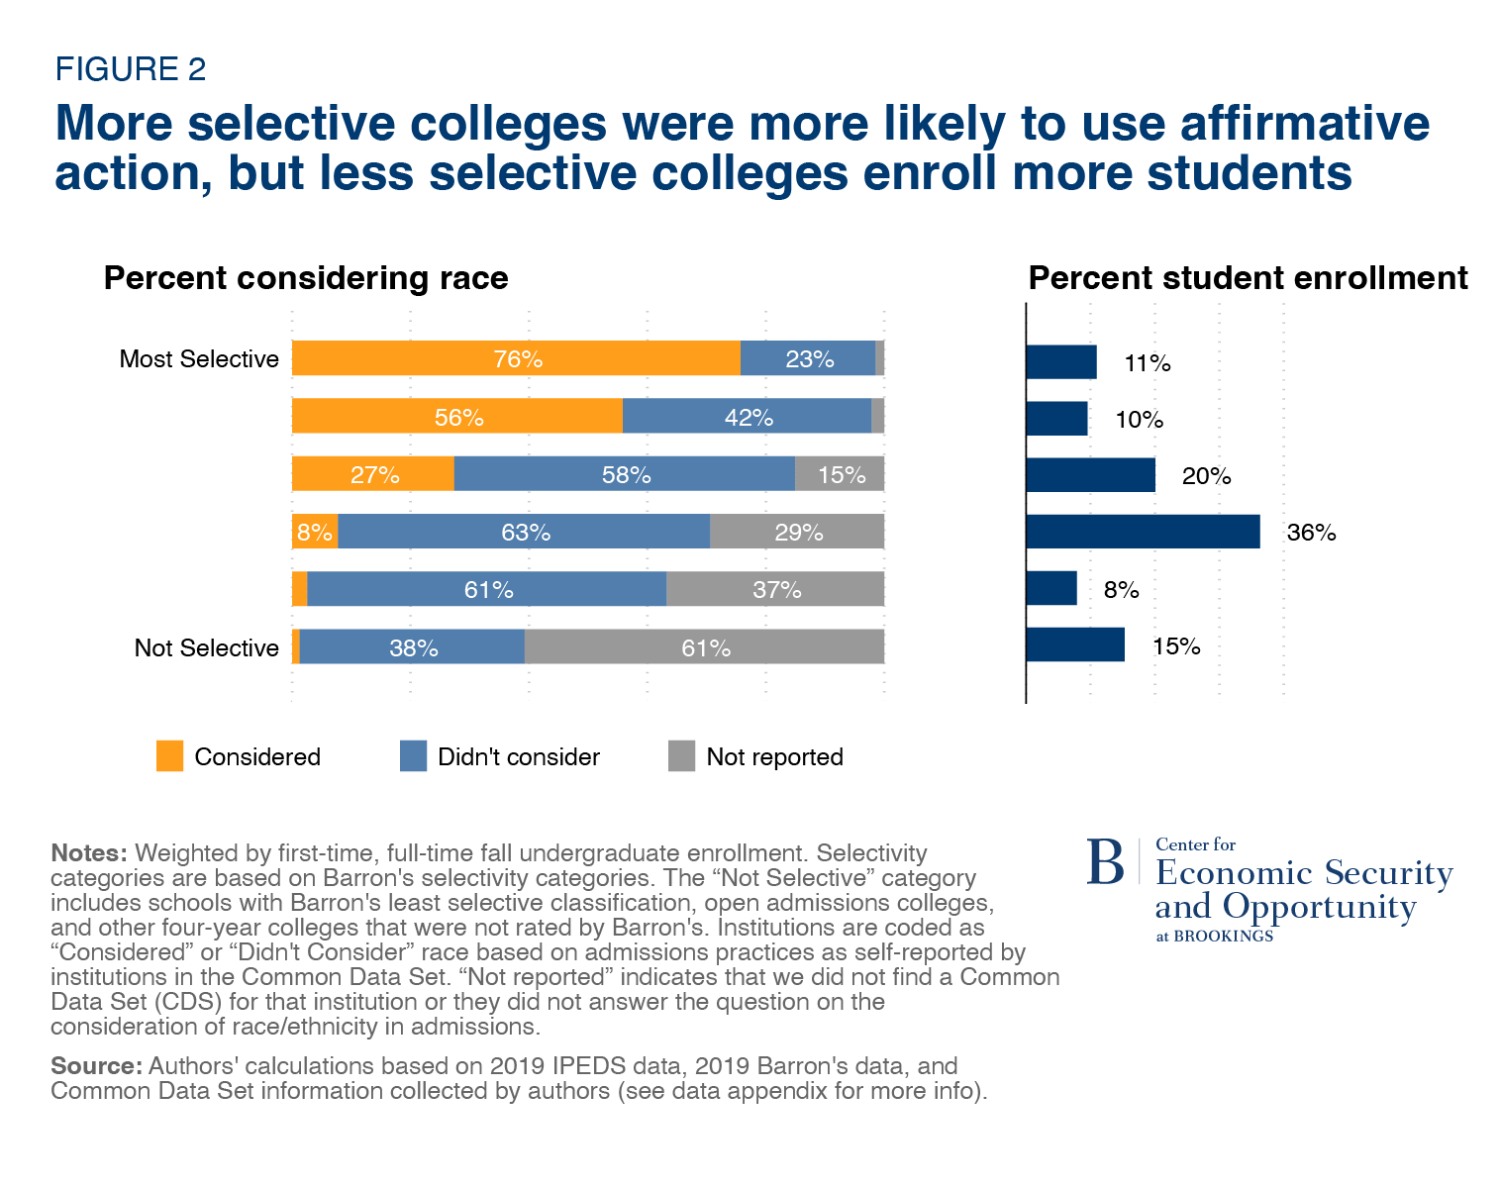
The share of colleges that do not post their CDS (the gray bars) also increases as selectivity decreases.7 Below, we assign the “Not reported” colleges to AA-use categories based on their Barron’s selectivity category. Among less selective colleges that reported on their use of AA, a very small share said they considered race, and these colleges are less likely to need to use AA to achieve racial diversity. We assign non-reporting colleges in the bottom three selectivity categories to “Probably didn’t consider,” and those above the bottom three categories to “Maybe considered.”
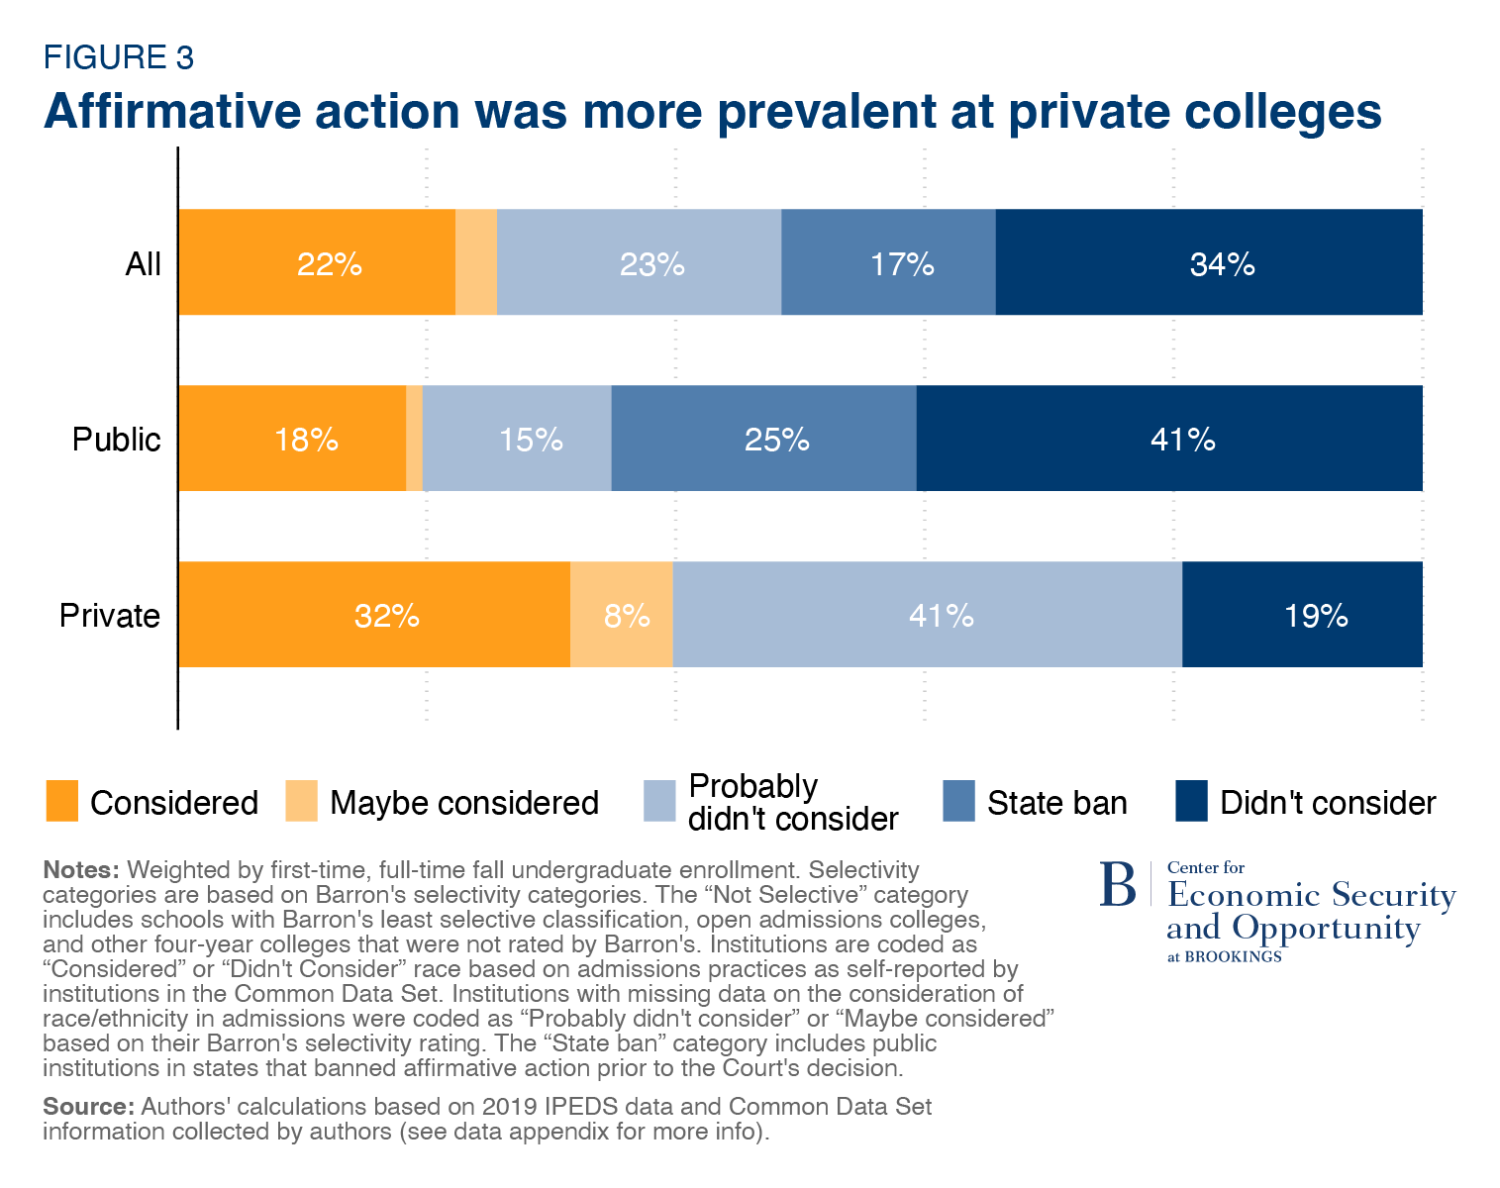
Private colleges were more likely than public colleges to consider race in admissions
Over two-thirds of four-year college students attend a public institution, and state policies prohibited the consideration of race in admissions at public colleges in nine states even prior to the SFFA decision. In Figure 3, we disaggregate the “didn’t consider” category to show how many colleges didn’t consider race because they are public institutions in states that banned the practice. We also assign institutions for which we did not find data to “maybe considered” or “probably didn’t consider” based on their level of selectivity as described above.
The first bar of Figure 3 shows that 22% of four-year college students attend a college that reported practicing affirmative action, 34% attend a college that said they did not consider race in admissions, and 17% attend public colleges in states that banned the consideration of race/ethnicity in admissions. The remaining 26% attend colleges for which we did not find CDS data; 3% of those are selective so might have considered race (the light orange) and 23% are not very selective and probably did not consider race (the light blue).
Public colleges were less likely than private colleges to use AA, in part, but not only, because some were banned by law. Among public colleges, 18% reported considering race, 25% did not consider race and were in ban states, and 41% indicated they did not consider race and were not in ban states. Private colleges were more likely than public colleges to say they considered race but also more likely to not post their CDS data at all. Private colleges are also more selective on average, compared to public colleges. The gap in AA use between public colleges in non-ban states and private colleges is about one-third to half as large within selectivity categories as it is overall. This suggests that—in addition to state bans—differences in selectivity also explain part of the public-private gap in the use of race-conscious admissions.
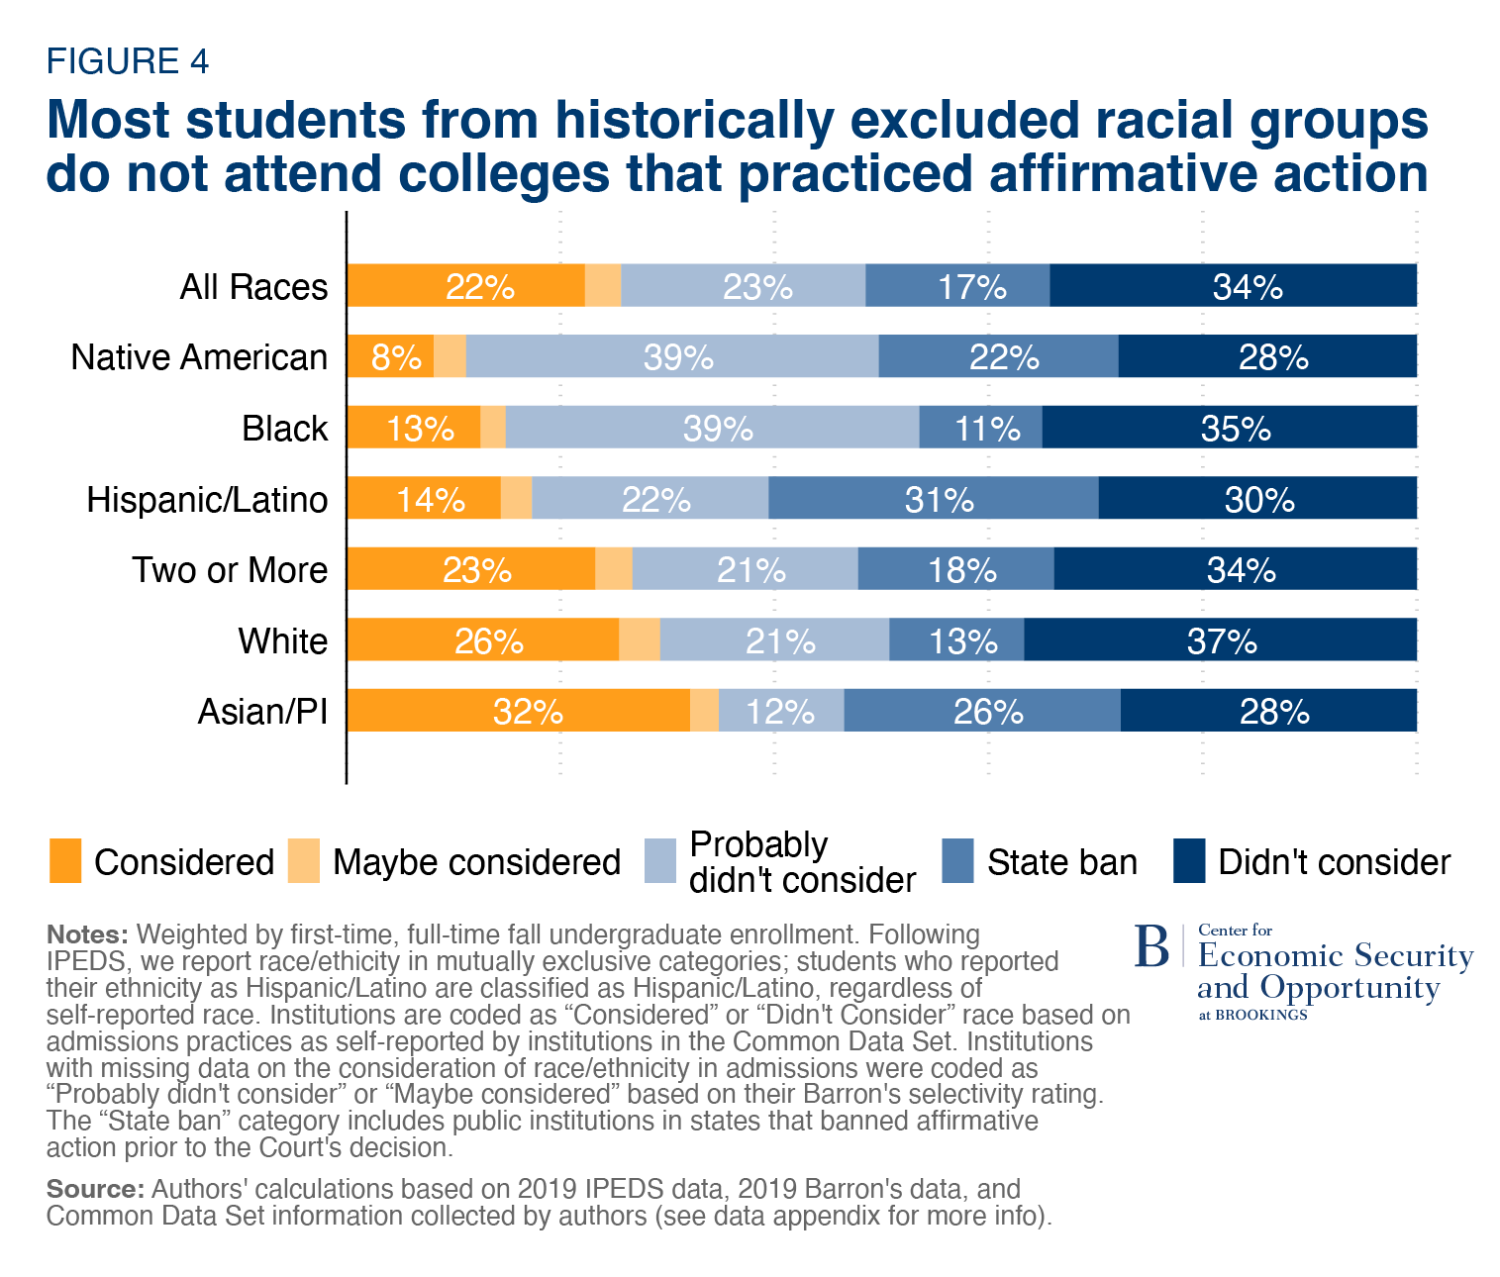
Majority of historically excluded racial/ethnic groups attend colleges that did not use AA before SFFA
Figure 2 shows that affirmative action was more commonly used by the most selective colleges, but those colleges do not enroll a large share of students. In addition, students from historically excluded racial and ethnic groups are under-represented at more selective colleges, even though those institutions considered race in admissions. As a result, Black, Hispanic/Latino, and Native students mostly attend colleges that did not use AA prior to the SFFA decision. This is shown in Figure 4. Only 8% of Native, 13% of Black, and 14% of Hispanic/Latino students attend a college that said they practiced affirmative action in admissions.8
Because they are more likely to attend more-selective colleges, Asian/PI four-year students are most likely to be enrolled in colleges that considered race in admissions (32%), followed by white students (26%) and those identifying with two or more races (23%).
Conclusion
While our data on the use of affirmative action prior to the SFFA decision is self-reported by colleges and we do not know how much colleges considered race when they used AA, the findings provide a basis for understanding the prevalence of AA within higher education and the potential effects of the Students for Fair Admissions decision. The data shows that a small share—most likely less than 15%—of four-year college students from historically excluded racial backgrounds attended colleges that practiced affirmative action prior to the Court’s ruling. This is because these students largely do not attend the more selective colleges that were most likely to use affirmative action prior to SFFA. Additionally, because many students—and disproportionately Black, Hispanic/Latino, and Native students—attend two-year institutions, the total share of underrepresented groups attending affected institutions is even smaller.
More selective and elite colleges receive media attention that is wildly disproportionate to the number of students they educate. To be sure, attention to the composition of enrollment at selective colleges is warranted, considering they offer high returns for students from disadvantaged backgrounds and their graduates are over-represented among elites in government, business, and media. Indeed, eight of the nine justices who ruled on the Harvard and UNC cases graduated from law school at Harvard or Yale, one-third of Biden’s initial cabinet is Harvard-educated, and graduates of elite colleges are more likely to have very high earnings or work at a prestigious firm as adults.
Importantly, we focus on admissions here, but the decision has created legal uncertainty about a broad range of programs and practices designed to help people from marginalized racial backgrounds. The effects of the decision on a range of race-conscious practices in higher education—scholarship programs, outreach, campus support programs—is unclear. Notably, our analysis is limited to undergraduate admissions, but graduate and professional schools (such as law and medical schools) that practiced race-conscious admissions are also affected by the decision, so we may see reductions in Black, Hispanic/Latino, and Native representation in those programs—and professions. These are important trends to watch.
Applying to college is complicated and shrouded in mystery, especially for students who would be the first in their family to go to college, those from historically excluded racial and ethnic groups, and those without access to high-quality college counseling. Research suggests that the end of affirmative action can lead to a reduction in applications from underrepresented minority students to selective institutions—sometimes called a “chilling effect.” While it is difficult to know how high schoolers from different backgrounds are receiving the current discussion, it would be unfortunate if the death of affirmative action reduced college applications from qualified Black, Hispanic/Latino, and Native students.
Related Content


Authors


-
Acknowledgements and disclosures
The Brookings Institution is financed through the support of a diverse array of foundations, corporations, governments, individuals, as well as an endowment. A list of donors can be found in our annual reports published online here. The findings, interpretations, and conclusions in this report are solely those of its author(s) and are not influenced by any donation.
-
Footnotes
- Arizona, California, Idaho, Nebraska, Oklahoma, Michigan, Florida, New Hampshire, and Washington.
- College Board used to include the information about whether colleges consider race/ethnicity in admissions (along with information about other factors they consider) at the Big Future website, but that is no longer the case. U.S. New does not appear to have ever included this information in their rankings.
- After we began collecting the data from colleges’ website, we learned that researchers can request access to the Annual Survey of Colleges, which includes the Common Dataset elements, from the College Board. Since we already collected much of the data from college websites, we chose not to request access through the College Board due to the cost and timeframe involved. In addition, although it would be interesting to see how colleges who do not post their CDS answers publicly respond to the questions about consideration of racial/ethnic status, it is not clear how to interpret their responses. The responses can’t accurately convey how much weight colleges actually put on racial/ethnic status in admissions, and when they are not public, they are also not a public signal of colleges’ values or intentions.
- Measuring the selectivity or competitiveness of institutions is difficult. The admit rates reported in IPEDS do not tell the whole story because the number and type of applications an institution receives varies. We rely on Barron’s ratings—which also take account of the test scores, high school grades, and class rank of enrolled students—to classify colleges by selectivity. We (somewhat arbitrarily) classify colleges with Barron’s ratings of “Very Competitive” or higher as “selective.” By this definition, the average acceptance rate of four-year selective colleges is 57% (but is as low as 2%); the average acceptance rate of four-year non-selective colleges is 81%.
- There are six main Barron’s selectivity categories, as well as an additional category that includes specialized schools such as health sciences and music schools. We exclude students attending specialized schools from our analysis and group schools with an open admissions policy and other schools unrated by Barron’s with schools in Barron’s least selective category. Barron’s data are from 2019. Throughout, we weight by the number of first-time, full-time undergraduate students enrolled in the fall of 2019, according to IPEDS.
- The share of colleges that do not complete and publicly post their CDS data increases as selectivity declines. We were able to find the CDS data accounting for all but 1% of the enrollment in most competitive colleges. How should we interpret the missing data? We think that most of the less-competitive colleges that do not post their CDS data did not practice affirmative action. Less-selective institutions often do not need to use affirmative action to achieve racial diversity, and among those who did post their data, most report that they did not consider racial/ethnic status. For example, in the “Competitive” category, about 10% of students are enrolled at colleges that reported considering race within publicly posted CDS data. In a version of Figure 2 excluding the institutions that did not post their CDS, this pattern looks similar, but the percentage of colleges using affirmative action is slightly higher. For example, among colleges with non-missing data, 77%, 57%, 32%, and 11% of enrollment in the top four selectivity categories is at colleges that considered race, compared to 76%, 56%, 27%, and 8%, respectively.
- While a small number of institutions did post their CDS but did not answer the question about consideration of race/ethnicity, the vast majority of missing data arises because we did not find a CDS at all.
- About 20% of Black first-year four-year college students attended Historically Black Colleges and Universities (HBCUs). Although they have a long-standing mission of serving the Black community and enroll primarily Black students, the HBCUs for which we found CDS data all indicated that they did not consider race in admissions. Many HBCUs, however, did not post their CDS data at all.
The Brookings Institution is committed to quality, independence, and impact.
We are supported by a diverse array of funders. In line with our values and policies, each Brookings publication represents the sole views of its author(s).