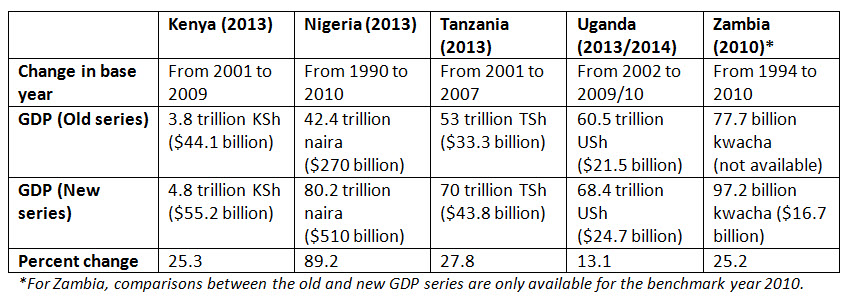
Rebasing gross domestic product (GDP)—revising the methods and base data used to calculate GDP—has become a growing trend among African countries in recent years. The process, which provides a clearer picture of an economy’s size and structure, has implications for a wide array of economic stakeholders: For instance, updated figures allow governments to better evaluate their fiscal positions and potential revenue bases while providing investors with more accurate information on which to base their investment decisions. (See the Kenya National Bureau of Statistics report on the Revised National Accounts for a more detailed analysis of these implications.) In 2014 alone, Kenya, Nigeria, Tanzania, Uganda, and Zambia all completed rebasing exercises, which led to significant revaluations of their GDPs: Nigeria’s latest (2013) GDP nearly doubled, Tanzania’s grew by a third, Kenya’s and Zambia’s increased by a quarter, and Uganda’s rose by 13 percent.
Below, we focus on how these recent GDP revisions have generated more accurate data, enabling fine-grained research into the following questions: How has the structure of African economies changed over the past decade? How have different sectors grown and contracted? Answering these questions is important to ensuring that Africa’s economic growth remains sustainable, becomes more inclusive, and supports efforts to reduce poverty. In fact, in a recent paper on economic growth and convergence (Is Africa at a Historical Crossroads to Convergence?), we stress the need to better understand the ongoing structural changes taking place in Africa and call upon relevant authorities to implement national statistical development strategies to enhance analysis on these transformations. These recent GDP rebasing exercises are useful steps in this direction and yield practical information to advance economic research. Some major gaps in African economic data still exist (see Morten Jerven’s 2013 piece, Why We Need to Invest in African Development Statistics: From a Diagnosis of Africa’s Statistical Tragedy Towards a Statistical Renaissance) and have led to calls for a “Data Revolution” in Africa (see the Center for Global Development’s Delivering on the Data Revolution in Sub-Saharan Africa).
What do these boosts in GDP signify?
Nigeria’s rebasing, which lifted its GDP from $270 billion to $510 billion in 2013, revealed not only that its economy surpassed South Africa’s to become the largest in Africa, but that its share of sub-Saharan African GDP grew from 21.3 percent to 31.7 percent. Kenya’s revised 2013 GDP of $55.2 billion augmented its per capita income from $994 to $1,269, allowing Kenya to be re-categorized from a low-income to a lower-middle-income country according to World Bank metrics.
[1]
Effects have implications outside borders: The East African Community (EAC) grew its regional economy by nearly a fifth (from $110.3 billion to $134.9 billion) following the rebasing of three of its five member countries in 2014. These substantial boosts in GDP raise the profile of these countries as attractive investment destinations and can help improve investor confidence in the region.

Importantly, these sudden increases in GDP did not make these countries richer overnight. In fact, the sudden expansion of GDP has no immediate impact on the vast majority of the countries’ citizens—poverty rates remain high, and performance in social development indicators has not changed.
Instead, the revised GDPs showed that, prior to rebasing, calculations relied on outdated figures (related to the overall price structure of their economies), and no longer accurately represented the size or composition of their economies. Revised GDPs take into account formerly omitted economic activities performed by informal businesses, as well as recent booms in several sectors, such as information and communications technologies (ICTs), telecommunications, banking, and real estate. By updating the base figures for these calculations and incorporating previously overlooked sectors, they provide a much more precise assessment of the economies’ sizes and sectoral contributions to GDP.
Drivers of sustainable growth
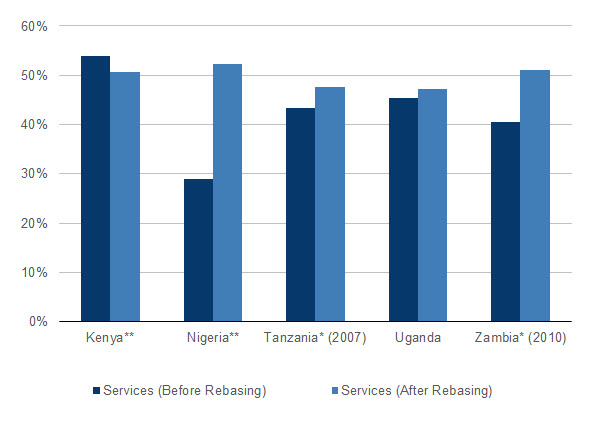
The revised GDP series for Kenya, Nigeria, Tanzania, Uganda, and Zambia highlight an important trend that generally aligns with findings from the World Bank and others—that the services sector is the single largest component of African economies (accounting for half or more of total GDP), while the manufacturing and agriculture sectors remain essentially unchanged or have shrunk. Fueled by Africa’s vast and growing labor resources, services sectors across the continent have expanded in recent years, but this growth may have been largely based on low-productivity activities that are unlikely to spur accelerated growth.
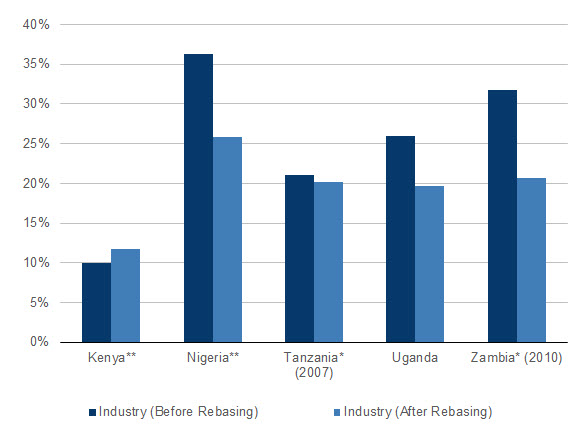
Indeed, in reviewing the detailed analysis of the revised 2013 figures for these five countries, we see that, in addition to massive upward revaluations of GDP, the following changes in GDP composition by sector—largely increases in services, declines in industry, and relatively stable contributions from agriculture—took place (see Figures 1-3 for a comparison of changes among the five countries):
- In Kenya, the rebasing found slight increases in the contribution of agriculture and industry to the economy than previously estimated, and a minor decrease in the contribution of services. However, interestingly, within the services sector, many new subdivisions were created for fast-growing sectors such as ICT, which was formerly classified under transport, storage, and communications. From 2010 to 2013, agriculture’s share of GDP grew slightly, while industry and the services’ sectors shares declined.
- In Nigeria, the revised GDP estimate included measures of 46 industries (up from 33 in the previous calculation). Oil and gas’s share of GDP decreased from 32 to 14 percent, as did agriculture’s, from 35 to 22 percent. Yet, the share of telecommunications increased from 2 to 7 percent, contributing in part to the massive boost from 26 to 51 percent of the services sector’s share of GDP. Manufacturing also rose from 0.9 to 9 percent. In terms of the changing composition of GDP over the period 2010 to 2013, agriculture and mining generally declined in their contributions to GDP, while industry and services have increased.
- In Tanzania, the revised GDP for the 2007 benchmark year saw small downward revaluations of agriculture (from 27.1 to 26.8 percent) and industry (21.1 to 20.2 percent), but an upward revision for the services sector (from 43.3 to 47.6 percent). In terms of the changing composition of GDP over the period 2007 to 2013, the contribution of agriculture to GDP actually grew to 31.7, while services decreased to 40.4 percent. Industry declined to 15.6 percent in 2010 before rising again to 17.5 percent in 2013.
- In Uganda, we see that the share of industry in the revised GDP figure decreased from 26.6 percent to 20.8 percent, predominantly due to the previous overvaluation of the contribution of construction. Yet, manufacturing (as a sub-sector of industry) rose from 8.0 percent to 10.0 percent in the recalculated figure, and agriculture and services also increased to 24.8 and 47.1 percent (from 22.2 and 45.4 percent, respectively) of the economy for 2013. Over the past several years the shares of these sectors to the economy have remained fairly stable.
- In Zambia, wholesale retail and trading made the largest contribution to the revised GDP for the 2010 benchmark year, at 18.4 percent up from 14.4 percent. Construction and agriculture approximately halved from their pre-revised figures to 10.9 percent and 9.9 percent, respectively. Mining, on the other hand, was revalued from 3.7 percent to 12.9 percent of GDP. In terms of the changing composition of GDP over the period 2010 to 2013, agriculture has remained stable in its share of GDP, while industry and the services sectors have increased their shares, and the share of mining has declined considerably.
Figure 1. Agriculture, Share of GDP Before and After Rebasing (2013)

Source: National Statistics Bureau.
Note: *For Tanzania and Zambia, sectoral comparisons were only available in the benchmark years of 2007 and 2010, respectively.**Values for Kenya and Nigeria are post-tax.
Figure 2. Industry, Share of GDP Before and After Rebasing (2013)

Source: National Statistics Bureau.
Note: *For Tanzania and Zambia, sectoral comparisons were only available in the benchmark years of 2007 and 2010, respectively.**Values for Kenya and Nigeria are post-tax.
Figure 3. Services, Share of GDP Before and After Rebasing (2013)

Source: National Statistics Bureau
Note: *For Tanzania and Zambia, sectoral comparisons were only available in the benchmark years of 2007 and 2010, respectively.**Values for Kenya and Nigeria are post-tax.
A case for refocusing on services sub-sectors
These rebasing exercises have helped to clarify the diversity within select African economies, providing policymakers with a better fundamental understanding of the structural changes their economies are undergoing. But revised statistics alone will not ignite economic growth across the continent—they must be integrated into the ongoing development policy debates occurring in these countries. In particular, the rise in the services sector’s share of GDP together with gradual or no increases in the shares of industrialization and agriculture may have significant implications for sustaining the region’s growth, as noted by Rodrik (2014):
“The traditional engines behind rapid growth and convergence, structural change and industrialization, are operating at less than full power… If African countries do achieve growth rates substantially higher than what I have surmised, they will do so pursuing a growth model that is different from earlier miracles based on industrialization. Perhaps it will be agriculture‐led growth. Perhaps it will be services. But it will look quite different than what we have seen before.”
Keeping these changes in mind, policymakers must now focus on the sectors that are most poised for transformation and consider how they can provide targeted support. A consensus seems to be forming policies that can draw more labor into and reinvigorate manufacturing including through agro-processing activities, boost agricultural productivity through the use of high-value crops, and develop labor force skills to improve productivity in services.
A good start, in our view, is to delve more deeply into the African services sector. So far the debate on the services’ potential to accelerate growth in Africa has centered on the opportunities presented by mobile phone technology and the ICT sector more generally in creating jobs and raising productivity. But in Nigeria, as discussed above, the telecommunications sector accounts for only 7 percent of GDP while the services sector’s share of GDP is 51 percent. What is happening in the rest of the services sub-sectors which account for 44 percent of GDP? Are the other key sub-sectors, including trade, real estate, and construction, creating sustainable and inclusive jobs for Nigerian workers? Are they helping them acquire new skills and use more technology? Or do they mostly constitute informal activities?
More exploration of the linkages between growth, employment and productivity is needed beyond the ICT sub-sector in often understated sub-sectors (for example construction), which could hold great, untapped potential to provide jobs and skills development to local workers as it has done in other regions of the world (see Figure 3 in Jeffrey Gutman’s post, Foresight Africa 2015: Infrastructure Requires More Than Raising Money). In this sense, we must take both a nuanced, yet holistic approach to understanding the services sector, by looking at the sub-sectoral employment and GDP data and determining which activities require additional investment to enhance productivity, and lead to inclusive growth for the sector.
But formulating good policies will be easier than implementing them. As Lant Pritchett and Larry Summers put it:
“…sustained economic growth typically relies on continued structural transformation in which new industries arise, but also old industries shrink—sometimes just relatively, but sometimes absolutely. While essential to sustained economic growth, neither governments nor existing firms like destruction—with its geographic shifts, employment shifts, and firm exits that are a necessary part of weeding out uncompetitive industries.”
[1] Countries with more than $1,045 but less than $12,746 per capita are considered middle income according to the World Bank.


Commentary
Are African countries rebasing GDP in 2014 finding evidence of structural transformation?
March 3, 2015