Trade continues to dominate the political and economic headlines, with President Trump announcing a new round of tariffs on $200 billion worth of Chinese goods. This latest comes on the heels of a summer during which the president vacillated between threats of additional tariffs—on auto imports and China—and friendly proclamations with the European Union to work towards “zero tariffs.”
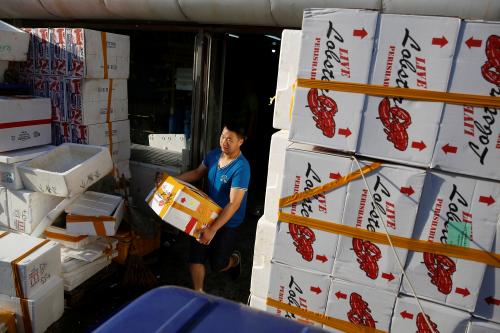
The United States’ three largest trading partners—China, the European Union (EU), and NAFTA (Canada and Mexico)—have responded in-kind. These three trading partners have implemented tariffs on over $120 billion of U.S. exports.

This short analysis reviews the exposure local communities have to these trade policy changes. It draws on the Export Monitor, a unique dataset developed as part of the Global Cities Initiative, to estimate which local and regional economies rely the most on export industries targeted by retaliatory tariffs. Of course, the U.S.-imposed tariffs on imports also affect cities, regions, and states—as well as the firms, workers, and consumers within them.
Retaliatory tariffs now touch about 6.1 percent of total U.S. exports
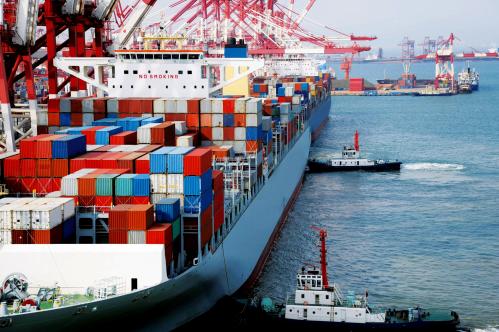
China, the EU, and the NAFTA countries have now implemented tariffs on about $121 billion worth of U.S. exports. While that number has grown rapidly over the past several months, it still only represents about 6.1 percent of the $2 trillion in total U.S. goods and services exports in 2017. Our analysis indicates China’s retaliatory stance is strongest, accounting for $101.4 billion of the U.S. exports implicated by tariffs. We also estimate $12.8 billion of U.S. exports under Canadian tariffs, $3.5 billion under Mexican tariffs, and $3.3 billion under EU tariffs.

Tariff-impacted export industries support about 650,000 jobs
To extend the analysis we conducted in April on the impact of Chinese tariffs, we converted the products on the tariff lists announced by China, the EU, Canada, and Mexico to four-digit NAICS industry definitions. We then examined the share of overall U.S. exports in tariff-affected commodities among each four-digit industry going to each of these markets. For instance, both China and the EU tariff lists target motor vehicles, so we estimated the share of total U.S. motor vehicles exports that go to China and the EU using national trade data. We then assigned that national ratio to each U.S. county exporting motor vehicles. This methodology estimates the local impact of the tariff changes that, while admittedly blunt, provide the best first-order guess with the available data at hand.
Based on this method, we estimate that the tariffs may affect about 294,000 direct export jobs. But those jobs support an additional 354,000 jobs, which means the tariffs implicate a little less than 650,000 jobs overall. These jobs estimates seek to isolate those jobs that depend on exports to the countries that have introduced retaliatory tariffs; they are not estimates of anticipated job losses.
Regional economies specializing in agriculture, metals have the highest share of exports in tariff-affected industries
This method results in a region-by-region estimate of the exports—and export-supported jobs—generated by industries under the scope of retaliatory tariffs. Nationally, the tariffs touch about 6.1 percent of exports. But there is significant local variation across the 962 metropolitan areas, micropolitan areas, and rural geographies in our Export Monitor database, from a low of 0.3 percent of exports and 0.2 percent of export-supported jobs in Los Alamos, N.M. to a high of 26.1 percent of exports and 24.1 percent of export-supported jobs in Blytheville, Ark. In the median region— Orangeburg, SC—tariff-affected industries account for about 8.8 percent of exports.
The retaliatory tariffs differ by trading partner, but there are some commonly targeted industries. All four markets focused tariffs on agricultural products. Agriculture cuts a very specific geography across the United States, particularly implicating metro areas in California’s Central Valley as well as rural areas and small towns in states like Illinois, Iowa, and Nebraska. Regional economies specializing in metals and certain segments of manufacturing also jump to the top of the list in terms of export exposure, led by Birmingham, Ala.; Nashville, Tenn.; and Toledo, Ohio.

Export dependence in tariff-affected industries is highest in rural areas and small towns
The nation’s major regional economies have the largest volume of exports in tariff-affected industries; Houston, Chicago, Los Angeles, Dallas, Seattle, and Detroit all exceed $2 billion in exports in targeted industries.
But partly due to their sheer size—and reliance on exports in higher value-added services outside the scope of the tariffs—large metropolitan areas, on average, have a much lower share of their exports in tariff-affected industries than smaller metro areas and rural communities. Across the 100 largest metro areas, only about 4.4 percent of exports (3.5 percent of export-supported jobs) are in tariff-implicated industries. That share jumps to 7.5 percent (7.5 percent of export-supported jobs) in smaller metro areas, 9.5 percent in micropolitan areas (9.8 percent of export-supported jobs), and 12.2 percent in rural areas (13.4 percent of export-supported jobs).

Counties that voted for President Trump have higher reliance on tariff-affected exports
Trade policy is inextricably linked with politics, and the retaliatory tariffs seem geographically and industrially targeted to mobilize political angst. A county-level analysis reveals that, while a political diversity of places will be implicated, counties that voted for President Trump are more exposed to the tariffs, as measured by the share of exports in tariff-affected industries (8.1 percent) and the share direct and indirect jobs those exports support (8.1 percent). Comparatively, in counties that voted for Hillary Clinton, 4.2 percent of exports are in tariff-affected industries, which support about 3.2 percent of export jobs.

The trade standoff between the United States and its North American partners shows signs of easing with progresses made on the United States-Mexico-Canada Agreement (USMCA). However, trade relations with China remain tense.
China is actually placing propaganda ads in the Des Moines Register and other papers, made to look like news. That’s because we are beating them on Trade, opening markets, and the farmers will make a fortune when this is over! pic.twitter.com/ppdvTX7oz1
— Donald J. Trump (@realDonaldTrump) September 26, 2018
This analysis provides a look at how regions and states are positioned given their distinctive firms and industries, an important starting point that provides greater understanding to subnational leaders of how a significant macroeconomic policy change influences their place.
The authors thank Sifan Liu for research assistance.
Methodological note: The U.S. exports under retaliatory tariffs announced by U.S. trade partners may slightly differ from the ones in our analysis. Countries release tariffs lists using 10-digit Harmonized Tariff Schedule (HTS) specific to their domestic trade statistics. Converted to the 6-digit universal standard Harmonized System (HS) used by the U.S. Census, U.S. trade data falls in broader categories. When possible and to get closer to the trade partners’ intent, our analysis matched HTS codes at the 8-digit level.


