The Issue In Brief
As governors unveil their Fiscal Year (FY) 2013 budgets, it is an opportune time to look back. In the recent recession, states confronted their worst revenue declines on record together with rising demands for Medicaid and other public services. The result was massive budget shortfalls, or gaps between projected revenues and expenditures. Because they are generally expected to balance their budgets each cycle, states were compelled to raise revenues, cut spending, or draw on budget reserves and enhanced federal funds. Now, state revenues are rebounding but remain below 2008 peak levels.
At the same time, federal policymakers are facing their own fiscal challenges. Federal debt is expected to surpass the size of the national economy within a generation. Although automatic spending cuts triggered by Congress’ super committee will improve short term deficits, they do not address long term imbalances between revenue collections and spending commitments. Moreover, recent political stalemates over the federal budget, debt limit, and expiring tax and spending provisions suggest that addressing these challenges will be daunting.
A natural question is what, if anything, federal policymakers can learn from states’ recent budget balancing experiences. Federal policymakers have long looked to states as a source of innovation in policy areas ranging from K–12 education to health care and welfare reform. They have also borrowed from state and local fiscal institutions, including the idea of an executive budget. More recently, proponents of a federal balanced budget amendment to the U.S. Constitution have invoked the states as an example where such rules have worked.
This policy brief examines potential budgeting lessons for the federal government from the states. After some background on state and local government finances, it reviews how states addressed major budget shortfalls. It next considers the effectiveness of state balanced budget requirements and other restrictive fiscal institutions. The brief concludes by exploring differences between state and federal policy environments and limits to generalizing from state experiences.
Background on State and Local Government Finances
The United States is a highly decentralized country with a rich federalist tradition. American states preceded the federal government and the Tenth Amendment to the U.S. Constitution reserves to them any powers not specifically granted to the federal government. In 1900, states and localities raised $1.75 for every $1.00 of federal revenue and they performed all government activities except national defense, foreign relations, court proceedings, and postal services.
This picture changed dramatically with the onset of the Great Depression and World War II when the federal government created new social insurance programs and expanded its military. Nevertheless, even as it grew, the federal government continued to rely on states and localities to deliver public goods and services such as infrastructure and a social safety net. From 1933 to 1940, grants to state and local governments grew from a negligible portion to more than 9 percent of the federal budget.
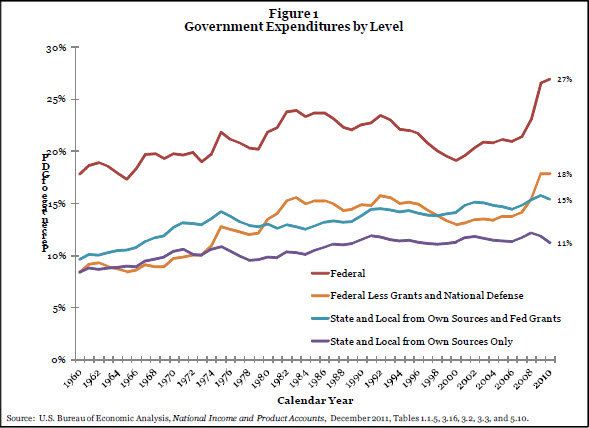
Today, state and local grants represent about 17 percent of federal outlays. Total federal spending represents about 27 percent of Gross Domestic Product (GDP), whereas state and local spending from their own sources represents about 11 percent (Figure 1). These figures are skewed somewhat in the direction of increased federal spending by the recent recession. Federal spending since 1960 has averaged 21 percent of GDP.

However, if we exclude national defense from federal totals and assign intergovernmental grants to the level where they are ultimately spent, federal spending drops to 18 percent of GDP and state and local spending rises to 15 percent in 2010. By this measure, state and local governments have outspent the federal government by an average of one half percentage point of GDP since 1960.
Perhaps more importantly, state and local governments provide goods and services that shape the U.S. economy and individual well being. States and localities fund more than 90 percent and deliver all of public elementary and secondary education. They enroll three quarters of higher education students and undertake three quarters of all infrastructure spending. They also help maintain the social safety net through their own public assistance programs and their participation in joint federal-state programs such as Medicaid, Unemployment Insurance (UI), and Temporary Assistance to Needy Families (TANF).
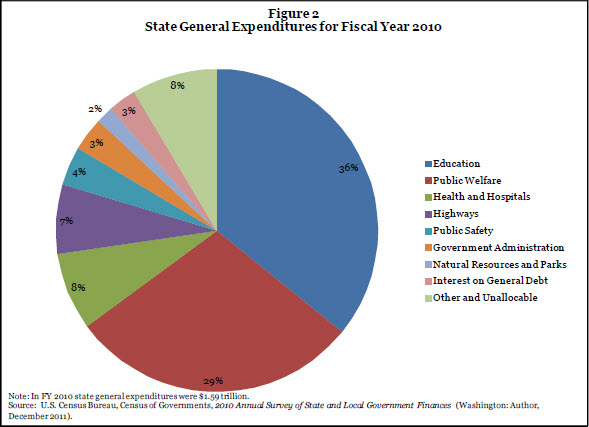
Figure 2 reflects these spending priorities. In FY 2010, as over the past thirty years, education, public welfare (including Medicaid), health, and hospitals dominated state spending. Demands for these programs tend to rise when the economy is faring poorly.

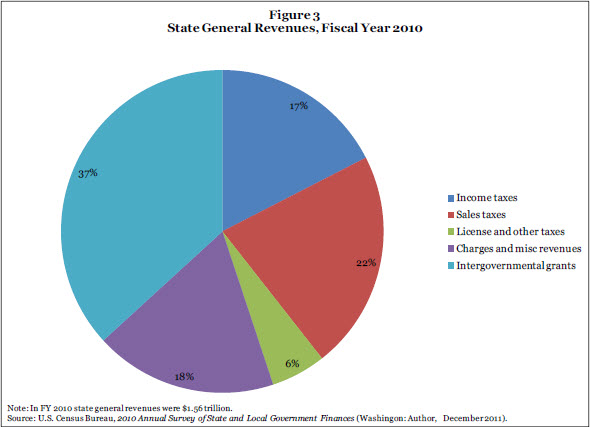
Meanwhile, states derive most (70 percent) of their revenues from their taxes, fees, and service charges (Figure 3). In particular, they rely on income taxes for 34 percent of tax revenue, compared to 25 percent in 1977. These taxes have become more volatile over time as incomes increasingly comprise earnings from volatile sources like stock options and capital gains. As a result, state revenues fluctuate strongly with the economy—they are pro-cyclical.


