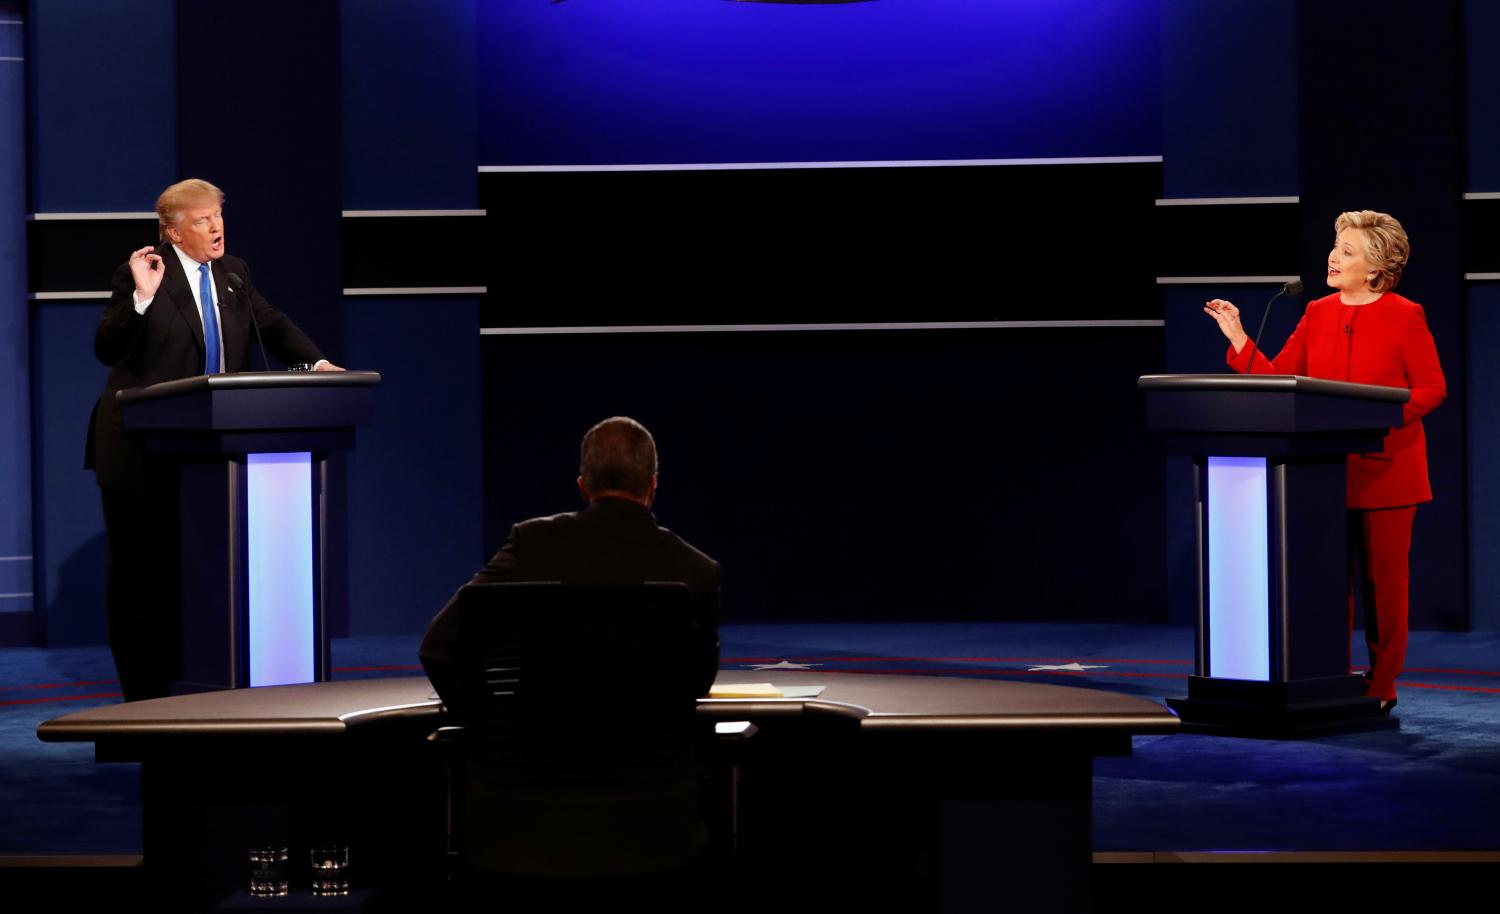
In “What do financial markets think of the 2016 election,” (PDF) the University of Michigan’s Justin Wolfers and Dartmouth College’s Eric Zitzewitz conduct an event study analyzing the response of financial and prediction markets to the most consequential single event (so far!) during the 2016 general election campaign: the first Presidential debate, which occurred on September 26, 2016. Polls taken immediately after the debate found that voters thought Clinton had won the debate by a clear margin. The debate created an abrupt shift in the dynamics of the race, increasing the chances of a Clinton presidency, and reducing the chance of a Trump presidency.
Figure 1 illustrates the changes in prediction market prices and stock market in the hours around this event. Both markets were relatively tranquil in the period before and after the debate. But during the debate itself, both moved quite sharply. A prediction market security traded on Betfair.com that is worth $1 if Clinton wins the Presidency rose from 63 to 69 cents between 9 and 11 PM Eastern Time (i.e., during the debate and first 20 minutes of post-debate analysis). While the main U.S. financial markets were closed, overnight trading in S&P 500 futures reveal that this event also led financial market traders to sharply revise their assessment of the value of stocks. The December 2016 S&P 500 future rose in lockstep with Ms. Clinton’s election chances, suggesting that markets expect stocks to be more valuable under President Clinton than President Trump.
The magnitudes involved are large. The S&P 500 futures rose by 0.71 percent during the debate window in response to a 6 percent increase in Clinton’s victory probability. This implies that market participants believe that the S&P 500 will be worth 12 percent more under a President Clinton. Movements in other U.S. stock indices tell a similar story. A 12 percent difference is large both in absolute terms, and relative to how previous political shocks have moved the market.
Conducting similar analyses of how other financial markets responded to the change in election odds paints a more complete picture. During the debate futures tracking expected future U.S. stock market volatility fell sharply, suggesting that markets are more uncertain about outcomes under a Trump presidency. Oil prices rose, gold prices fell, and Treasury prices declined slightly. Roughly speaking, these movements suggest that a Clinton presidency is expected to lead to stock market volatility that is 15-30 percent lower, Treasury yields that are 25 basis points higher, and oil that is $4 per barrel more expensive.
Movements in overseas markets suggest that the U.S. election is expected to have significant global implications. The debate led the British FTSE 100 to rise by as much as U.S. stocks did. The same is true of many Asian markets, too. South Korea’s KOSPI increased by about twice as much as the U.S., UK, and other Asian markets in USD terms, implying very large economic effects for firms in this country.
Foreign exchange markets suggest that some of this is driven by trade. The currencies of Mexico and Canada — both of which are partners in NAFTA, which Trump has threatened to end or renegotiate — rose sharply, as did those of other nations with which the U.S. has free trade agreements, including South Korea, Australia, and New Zealand. The Japanese Yen was the only major currency to decline against the dollar during the debate.
All told, these movements suggest that financial markets expect a generally healthier domestic and international economy under a President Clinton than under a President Trump.
The findings also represent a break from history. In past work (Snowberg, Wolfers, and Zitzewitz, 2007a), we have analyzed the response of the U.S. stock market in the days surrounding past Presidential elections. In almost every case back to 1880, equity markets have risen on the news that Republicans win elections and fallen when Democrats win. But our analysis of 2016 shows it to be a strong exception to this rule.
Download the full paper for a more detailed outline of the data and methods and the results for a range of financial indicators.
The authors did not receive financial support from any firm or person for this article or from any firm or person with a financial or political interest in this article. They are currently not an officer, director, or board member of any organization with an interest in this article.
Related Books
Related Content


Authors