

The release of the
2012 American Community Survey
(ACS) census data on poverty and income underscores the effects of a sluggish recovery that has played out unevenly across the nation’s major metropolitan economies and, even amid improving employment numbers, has left millions of Americans behind. Using ACS data on individuals living below the federal poverty level (e.g., $23,492 for a family of four in 2012), our analysis across and within the nation’s 100 largest metropolitan areas finds that:
- For the fifth year in a row since the onset of the Great Recession, the number of poor residents in the nation’s 100 largest metro areas grew between 2011 and 2012, edging upward by 1.1 percent or 320,000 people. Though the smallest year over year change since the recession began, the increase in the metropolitan poor population diverged from the national trend, which remained flat from 2011 to 2012.
- The 2012 poverty rate for major metro areas stalled at 15.1 percent, matching the post-recession high in 2011. Most large metro areas (84) saw their poverty rates stuck at 2011 levels. However, poverty rates continued to climb in nine regions, led by Jackson, Knoxville, Fresno, and Grand Rapids (Table 1). These poverty rate increases occurred even though unemployment rates fell in eight of the nine metro areas on this list. At the same time, poverty rates fell in seven regions, with the biggest decreases in Modesto, McAllen, and Albuquerque.
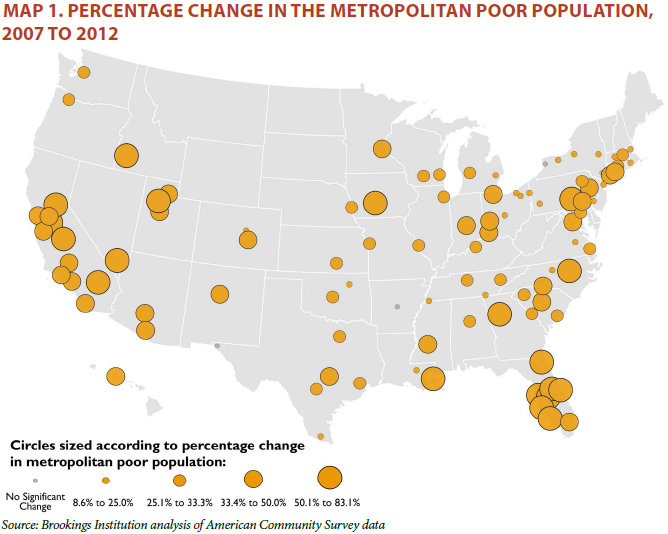
- By 2012, poor populations in 96 of the 100 largest metro areas remained above levels recorded before recession struck. In Sun Belt metro areas on the front lines of the housing market collapse—including Palm Bay, Orlando, Riverside, and Las Vegas—poor populations remained at least 50 percent higher in 2012 than in 2007 (Map 1). Only four regions saw their poor population return to 2007 levels by 2012, including, Buffalo, El Paso, Little Rock, and Poughkeepsie.
- Within the nation’s largest metro areas, suburbs remained home to 55 percent of poor residents in 2012. The poor population in cities ticked up by just over one percent between 2011 and 2012, while the suburban poor population held statistically steady. Both city and suburban poverty rates (21.7 and 12.1, respectively) remained unchanged from 2011, and suburbs continued to house 3 million more poor residents than their primary cities.
- Between 2011 and 2012, some cities began to show signs of recovery, but no major metro area registered significant progress against suburban poverty. City poverty rates fell in seven metro areas, led by Chattanooga, Allentown, Boise, and Rochester, while two metro areas—Cincinnati and San Antonio—registered significant increases in their city poverty rates (Table 2). Similarly, two metro areas—Jackson and Riverside-San Bernardino- Ontario—continued to see their suburban poverty rates grow. However, no major metro area experienced a significant decrease in the suburban poverty rate in 2012.
- Manufacturing-oriented metro areas in the Midwest and Northeast continued to rank highest for urban poverty rates in 2012, while metro areas in the West and South posted the highest suburban poverty rates. Among the metro areas ranked in the top 10 for city poverty rates, at least one-third of urban residents lived in poverty in 2012, and that share reached as high as 39 percent in Youngstown and Detroit-Warren (Table 3). More than half of this list joined the top 10 during the course of the 2000s, as the effects of two downturns and longer-run employment losses in manufacturing pushed poverty rates up. In contrast, Southern and Western regions dominate the list of metro areas with the highest suburban poverty rates in 2012, with McAllen, El Paso, Bakersfield, and Fresno registering between one-quarter and one-third of their suburban residents in poverty (Table 4). Even with the boom and bust of the housing markets in these regions, all but two metro areas that ranked in the top 10 for suburban poverty rates in 2000 remained on that list in 2012.