This report is part of a series by the author on the results of the 2020 census.
The 2020 census results have made clear that America’s “diversity explosion” is continuing, now with an absolute decline in the white population. Yet the country’s racial and ethnic diversity, as shown in national statistics, takes different forms in different places.
The rise of rapidly growing racial and ethnic groups—especially those identifying as Latino or Hispanic, Asian American, and two or more races—are spreading to new parts of the country, leaving fewer areas untouched by diversity. And while Black Americans continue their shift to the South, Black growth is now spilling out to other regions.
This means that white population losses on America’s coasts and much of its northern interior are being countered by the growth of different groups of color as they disperse and change the demographic profiles of nearly all parts of the nation.
America’s emerging demographic kaleidoscope
When it comes to nonwhite racial and ethnic groups, the 2020 census gives us one picture for the nation. That is, Latino or Hispanic residents comprise 18.7% of the population, and the shares for Black and Asian American residents are 12.1% and 6.1%, respectively.1 However, these national numbers change dramatically when looking closer at each of the country’s 3,100-plus counties.
…
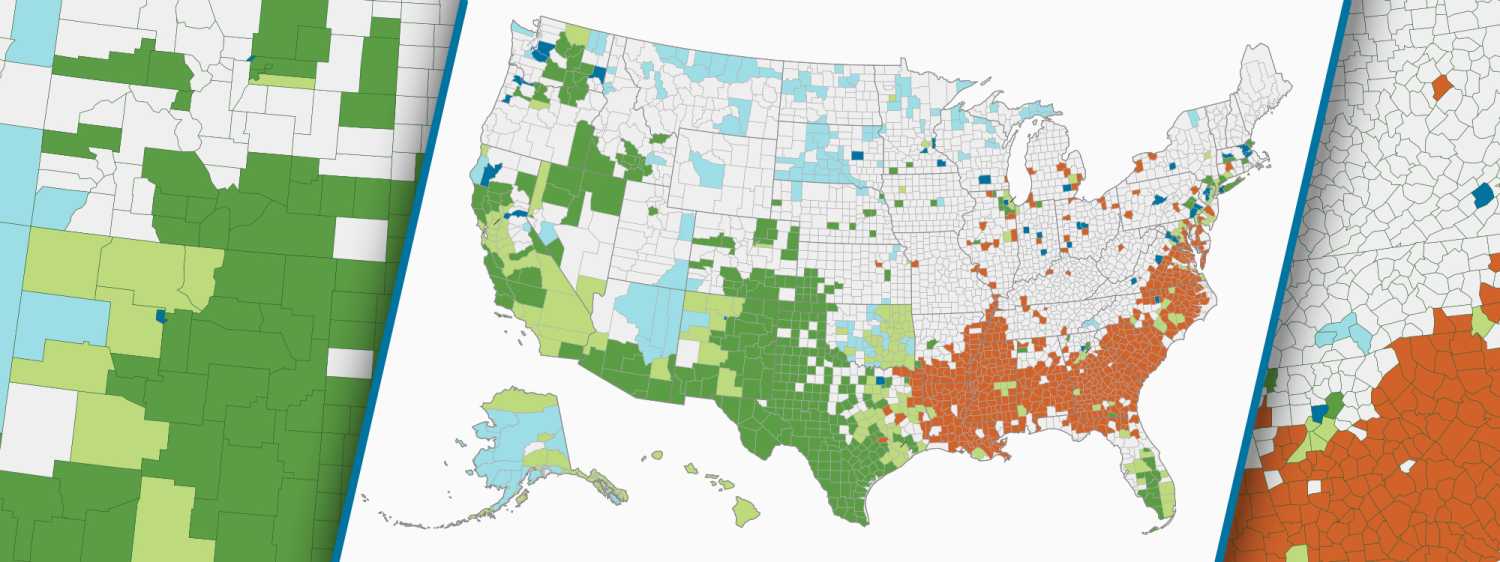
Map 1
Where nonwhite race-ethnic groups are highly represented, 2020 census
US counties Hover over counties to view statistics
…
Source: William H. Frey analysis of 2020 US decennial census
Definitions: A group is highly represented if its share of the area population is larger than its share of the national population for Latino or Hispanic (18.7%); Black (12.1%); Asian American, Native Hawaiian, and Other Pacific Islander (6.1%); and at least 5% for American Indian.
*Non-Latino or Hispanic members of group
**Two or more nonwhite groups are highly represented or more than 10% of residents identify with two or more racial groups or some other nonwhite race
Map 1 depicts counties where each of these groups (as well as American Indians and Alaska natives) are “highly represented”—defined here as comprising a higher share of a county’s total population than for the nation as a whole.2 Also depicted are counties where two or more nonwhite groups or persons who identify with two or more groups are highly represented.3
Especially notable are counties such as Queens County, N.Y.; Cook County, Ill.; Harris County, Texas; Gwinnett County, Ga.; and Solano County, Calif. In these, Latino or Hispanic, Asian American, and Black populations constitute larger percentages of the county population than they do nationally. (The statistics for each county are available interactively by clicking areas on the map.)
Latino or Hispanic residents are highly represented in a broad range of counties from California to Texas, as well as parts of the Mountain West, the Southeast, urbanized parts of the North, and many smaller places in the nation’s interior. Asian American residents, often with other nonwhite groups, are highly represented in California, Washington, Texas, portions of the Southeast, large metropolitan areas, and small towns in all parts of the country.
Related Books
Black Americans are highly represented in southern counties. Fully 58% of the nation’s Black population resides in the South. High concentrations of Black residents are prevalent in many northern urban counties and, together with other nonwhite groups, in parts of the West. The much smaller American Indian and Alaska native population is highly represented, often with other groups, in Oklahoma, Alaska, portions of the Mountain West, and the Upper Great Plains.
Although the map shows notable swaths of “white counties”—where no nonwhite racial or ethnic group is highly represented—many of these are small, less urban, and sparsely populated areas where the white population is stagnating. As a group, these counties—which occupy large sections of the middle of the country—are home to just three out of 10 of all U.S. residents. In contrast, about one-third of U.S. residents live in counties where two or more nonwhite racial and ethnic groups are highly represented, with the remainder living in areas where one group is highly represented.
Diversity is becoming more prevalent everywhere. During the 2010-20 decade, 95% of all U.S. counties registered declines in their white population shares.
The varied diversity profiles of large metropolitan areas
Large metropolitan areas have historically served as destinations for immigrants, Black migration to urban areas, and, more recently, for Latino or Hispanic and Asian Americans. Yet their diversity profiles differ widely across these areas. (See downloadable Table A.)
Map 2
Where nonwhite race-ethnic groups are highly represented, 2020 census
100 largest metropolitan areas Hover over areas to view statistics
…
Source: William H. Frey analysis of 2020 US decennial census
Definitions: A group is highly represented if its share of the area population is larger than its share of the national population for Latino or Hispanic (18.7%); Black (12.1%); Asian American, Native Hawaiian, and Other Pacific Islander (6.1%); and at least 5% for American Indian.
*Non-Latino or Hispanic members of group
**Two or more nonwhite groups are highly represented or more than 10% of residents identify with two or more racial groups or some other nonwhite race
Map 2 makes this clear. Of the nation’s 100 largest metro areas, two or more nonwhite groups are highly represented in 27 of them. Among these are New York and Chicago, as well as Houston and Dallas, where Latino or Hispanic, Asian American, and Black residents are highly represented. Los Angeles, San Francisco, and San Diego are among several large California metro areas where both Latino or Hispanic and Asian American residents are prevalent.
There are 20 other areas where two nonwhite groups are highly represented. Among these are Miami (for Latino or Hispanic and Black populations), Washington, D.C. (for Black and Asian American populations), and Albuquerque, N.M. (for Latino or Hispanic and American Indian populations).
There are quite a few metropolitan areas where one nonwhite racial and ethnic group is most prevalent. These includes 29 metro areas, mostly in the South, with a high representation of Black residents; 13 metro areas, largely in the West and South, with large Latino or Hispanic populations; and four areas—Seattle; Portland, Ore.; Minneapolis-St. Paul; and Boston—where Asian Americans are highly represented.
Only 27 of the nation’s 100 largest metropolitan areas do not contain a highly represented nonwhite group. Located mostly in the country’s interior, Pittsburgh, Cincinnati, and Kansas City, Mo. are the three largest, while Scranton, Pa., Harrisburg, Pa. and Spokane, Wash. are the smallest. As a group, these metro areas are growing more slowly than those with a larger nonwhite ethnic presence, but each one has become less white than was the case in the 2010 census.
New Latino or Hispanic and Asian American destinations
Latino or Hispanic and Asian Americans are the fastest-growing racial and ethnic groups nationally—increasing by 23% and 35.6%, respectively, from 2010 to 2020.4 At the same time, there is a growing dispersion of both groups to new destinations, which tend to lie further afield than the familiar large metro areas.
In 1990, nearly two-fifths all Latino or Hispanic Americans resided in just four metro areas: Los Angeles, New York, Miami, and Chicago. In 2020, a similar share of Latino or Hispanic Americans resided in seven metro areas, with Houston, Riverside, Calif., and Dallas added to the list—each housing more than 2 million Latino or Hispanic residents. This group’s growth has continued to disperse beyond these areas; in the 2010-20 decade, its growth rate was higher in areas with smaller Latino or Hispanic settlements in all parts of the country.
Map 3
Metro areas with largest 2020 Latino or Hispanic populations and highest 2010-20 growth*
…
Source: William H. Frey analysis of 2010 and 2020 U.S. decennial censuses
*For metropolitan areas with Latino or Hispanic populations greater than 10,000
**National Latino or Hispanic growth rate between 2010-20 is 23%
Map 3 depicts metro areas where Latino or Hispanic populations grew fastest over the 2010-20 period, among areas where they comprised more than 10,000 residents. There are 155 metro areas where Latino or Hispanic growth exceeded the group’s nationwide growth by over 150%. Eighty-nine of those grew by over 200%, and 23 grew by over 300%. These areas are spread all over the country, especially in metro areas where Latino or Hispanic populations were gaining new footholds: those in the Midwest, Northeast, and Southeast, including several parts of Florida. Among areas registering greatest Latino or Hispanic growth are three in Pennsylvania: Scranton, Harrisburg, and Pittsburgh.
Although the nation’s Asian American population grew more rapidly than the Latino or Hispanic population, it has a smaller footprint in most metro areas. Asian Americans have large concentrations in a few gateway areas, led by Los Angeles, New York, and San Francisco. However, while these three metro areas combined house 30% of the nation’s Asian Americans residents, more than three-quarters of 2010-20 Asian American population growth took place elsewhere.
Map 4
Metro areas with largest 2020 Asian American populations and highest 2010-20 growth*
…
Source: William H. Frey analysis of 2010 and 2020 U.S. decennial censuses
*For metropolitan areas with non-Hispanic Asian American populations greater than 5,000
**National Asian American growth rate between 2010-20 is 35.6%
Map 4 depicts metropolitan areas with more than 5,000 Asian American residents and where the Asian American population grew more rapidly than for the nation as a whole. Metro areas with rapidly growing Asian American populations are located in interior parts of the country, especially in the Midwest and Northeast. For example, Omaha, Neb. increased its Asian American population from 17,000 in 2010 to 33,000 in 2020. Asian American growth has also expanded in university and high-tech towns such as Raleigh, N.C., Columbus, Ohio, and Madison, Wis. Most of these growth magnets house relatively small Asian American populations, yet there are exceptions: Seattle, Dallas, and Atlanta, each with substantial Asian American populations, grew considerably over the 2010-20 decade.
Black Americans relocate to the South—and elsewhere
The most notable shift for Black Americans in recent decades has been a return to the South—a reversal of the historical Great Migration to traditional northern and West Coast destination areas.
In 1990, New York led all metro areas in Black population size, followed by Chicago, Washington, D.C., Philadelphia, Los Angeles, and Detroit. But by 2020, Atlanta had catapulted to second place in this ranking, while Houston, Dallas, and Miami leapt ahead of Detroit and Los Angeles.
Map 5
Black population growth for metro areas with largest Black* populations, 2020
…
Source: William H. Frey analysis of 2010 and 2020 U.S. decennial censuses
*Non-Hispanic Black populations greater than 150,000
The results of these shifts are depicted in Map 5, which displays the metropolitan areas with the largest Black populations along with levels of 2010-20 growth. Atlanta is one of the top metro areas for Black population growth, along with its southern counterparts San Antonio, Dallas, Houston, Orlando, Fla., and Charlotte, N.C. However, unlike previous decades, these gains are not broadly confined to the South. Western metro areas such as Las Vegas, Phoenix, and Seattle show substantial growth in their Black populations, as does Minneapolis. At the same time, many former destinations for Black migrants—including Chicago, Detroit, Cleveland, St. Louis, New York, Los Angeles, and San Francisco—registered losses in their Black populations.
White population shifts: A zero-sum game
The 2020 census showed a decline in the nation’s white population between 2010 and 2020, a pattern which is projected to continue as a result of more deaths and fewer births for an aging white population.
This means that white population shifts within the U.S. are becoming something of a zero-sum game: When some areas gain white migrants from other parts of the country, the white population in those origin areas often registers losses.
Map 6
White* gains and losses in 100 largest metro areas, 2010-20
…
Source: William H. Frey analysis of 2010 and 2020 U.S. decennial censuses
*Non-Latino or Hispanic whites
Map 6 displays white population gain and loss patterns among the nation’s 100 largest metropolitan areas. Over the 2010-20 period, 61 of these areas sustained white population losses. These include areas with high costs of living, such as New York, Los Angeles, and Chicago, as well less economically vibrant places. Many of the latter are located in the industrial Midwest, but they are also prevalent in interior California, the Southeast, and New England.
Still, all but three of the 61 metro areas that lost white residents during the 2010s registered overall population growth. This is because the combined gains of other nonwhite groups more than made up for white population losses. For example, in metropolitan Los Angeles, the white population loss of 294,000 was countered by a gain of 666,000 residents from other racial and ethnic groups.
Most of the 39 metropolitan areas that gained white population during the 2010-20 decade are located in prosperous areas of the Sun Belt region, especially Texas, the Southeast, and the Mountain West. This reflects similar migration patterns for nonwhite racial groups. Denver, Phoenix, Nashville, Tenn., Raleigh, N.C., and Austin, Texas gained the most white residents in the past decade, with each also gaining substantial racial minority populations as well. (See downloadable Table B.)
The rise and geographic spread of different racial and ethnic groups revealed with the 2020 census indicate that various nonwhite groups already serve as the engines of demographic change in a large part of the United States. And the fact that people of color hold an even bigger presence among our younger generation suggests that racial and ethnic diversity will be much more prevalent across most of the nation in the decades ahead, exerting significant impacts on our politics, society, and economy.
Related Content


Author

-
Footnotes
- Other than Latino or Hispanic, all racial groups discussed here are non-Hispanic members of those races. “Asian American” (in Maps 1 and 2 and Tables A and B) pertains to Asian-related groups including persons identified as Asian, Native Hawaiian, or Other Pacific Islander.
- That is, the county’s Latino or Hispanic, Black, or Asian American population exceeds the national percentage shares discussed above. For American Indian and Alaska native populations—whose national share is 0.7%—high representation is identified for counties in which their share exceeds 5% of the population.
- These include counties where two or more nonwhite racial and ethnic groups are highly represented, or counties where individual persons identifying with two or more racial and ethnic groups and identifying with some other race exceed 10% of the population.
- This growth rate for Asian American residents and those reported in Map 4 pertain to persons identifying as Asian American only, and does not include Native Hawaiians and Other Pacific Islanders.
The Brookings Institution is committed to quality, independence, and impact.
We are supported by a diverse array of funders. In line with our values and policies, each Brookings publication represents the sole views of its author(s).


