Young people in their late teens and early 20s stand at a pivotal point as they transition into adulthood. Although they typically have higher unemployment rates than older workers, the Great Recession and slow recovery have focused attention on the challenges young people face when progressing from adolescence and school into full-time employment enabling self-sufficiency.
The following analysis and related interactive examine employment trends among teens aged 16–19 and young adults aged 20–24, and compares these groups with adults aged 25–54—those typically considered to be in their prime working years. School is likely to be teens’ primary activity until high school graduation, but early work experiences (part-time and in the summer) can provide valuable opportunities for teens to learn new skills, gain experience, expand their networks, and develop positive relationships with adults. Young adults are typically in a different phase and engage in a broader mix of activities. Some continue in school full time, some combine work and school, and others work full time, or would like to do so.
Specifically, the analysis examines the employment and unemployment rates of teens, young adults, and prime-age workers, using microdata data from the American Community Survey for the years 2008–2014. The analysis also examines a key subpopulation among teens and young adult population: “disconnected youth” who are neither working nor in school. These young people are missing key educational and employment experiences and are at increased risk for a host of negative outcomes: long spells of unemployment, poverty, criminal behavior, substance abuse, and incarceration.[1] Data on disconnected youth also comes from American Community Survey microdata, but to compensate for small sample sizes, the analysis uses a three-year estimate encompassing the years 2012–2014.
The research examines these three measures —at the national level and in the nation’s 100 largest metropolitan areas. It updates previous work on labor market indicators among teens aged 16–19 and young adults aged 20–24.
Findings include:
- Whites typically have the highest employment rates and lowest unemployment rates among all ages. However, among prime-age workers, Asians have the lowest unemployment rates.
- Blacks consistently have lower employment rates and higher unemployment rates than other groups. Unlike Asians, their low employment and high unemployment rates do not improve with age. Asians’ low employment rates as young people are driven by high rates of school enrollment, and their subsequent high levels of educational attainment serve them well in the labor market as adults.
- Disparities by educational attainment are larger than disparities by race. People without post-secondary credentials do much worse in the labor market than those with higher levels of education.
- Employment and unemployment rates vary substantially by place; many of the best-performing metro areas are in the Midwest, West, or regions with highly educated residents, including state capitals and university towns.
- Nationally, an estimated 3 million young people aged 16–24 (7.6 percent) are disconnected. The majority of these young people are between 20 and 24 years old, suggesting that the problem becomes more acute after young people are of an age to have graduated high school. They are disproportionately people of color. Rates of disconnection vary widely by metropolitan area, and in some places, young blacks and Latinos are up to 3-to-6 times more likely to be disconnected than young whites.
Employment rates fell most dramatically among teens, and large disparities between whites and blacks persist, particularly among teens and young adults.
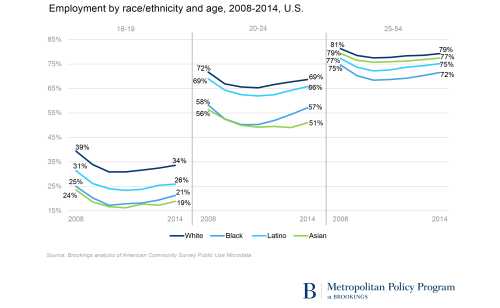
Employment rates are typically lowest among teens and steadily increase with age as people seek to find full-time work, usually after completing their education (whether or not they earned a credential). Employment rates among all age groups fell between 2008–2014, typically bottoming out in 2010 or 2011 and then increasing, although not back to pre-recession levels.
The decline was most dramatic among teens aged 16–19: Employment rates fell from 35 percent in 2008 to 29 percent in 2014. While most teens do not need to work to support themselves or their families, the decline raises concern in some quarters that teens are missing out on opportunities to learn new skills and gain experience and contacts that will improve their job prospects later in life.[2] Both young adults aged 20–24 and prime-age workers aged 25–54 registered employment rate declines of three percentage points, landing in 2014 at 65 percent and 77 percent, respectively.
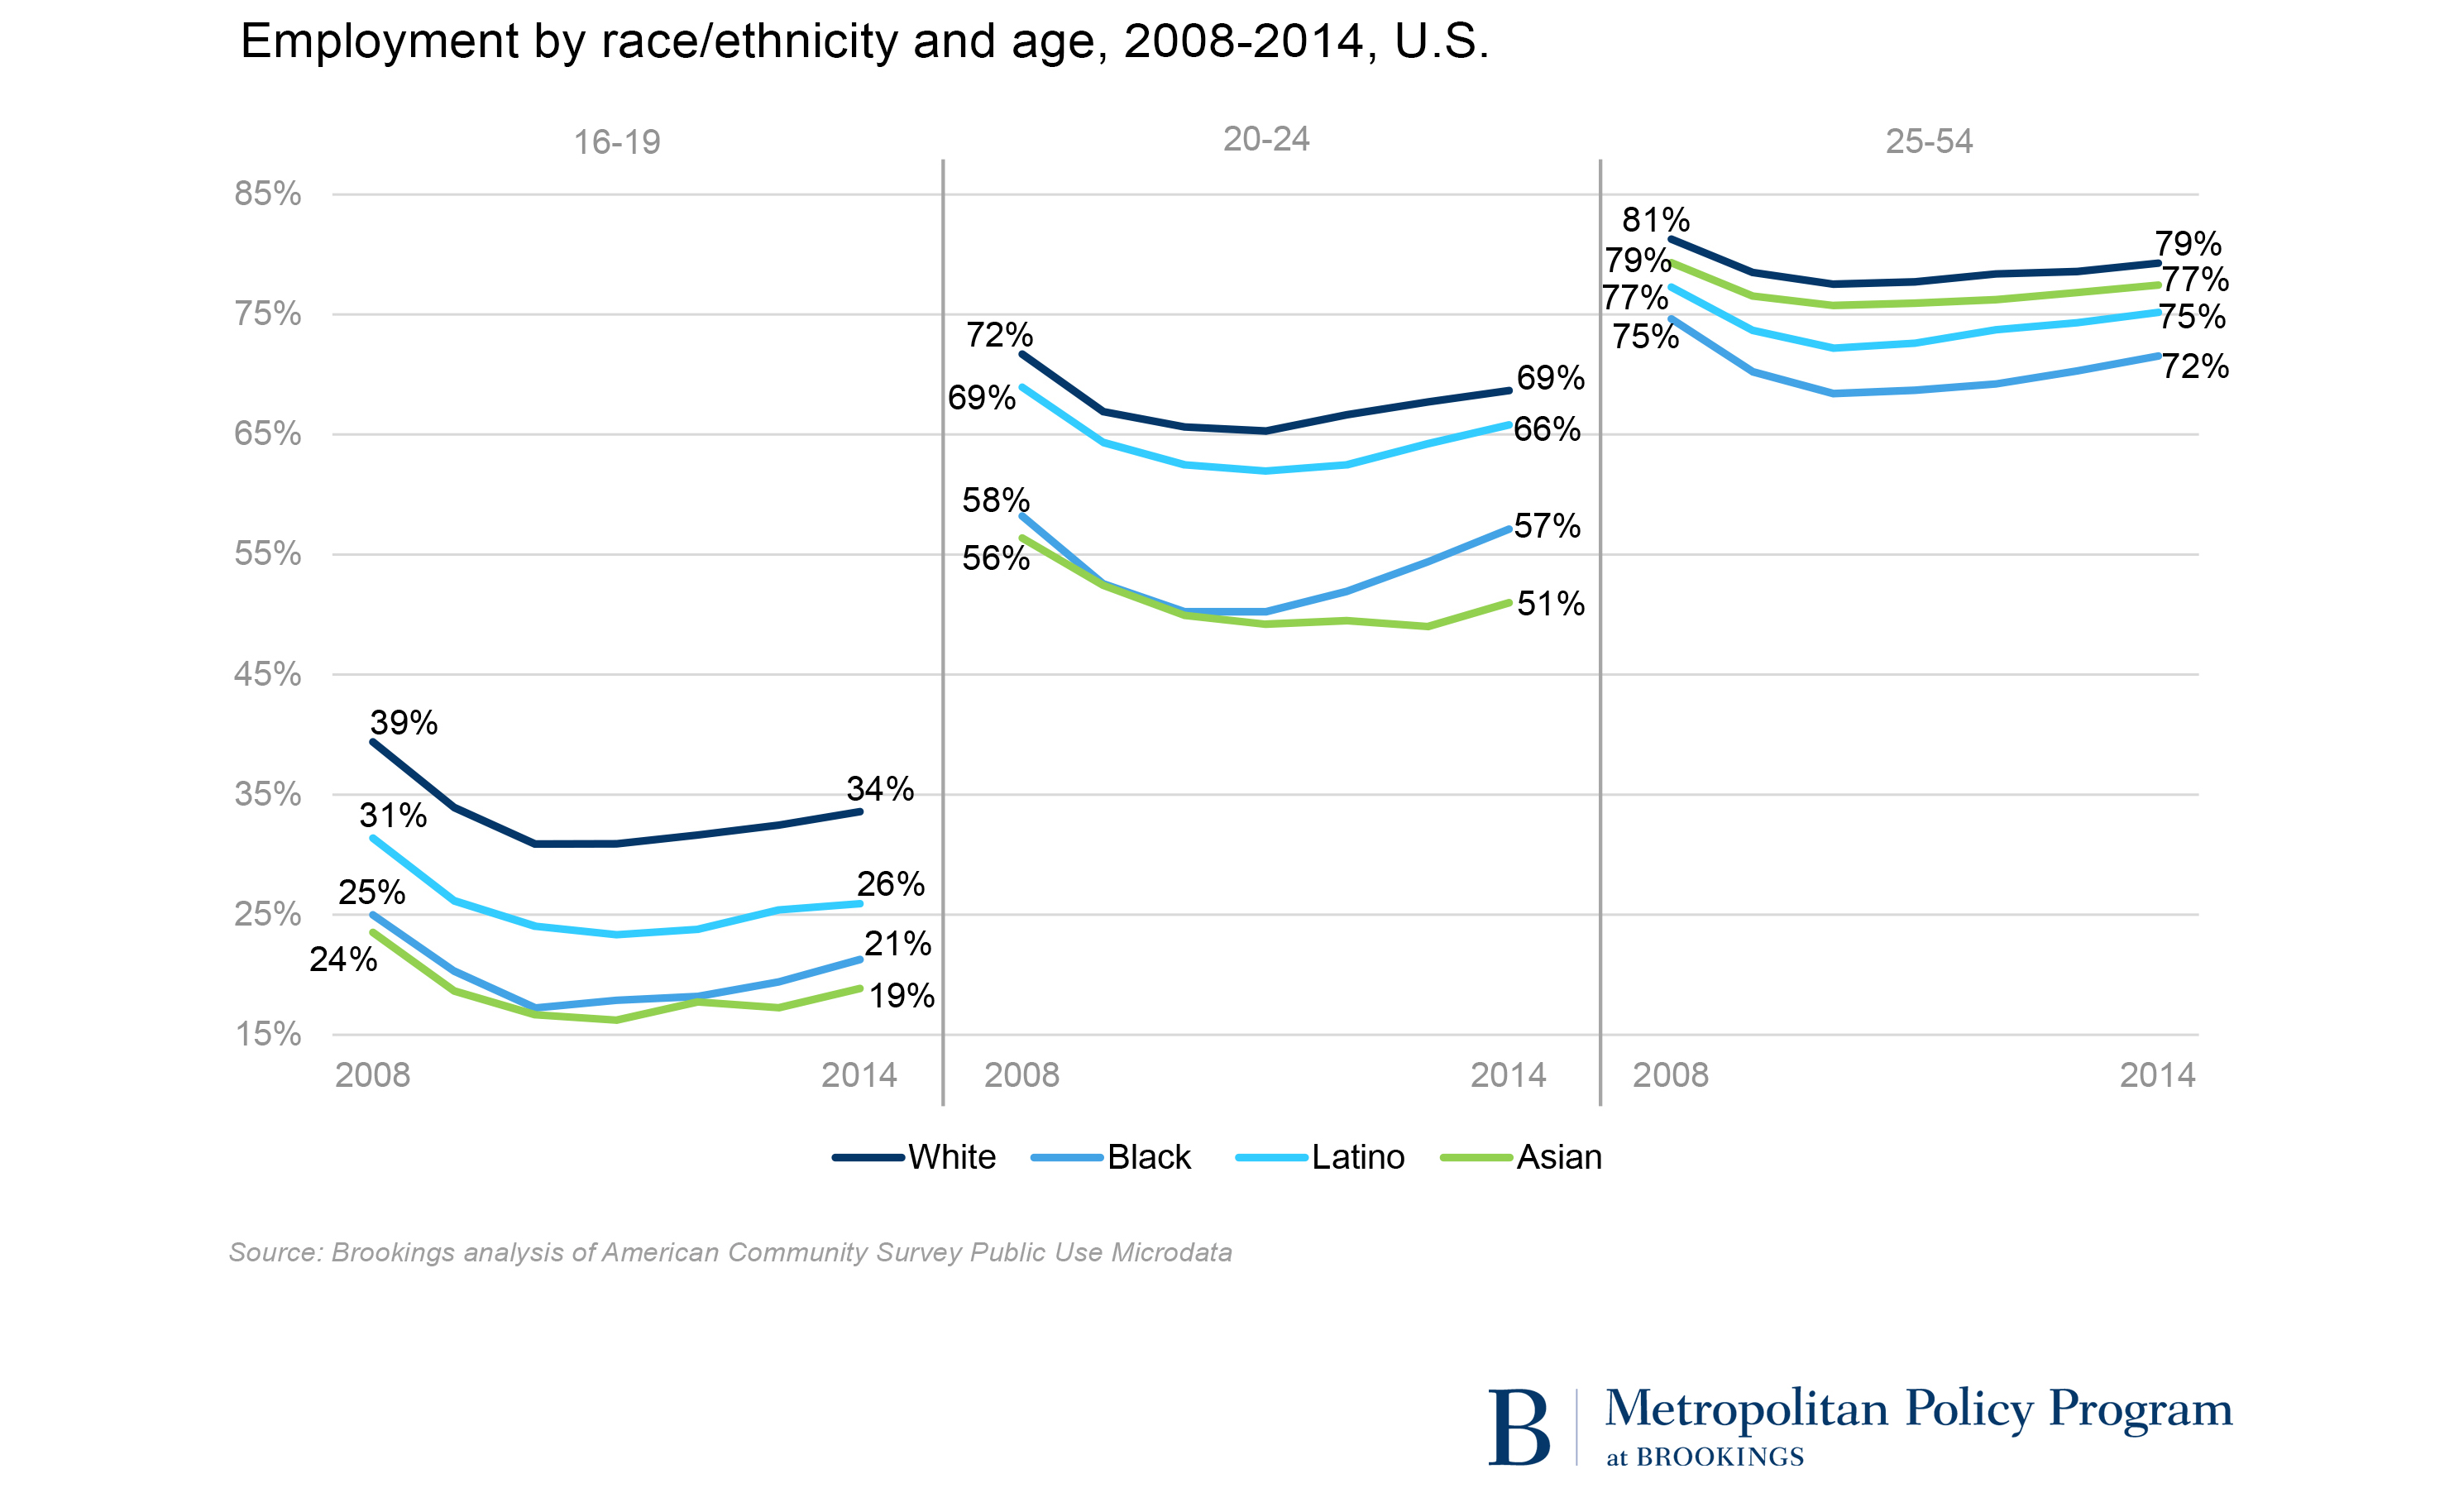
Among all three age groups, whites consistently had the highest employment rates, followed by Asians among prime-age adults and Latinos among teens and young adults. Among teens and young adults, blacks and Asians had similar rates at the low end, although more blacks started working post-recession than Asians did. The white teen employment rate in 2014 was 34 percent, compared to 26 percent among Latinos, 21 percent among blacks, and 19 percent among Asians. White young adults had an employment rate of 69 percent in 2014, compared to 66 percent among Latinos, 57 percent among blacks, and 51 percent among Asians. The gap by race/ethnicity narrows when adults are in their prime working years of 25–54, although the black-white gap remains a still-sizable seven to nine percentage points over the 2008–2014 time period. In 2014, the employment rate of white prime age workers was 79 percent, compared to 77 percent among Asians, 75 percent among Latinos, and 72 percent among blacks. The low employment rates among Asian teens and young adults is related to their high levels of school enrollment. While those enrolled in school can and do work, they do so at a lower rate than those who are not in school (with the exception of those with the lowest levels of education—less than a high school diploma). 92 percent of Asian teens and 63 percent of Asian young adults are enrolled in school, compared to 81 percent of all teens and 38 percent among all young adults. Among adults 25 and over, 54 percent of Asians have a bachelor’s degree, compared to 33 percent among all adults. As shown in the next section, those with bachelor’s degrees fare much better in the labor market than other groups.
Employment rates differ more by education than they do by race.
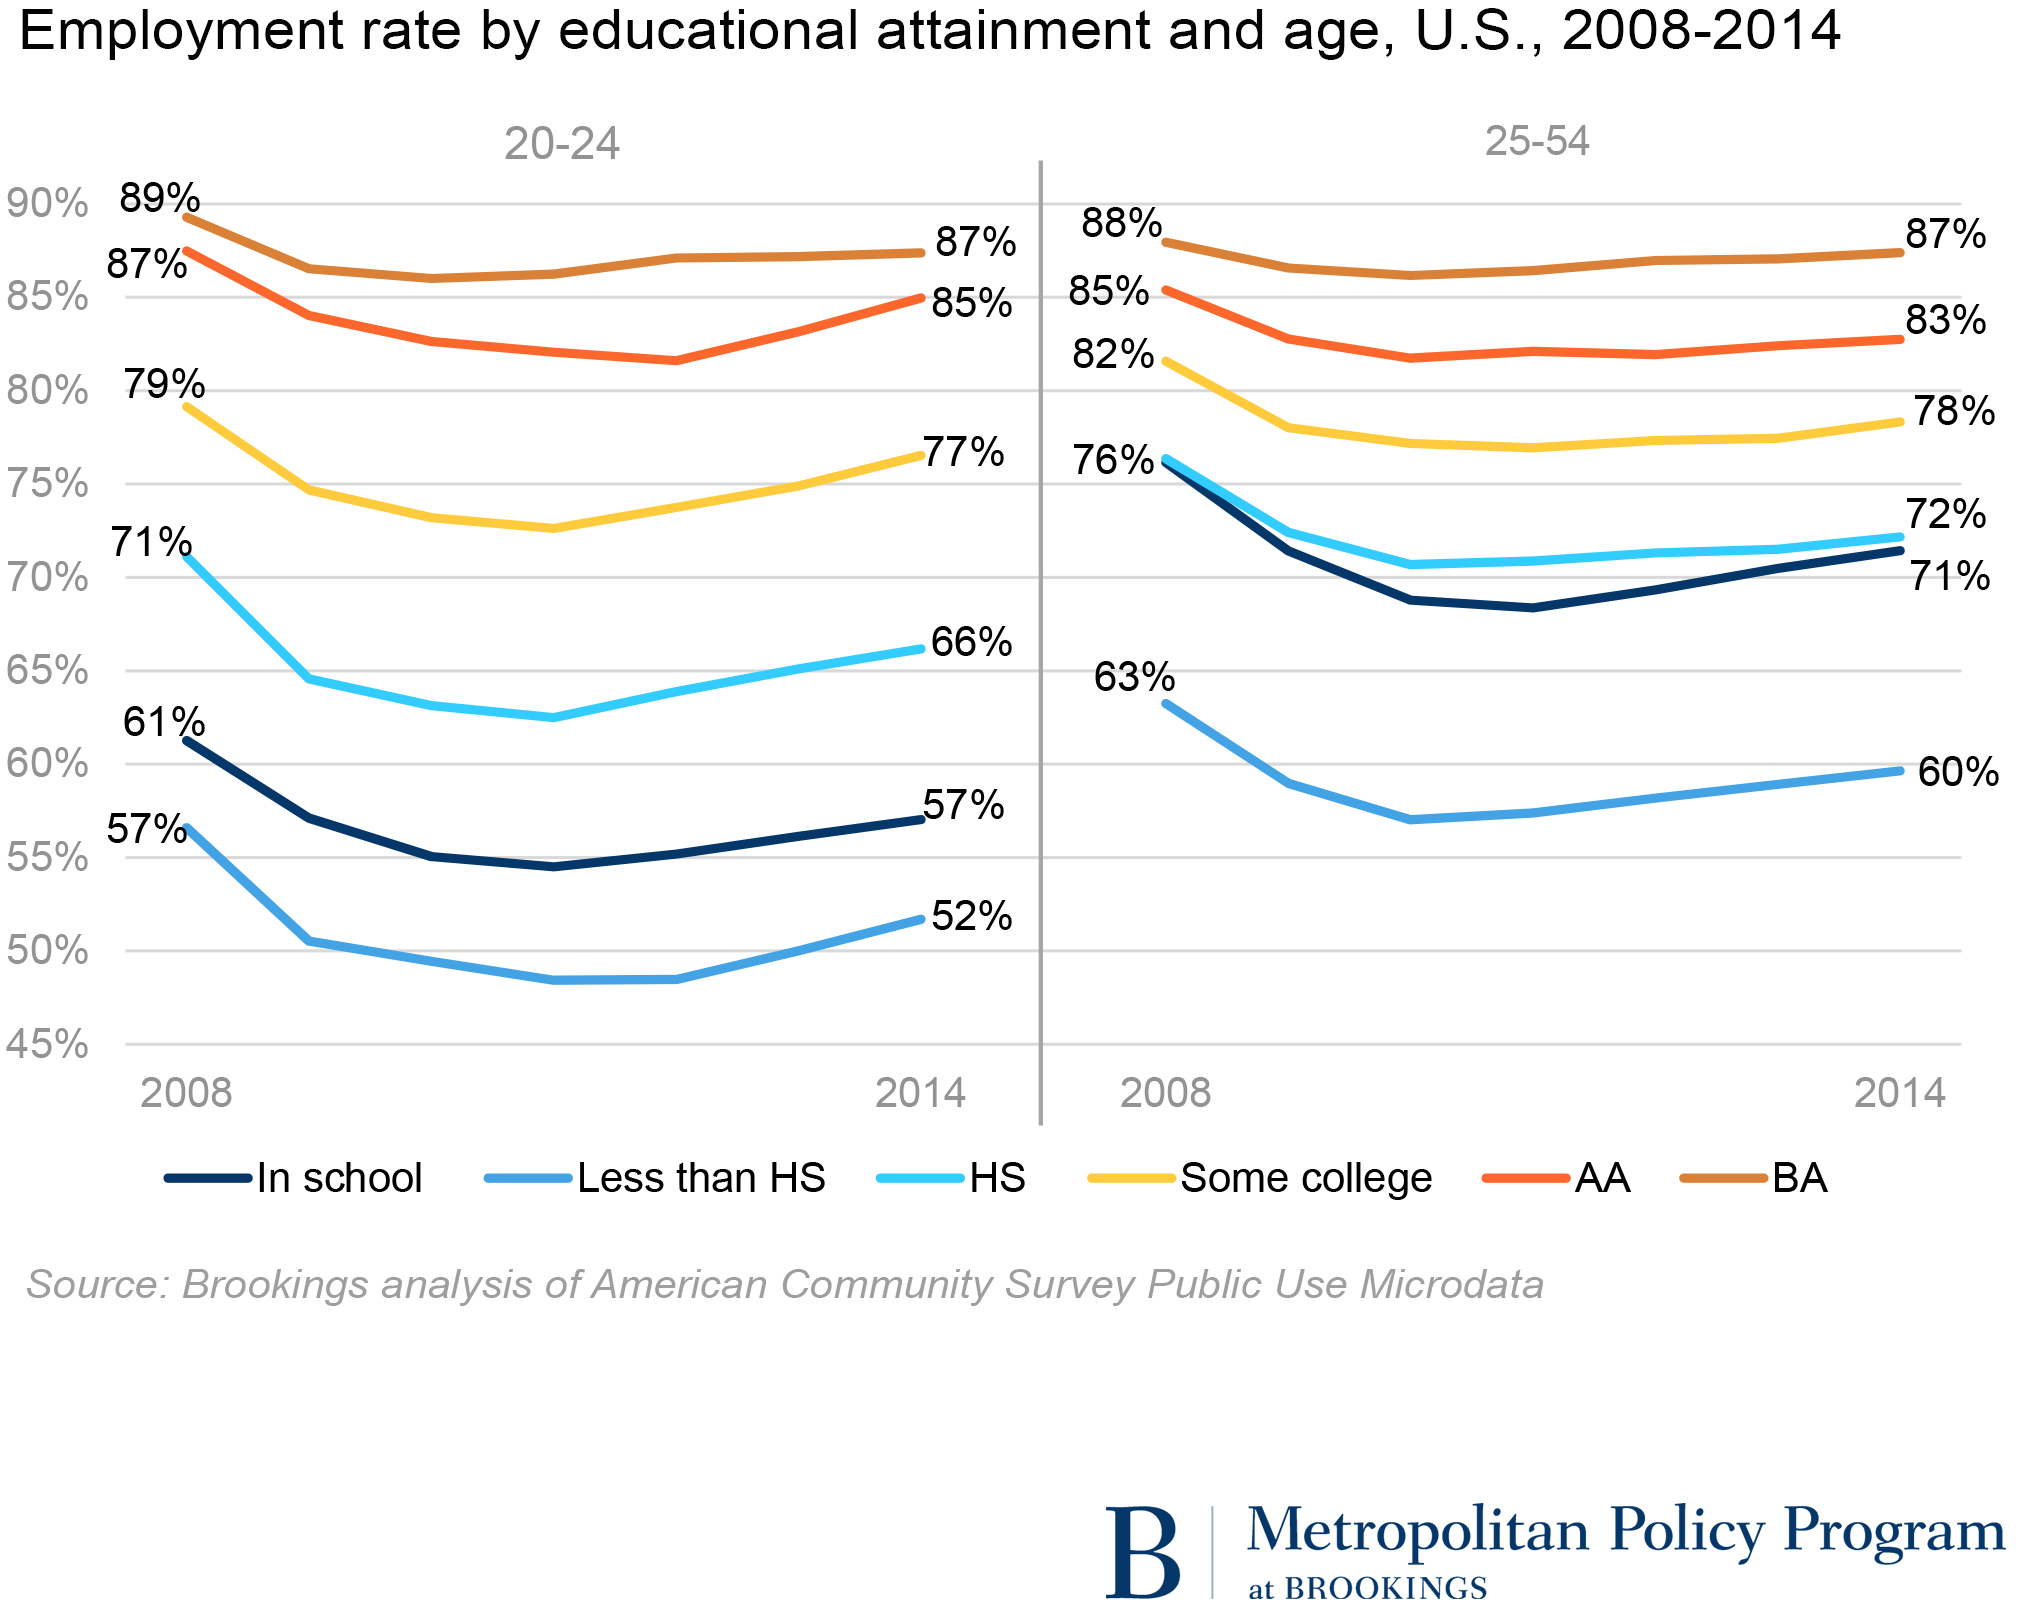
The spread in employment rates by education among young adults and prime-age workers is wider than the spread by race/ethnicity. In 2014, the employment rate among young adults with a bachelor’s degree was 87 percent, a full 35 percentage points higher than the rate among those less than a high school diploma (52 percent) and 21 percentage points higher than among those with a high school diploma and no further education (66 percent). The gaps are a bit smaller among prime-age workers, which may reflect that the experience of older workers compensates for lower levels of education, and/or that young people entering the labor market today with lower levels of education have a harder time finding a job than similarly educated young people did in the past. Among prime age workers in 2014, the employment rate of those with a bachelor’s degree was 87 percent, compared to 60 percent among those with less than a high school diploma and 72 percent among those with a high school diploma and no further education.
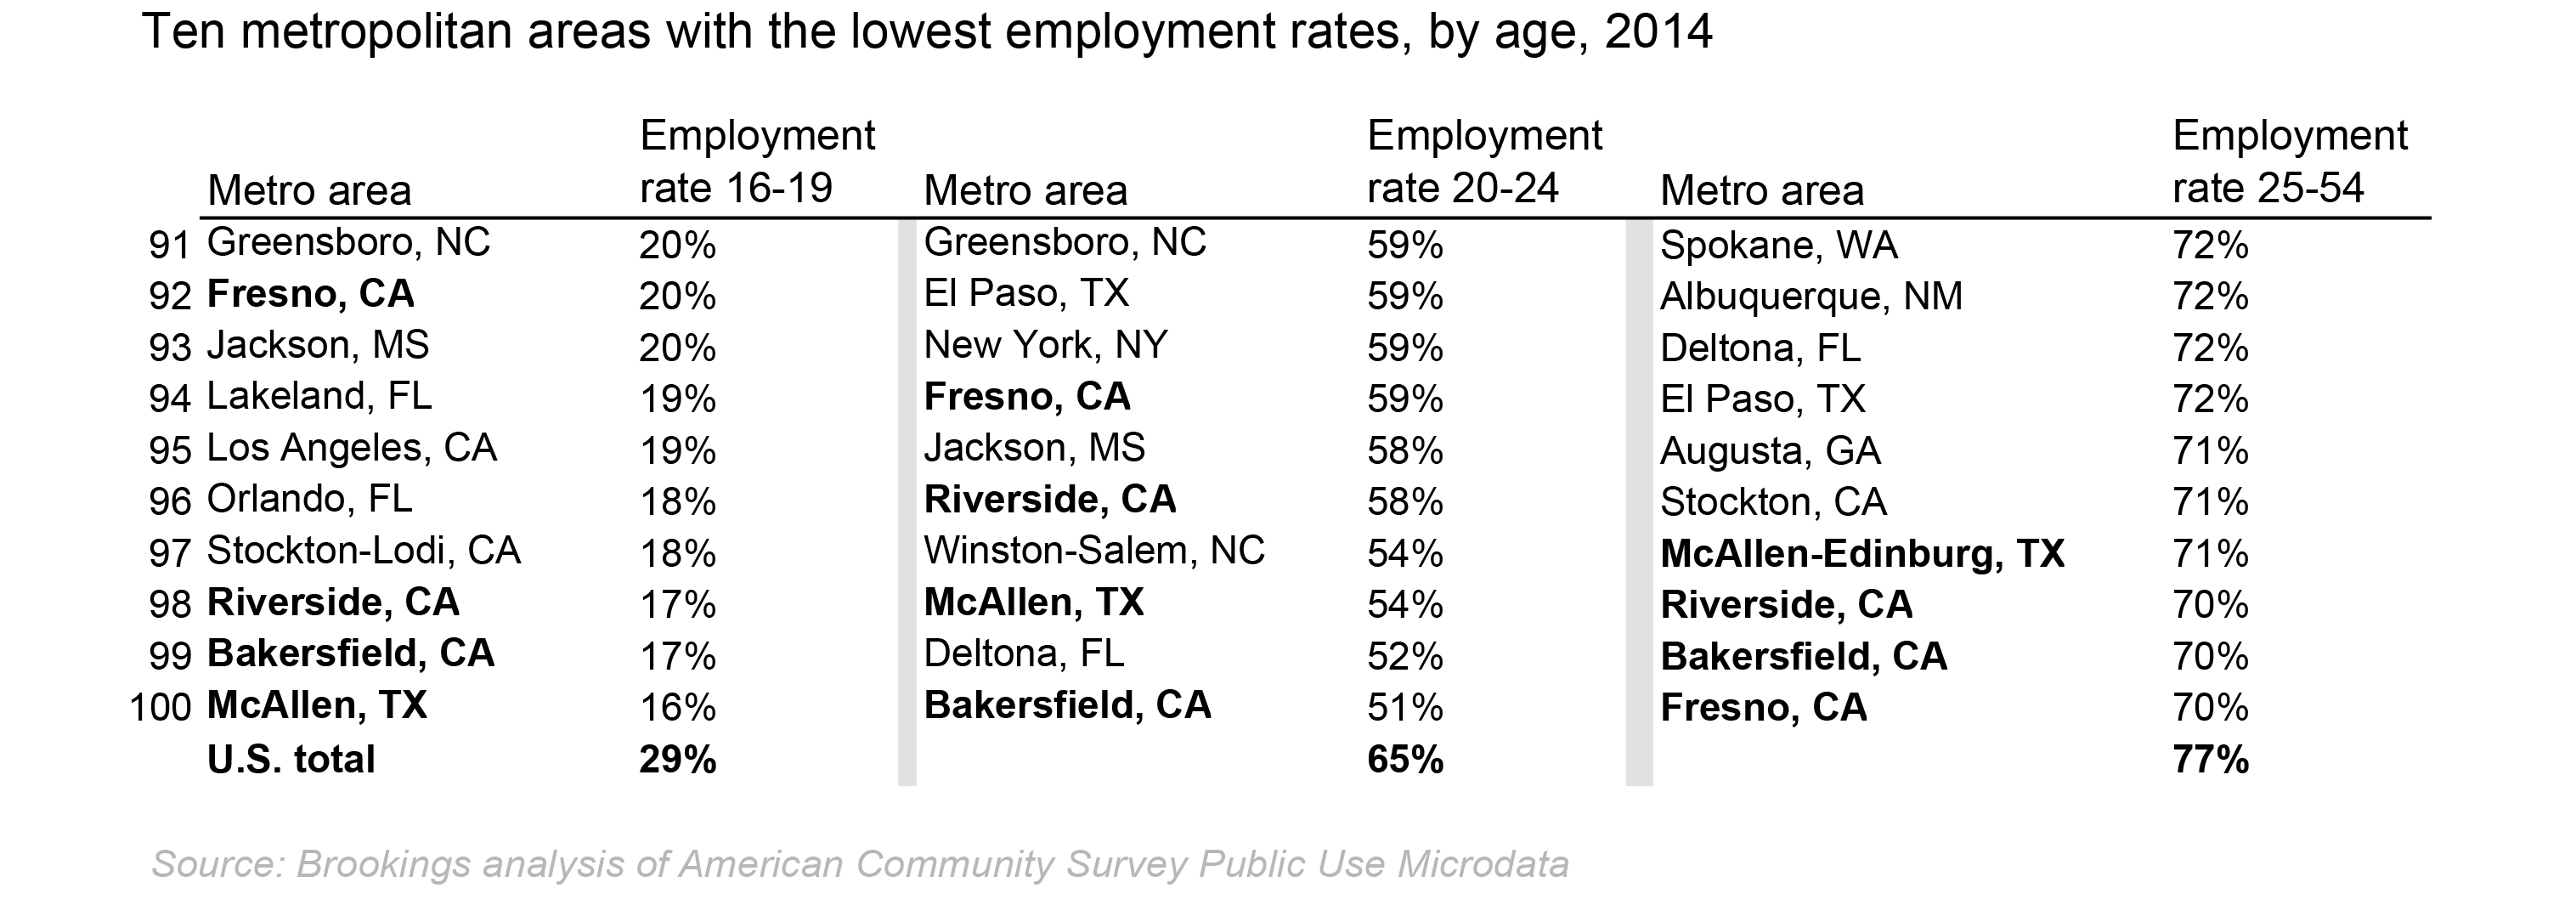
Employment rates by metropolitan area show substantial variation, especially among teens.
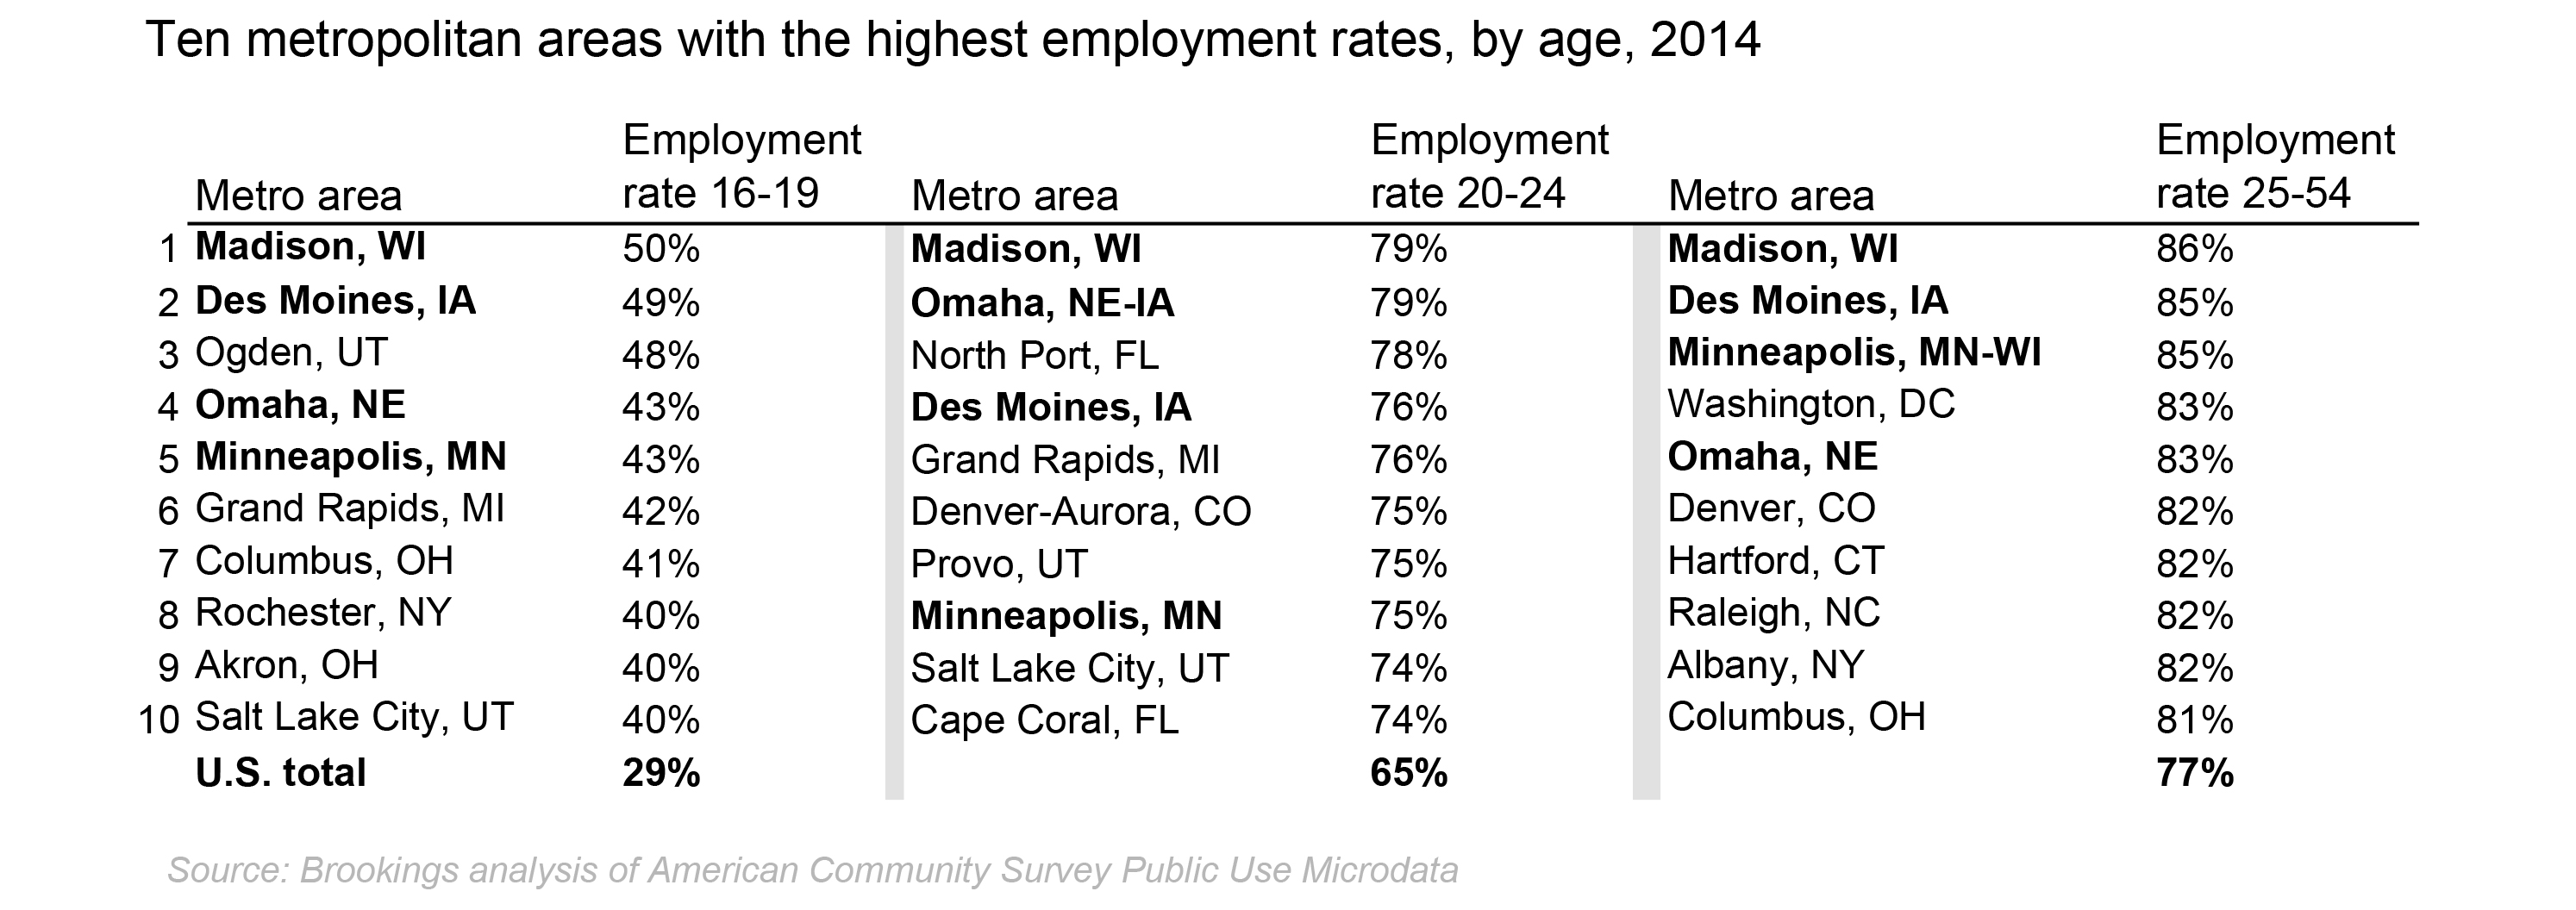
Employment rates among teens by region vary considerably from the national average of 29 percent. At the high end, the metro areas of Madison, Wisc.; Des Moines, Iowa; and Ogden, Utah, have employment rates of about 50 percent, compared to a low of 16-17 percent in McAllen, Tex., and the California regions of Bakersfield and Riverside. Among young adults, employment rates range from 79 percent in Madison, Wisc., and Omaha, Neb., to about 50 percent in Bakersfield, CA and Deltona, FL. Some of the metro areas with the highest employment rates among prime-age adults did not have particularly high rates among teens and young adults, including Washington, D.C.; Hartford, Conn.; Raleigh, N.C.; Albany, N.Y.; and Austin, Tex. These places all have relatively highly educated populations, and the disproportionately high employment rate among adults aged 25–54 relative to younger workers probably reflects that these metros import workers from other places.
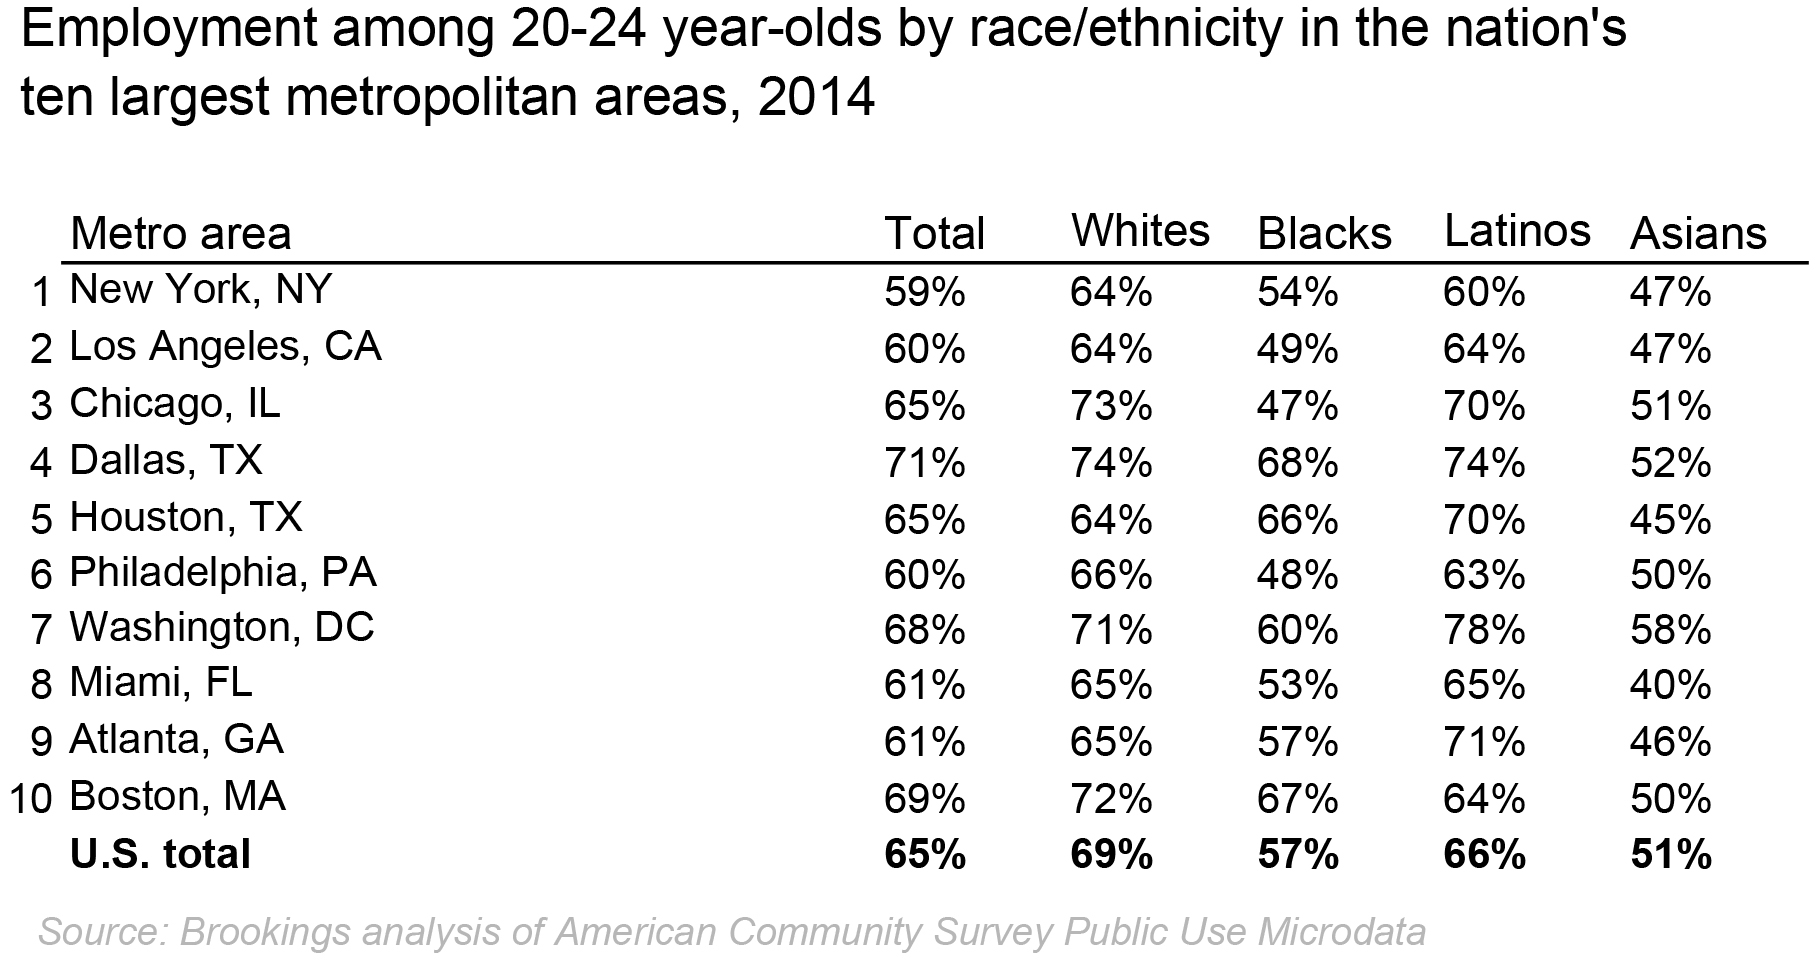
In the largest metropolitan areas, employment by race echoes and sometimes amplifies national patterns.
Among the 10 largest metro areas (those with populations large enough to support detailed demographic analysis of relatively small subgroups), whites typically have employment rates above the regional average across age groups, while blacks generally have lower than average employment rates across the age groups. Asians have lower-than-average employment rates among teens and young adults, but as prime-age workers, their rates equal or exceed regional averages in most of the ten largest metros. Latinos show a more varied pattern. Latino teens have employment rates that are sometimes higher and sometimes lower than the regional average, while in most of the ten largest places (excepting Boston) their rates as young adults exceed the regional average. Among prime-age workers, Latino employment rates meet or exceed regional averages in Miami, Atlanta, and Washington, D.C.; elsewhere their rates are below average.
The extent to which black employment rates lag regional averages or other groups varies. Among the 10 largest metro areas black employment rates across all ages are the lowest in Chicago, where the teen rate is 12 percent, the young adult rate is 47 percent, and the prime-age worker rate is 66 percent. By comparison, the employment rate is 25 percent for all teens in the Chicago region, 65 percent for all young adults, and 78 percent for all prime-age adults. Philadelphia and Los Angeles also have employment rates for blacks that are considerably below regional averages across age groups.
Whites have the lowest unemployment rates among teens and young adults, while Asians have the lowest rates among prime-age adults.
Like employment rates, unemployment rates vary considerably by age. Rates are highest among teens and decline as people become more competitive job candidates with increased education, skills, and experience. Unemployment among teens is consistently about twice that of young adults and three to four times that of prime-age workers.
Unemployment rates increased among all age groups between 2008 and 2014, with dramatic spikes starting in 2009 and then falling after the recession, but still remaining above pre-recession levels. In 2014, unemployment was 22.5 percent for teens, 12.7 percent for young adults, and 6.2 percent for prime-age workers.
As with employment rates, unemployment rates vary by race/ethnicity and education. Blacks have the highest rates in each age group by considerable margins. Whites have the lowest rates among teens and young adults, and Asians have the lowest rates among prime-age workers—about one percentage point or less below whites. The racial gap narrows with age, as the spread between the highest and lowest rates falls to about seven percentage points among prime-age workers, down from 12 percentage points among young adults and 20 percentage points among teens.
Unemployment rates are very high among those with low levels of education. Young adults with only a high school diploma had an unemployment rate of 17 percent in 2014, about two-and-one-half times higher than the rates of those with an associate degree (6.9 percent) and a bachelor’s degree (6.4 percent). Among prime-age workers, the unemployment rate of those with a high school diploma was 8.4 percent in 2014, almost three times higher than the rate for those with a bachelor’s degree (3.0 percent) and almost twice as high as the rate for those with an associate degree (4.9 percent).
Metropolitan areas show wide variation in their unemployment rates. Teen unemployment shows the greatest variability, reaching a high of nearly 40 percent in Jackson, Miss. and Riverside, CA compared to 4.2 percent in Madison, Wisc. and the next lowest, 12.8 percent in Ogden, Utah. The range is a bit more compressed among young adults, with a low of 5-6 percent in Boise City, Idaho; Grand Rapids, MI; and Madison, Wisc., compared to highs above 20 percent in Memphis, TN; Bakersfield, CA; and Winston-Salem, NC.
An estimated 3 million young people are disconnected; they are disproportionately people of color, and the majority are aged 20–24.
Nationally, an estimated 3 young people aged 16–24 are disconnected, or 7.6 percent of all young people. We define disconnected youth as young people who are not working or in school, with less than an associate degree, living below 200 percent of the poverty line, and not living in group quarters such as dorms or correctional facilities. Most of these young people (74 percent) are between the ages of 20–24, with another 26 percent aged 16–19.
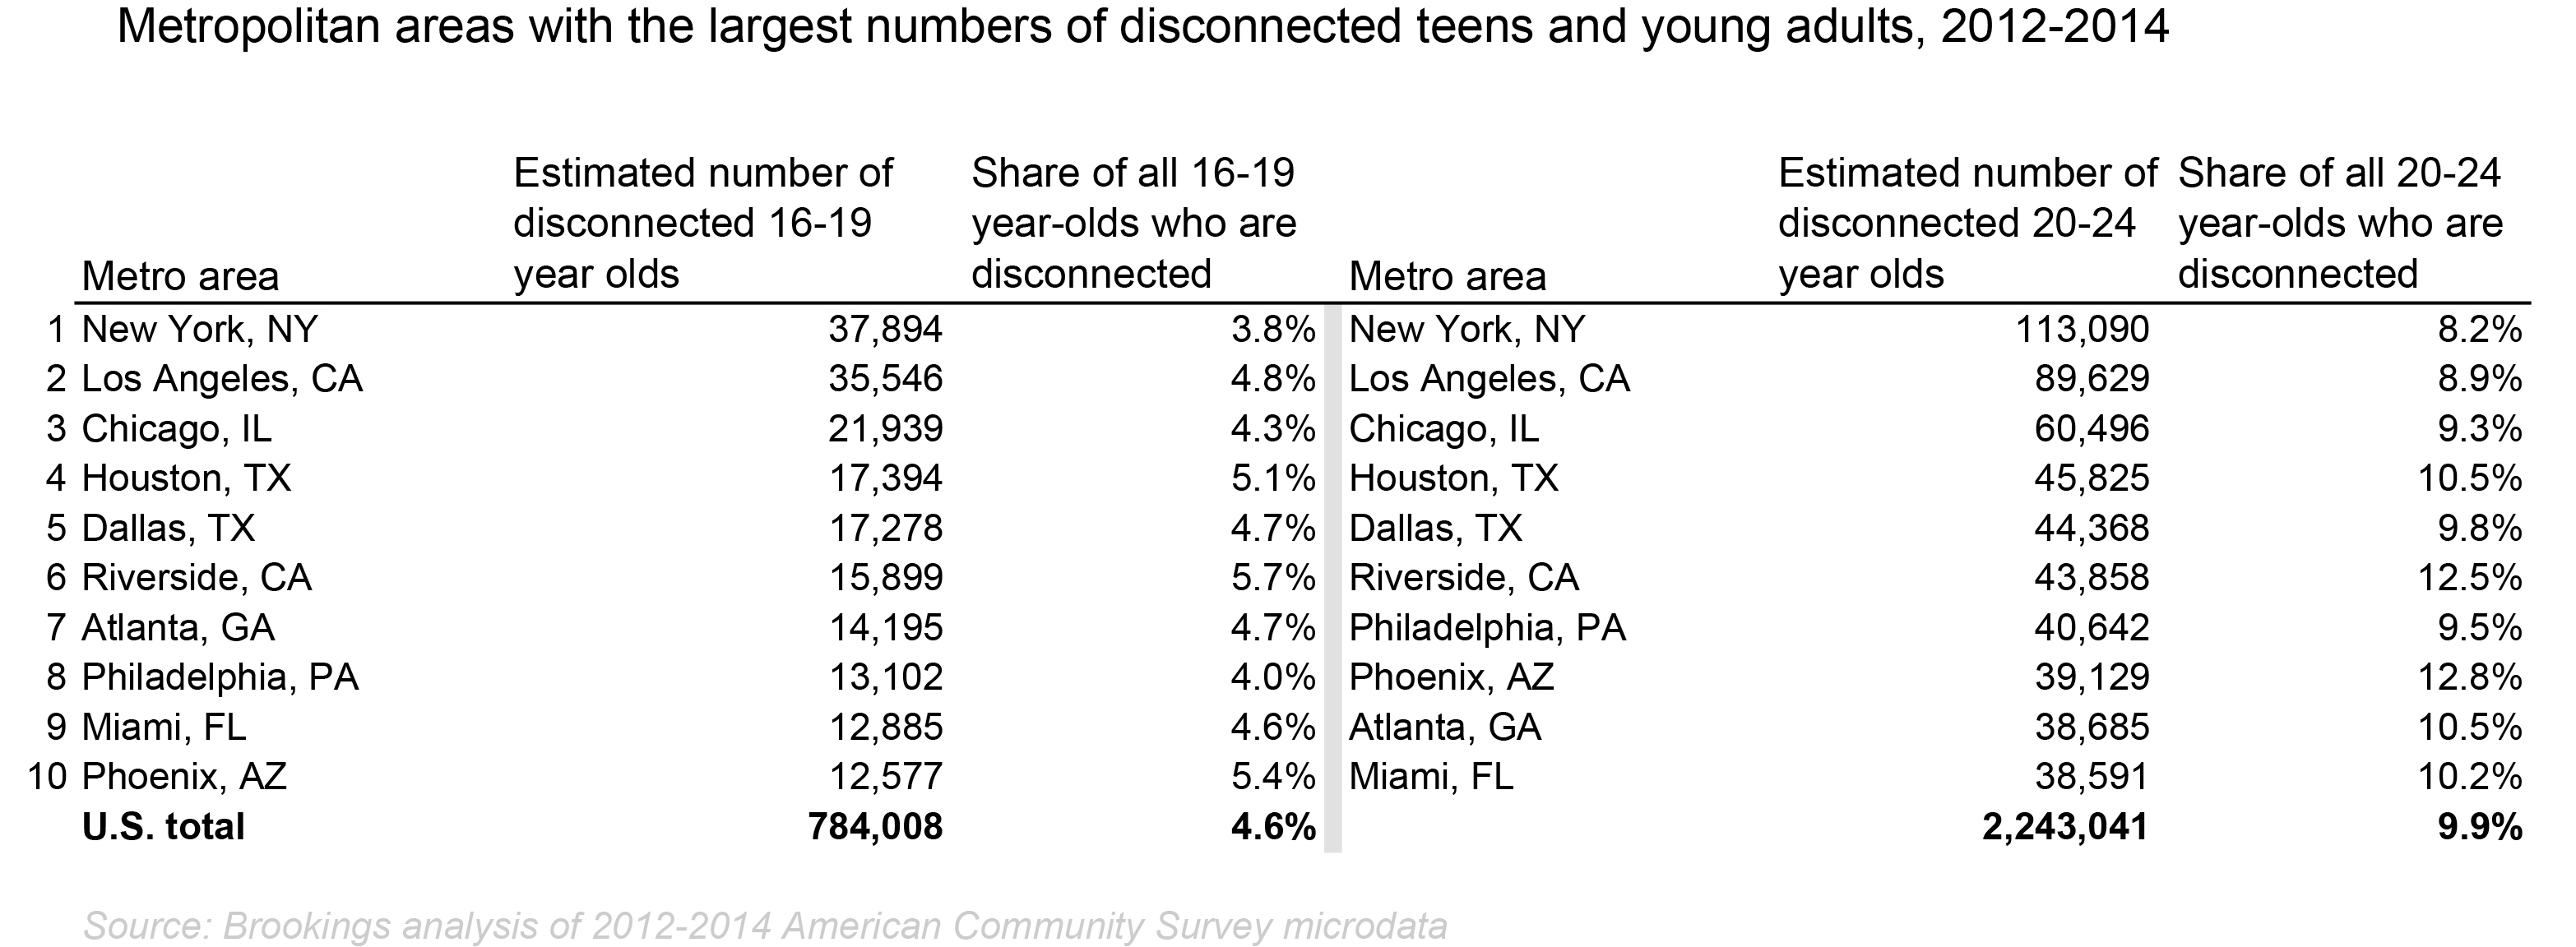
Disconnected teens aged 16–19 number 784,000 and are evenly split among males (51 percent) and females (49 percent). They are racially and ethnically diverse, although people of color form the majority: 24 percent are black, 31 percent are Latino, and 37 percent are white. Those who are foreign born make up a small share of the total (11.2 percent). Half (51 percent) have earned a high school diploma; 7 percent have earned a high school diploma and taken some college courses, and the remaining 42 percent have less than a high school diploma.
Another perspective is to examine which groups of teens are more or less likely to be disconnected. Overall, 4.6 percent of all teens aged 16–19 are disconnected. Several groups have higher-than-average shares of disconnection: 7.6 percent of all black teens are disconnected, as are 6.7 percent of all Latino teens and 6.9 percent of all foreign-born teens. Male and female teens have virtually equal rates of disconnection, at 4.5 percent and 4.6 percent respectively—very close to the total teen average.
Among young adults aged 20–24, a total of 2,243,000 are disconnected, of whom 55 percent are female – higher than the share among teens. The race/ethnicity distribution among young adults is similar to that of teens, although not identical: 25 percent are black, 28 percent are Latino, and 40 percent are white. A slightly higher share than among teens is foreign-born (12.4 percent). Given their age and the longer time period in which they could be enrolled in school, young adults have higher educational attainment than teens: Twenty percent have earned a high school diploma and taken some college courses, 50 percent have a high school diploma, and 30 percent have less than a high school diploma.
Young adults are more likely to be disconnected than teens: 9.9 percent of all those aged 20–24 fall into the disconnected category. As with teens, some groups have higher rates of disconnection than others. Young black adults aged 20–24 have the highest rate at 17 percent. 13.4 percent of Latino young adults are disconnected, as are 11.2 percent of all females, and 11.5 percent of the foreign-born.
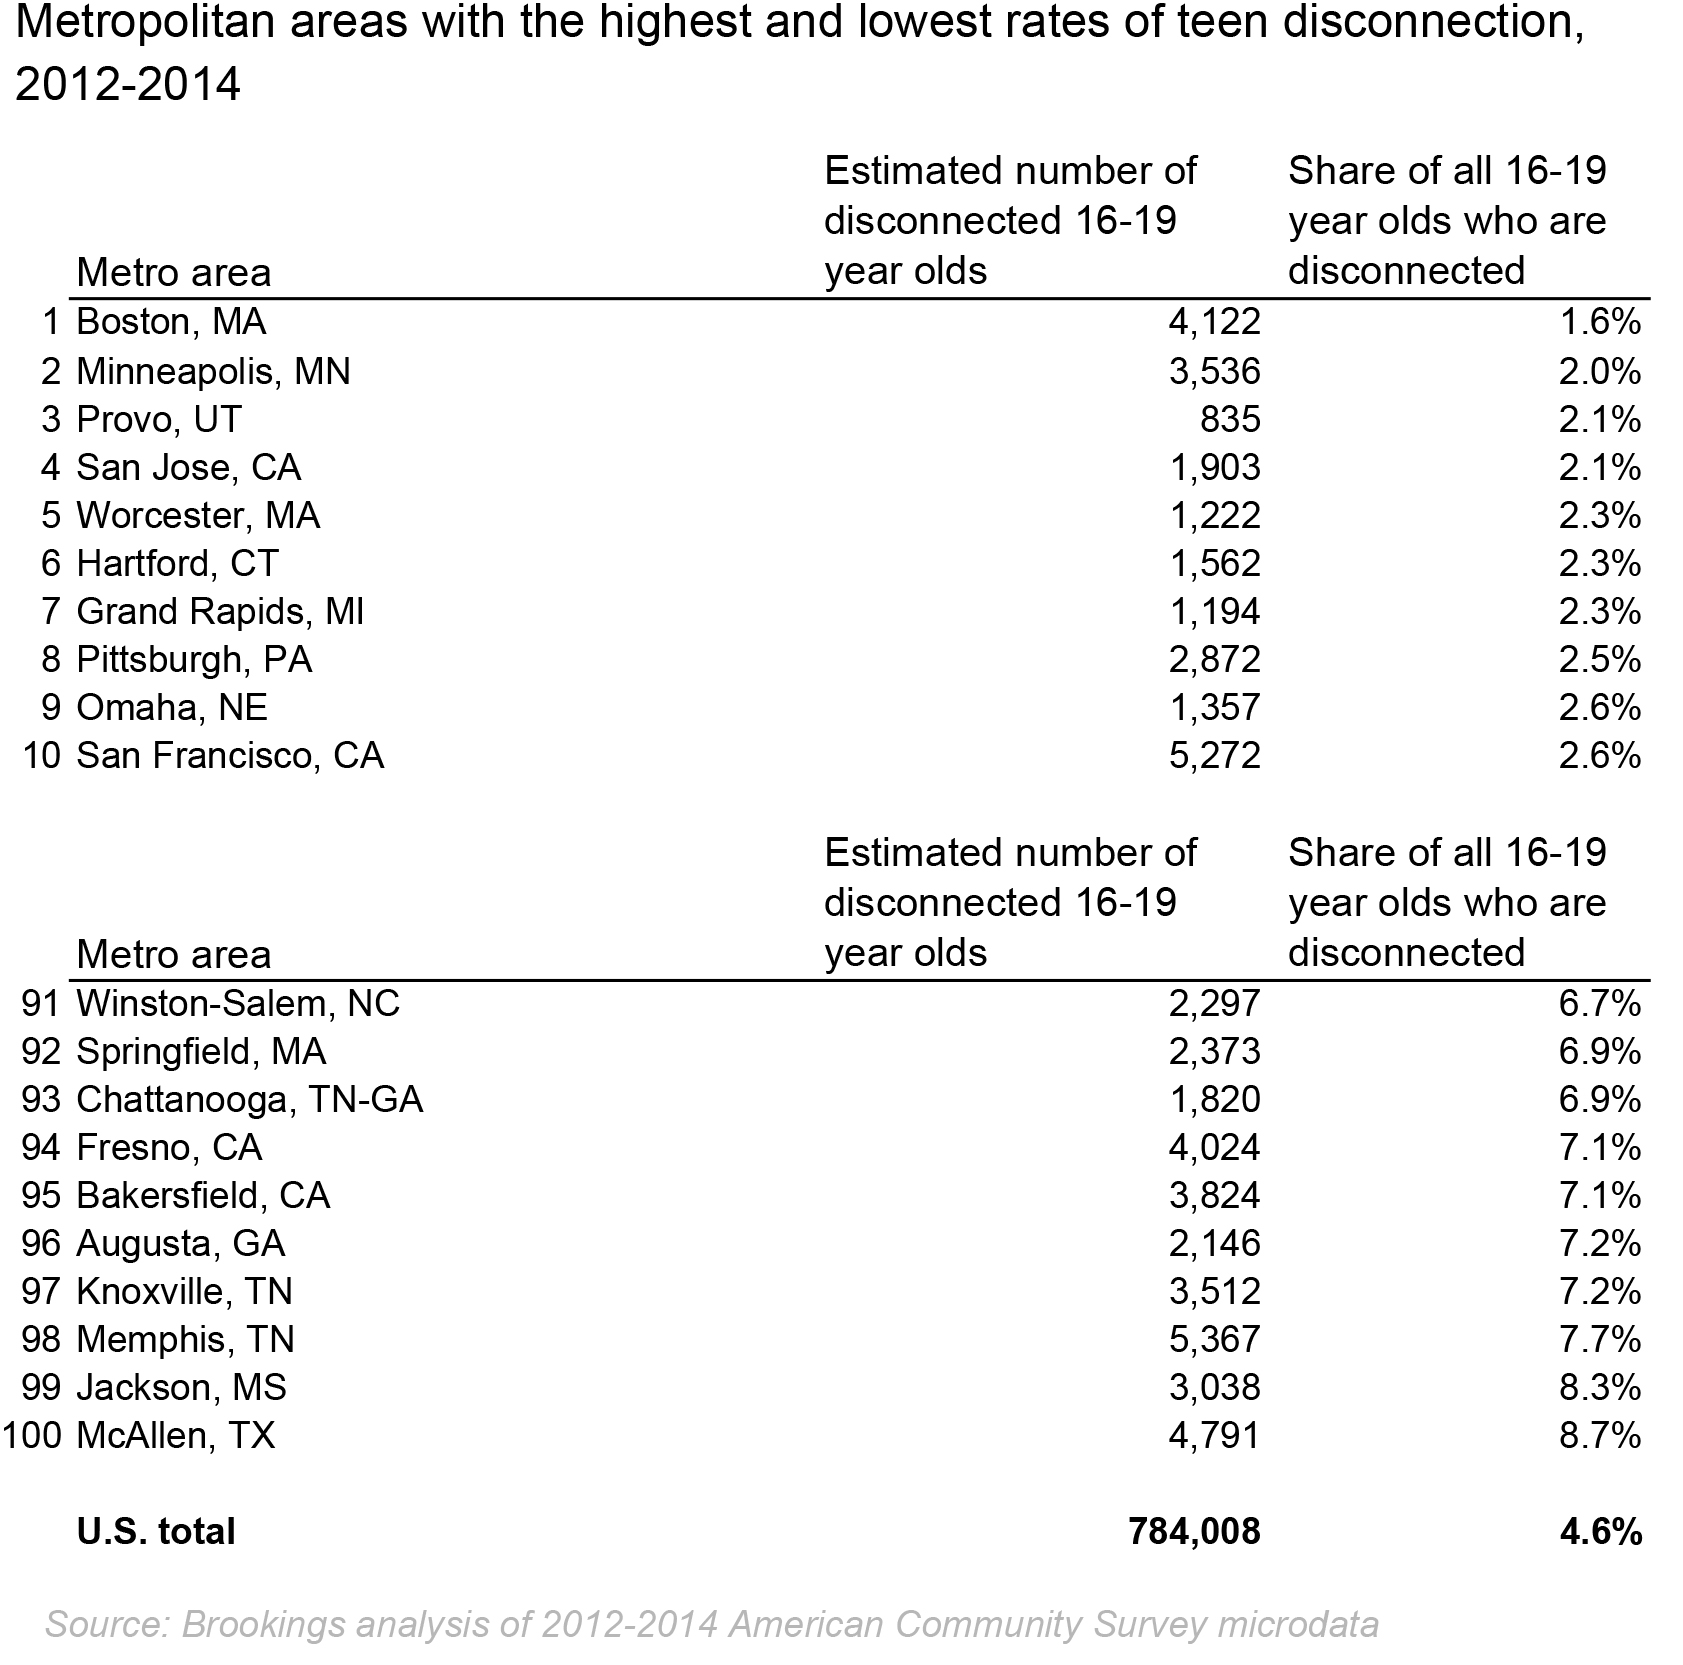
Turning to geographical differences, rates of disconnection vary widely by metropolitan area. Among teens, the disconnected youth rate ranges from a low of about two percent (Boston, MA; Minneapolis-St. Paul, MN; Provo, UT; and San Jos, CA), to about eight percent and up (McAllen, TX; Jackson, MS; and Memphis, TN). (In one metropolitan area—Madison, WI—the sample size is too small to report on with confidence.) The twenty metros with the highest rates of teen disconnection (all at or above 6 percent ) are generally among the least populous of the top 100 largest metropolitan areas and concentrate in the South, the Southwest, and California, with the exception of Springfield, MA. Metros with the lowest teen disconnection rates, however, come in all sizes, encompassing large, medium, and small places. They tend to be on the coasts and in the Midwest, with the exception of Provo, UT.
Among young adults, the metros with the highest disconnection rates are also concentrated in the South, the Southwest, and California, with the exception of Detroit. These metros also are on the smaller side, again with the exception of Detroit. Metros with the lowest disconnection rates among young adults tend to be on the coasts, in the Midwest, and in Utah, with the exception of Austin, TX. As with teens, metros with low rates of young adult disconnection are of all sizes.
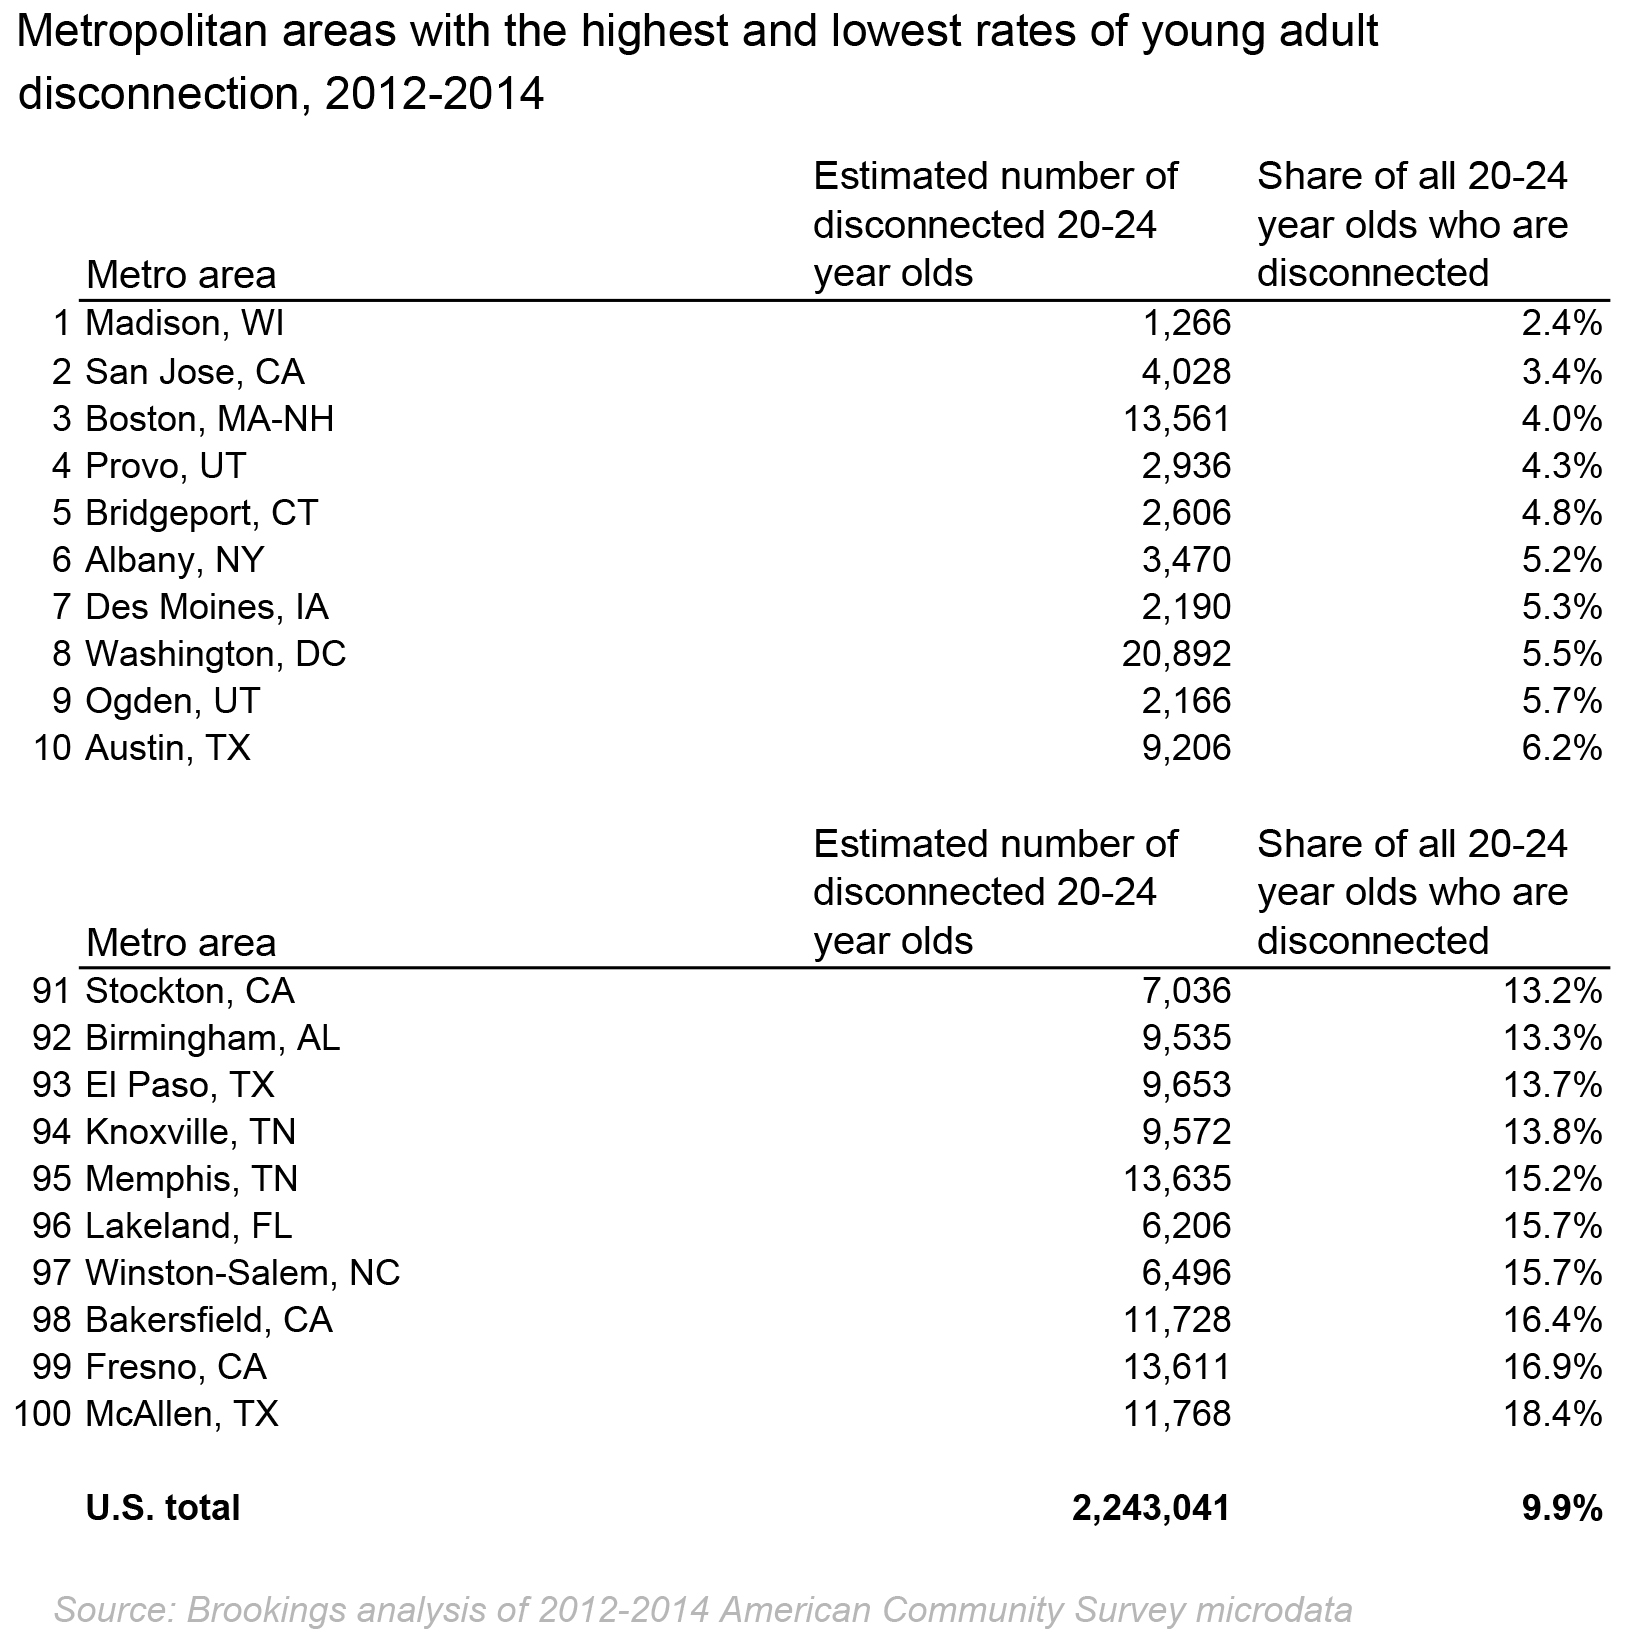
Not surprisingly, however, it is the largest metropolitan areas that have the highest numbers of disconnected teens and young adults, even if their rates of disconnection are lower. For example, the New York City region has the most disconnected teens (nearly 38,000) and young adults (113,000), even though its share of young people who are disconnected is below the national average. By comparison, in McAllen, TX, which has the highest rates, there are about 12,000 disconnected young adults and about 5,000 disconnected teens, a fraction of the number in the New York City area.
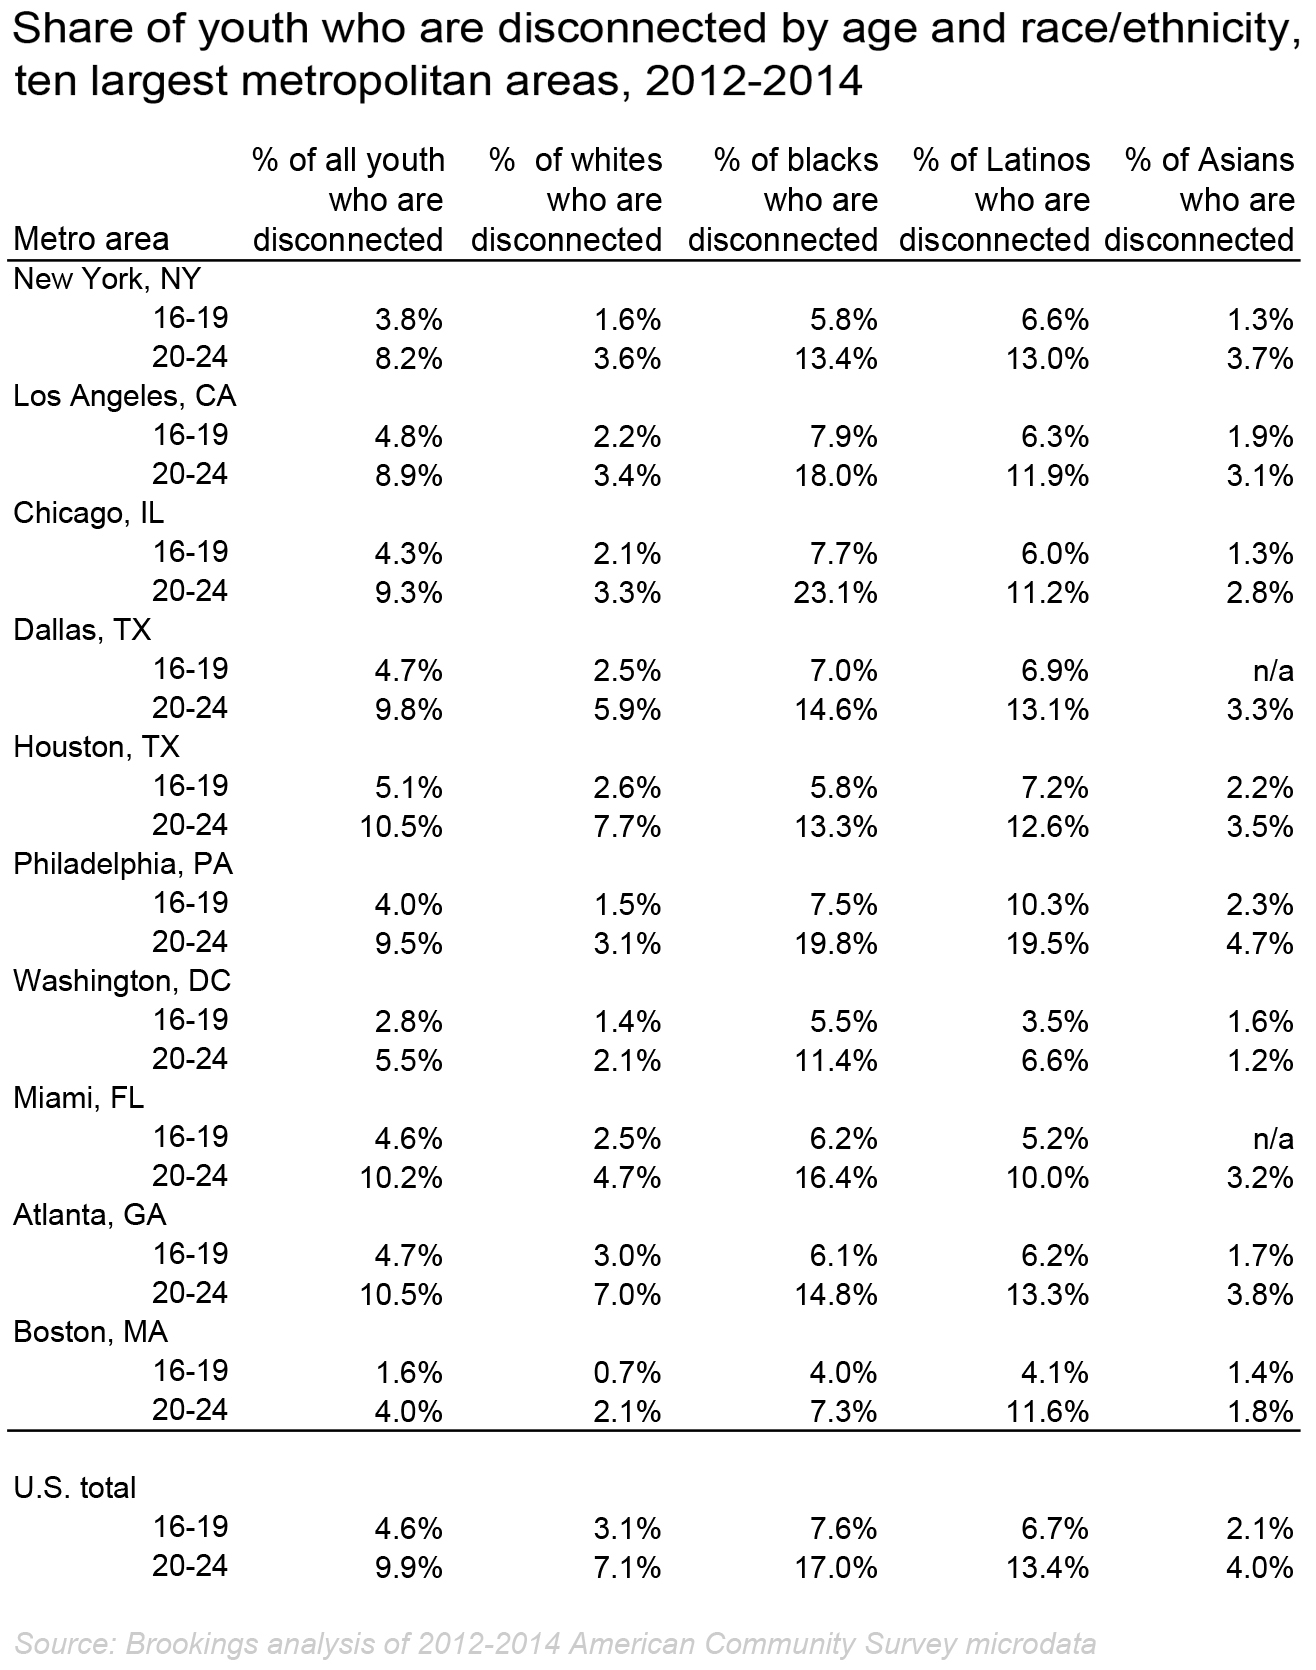
Among the 10 nation’s largest metropolitan areas (areas with large enough populations to support a detailed demographic analysis), the disparity in the disconnection rates among whites, blacks, and Latinos is striking. Houston has the smallest black-white gap: the share of young adult blacks who are disconnected (13.3 percent) is 1.75 times larger than the share of white young adults (7.7 percent). Chicago and Philadelphia have the largest black-white gaps. In Chicago, the share of black young adults who are disconnected is 23.1 percent, nearly 7 times the share of young white adults (3.3 percent). In Philadelphia, the share of black young adults who are disconnected (19.8 percent) is 6.5 times the share of young white adults (3.1 percent). Turning to Latinos, the differences with whites are not quite as large but still notable. Houston again has the smallest gap; 12.6 percent of Latino young adults are disconnected, more than one and half times the rate for white young adults (7.7 percent). Philadelphia and Boston have the largest gaps: 19.5 percent of Latino young adults in Philadelphia are disconnected, nearly 6.5 times larger than the share for young white adults (3.1 percent). In Boston, 11.6 percent of Latino young adults are disconnected, 5.5 times higher than the share of white young adults (2.1 percent).
Conclusion
Teen and young adult employment patterns do not exist in a vacuum. These findings show in stark terms the extent to which young people’s success in the labor market is shaped by place, race, and education. The low employment rates among black teens and young adults are particularly concerning, since their rates continue to lag behind other groups as adults. The weaker employment outcomes of blacks at all ages is probably related to multiple factors: relatively low levels of educational attainment, discrimination, and the neighborhood effects of living in concentrated poverty. (While not all black people live in concentrated poverty, they form a disproportionate share of those living in neighborhoods with poverty levels above 40 percent).
Unfortunately, there is no silver bullet to address youth disconnection or to better connect young people to employment. To succeed in today’s economy and earn middle-class wages, a young person needs to graduate from high school or earn an alternate credential, enroll in and complete some post-secondary education or job training, and then enter the labor market with skills that match employer demand. There are many points along that pathway at which a young person can get off-track, and many factors that can interfere with reaching those milestones. Schools, families, and neighborhoods all play a role in a young person’s trajectory—both positive and negative. Research suggests that youth employment programs with the following characteristics are most effective: They develop strong links between education, training, and the job market; focus on promoting healthy youth development; provide support services to address challenges such as childcare and transportation; offer opportunities for paid work closely aligned with or integrated into the program, and provide continuous support after job placement and program exit.
Methodology
Data on employment and unemployment rates come from Brookings’ analysis of American Community Survey (ACS) 1-year microdata, 2008 through 2014. Employment and unemployment rates are calculated for the civilian non-institutional population.
The years 2008–2014 are used due to data limitations. While the ACS allows small geographic analysis, it does not have a long time series. The American Community Survey was launched in the mid-2000s, and although this analysis could have included data from the 2000 Decennial Census and ACS data from 2006 and 2007, the Census Bureau made changes in the wording of labor market questions starting in 2008, making direct comparisons with earlier years less accurate.
Data on disconnected youth comes from the American Community Survey microdata as well. Using guidance from the Census Bureau, Brookings staff constructed a 3-year ACS file, combining and weighting three individual years of ACS data – 2012, 2013, and 2014. (The Census Bureau eliminated the 3-year ACS estimate from its data products starting in 2014.) We used a three-year estimate to bolster sample sizes in order to create more reliable estimates, particularly for small geographies.
While there is broad agreement that the terms “disconnected youth” or “opportunity youth” refer to young people not working and not in school, there is not a standard methodology or data source to create estimates of the number of such youth or their characteristics. Thus, different reports are likely to produce different figures, based on the use of different data sources and definitions.
In this analysis, people are considered disconnected if they meet the following criteria: they are between the ages of 16–24, not working (including both those who are unemployed and not in the labor force), not enrolled in school, living below 200 percent of the federal poverty line, with an educational attainment of less than an associate degree, not in the Armed Forces, and not living in group quarters.
We included the poverty and educational variables to limit the population to those who may be considered at-risk. Young people with a two- or four-year college degree are more likely to find and keep a non-low-wage job, and those whose families have higher earnings are more likely to have a family safety net. We removed those in the military, since that is a form of employment and to remain consistent with how the government typically reports statistics on employment and unemployment. We removed those in group quarters for several reasons. Group quarters refers to non-household based living arrangements, and includes “institutional group quarters,” such as such as correctional facilities or supervised medical facilities, and “non-institutional group quarters,” such as college dormitories, military bases, or group homes. Income is not reported for people living in “institutional group quarters,” making it impossible to calculate poverty levels for this subgroup. While there is income data for residents in some types of non-institutional group quarters, these individuals are students who may have low incomes from their own earnings but are often supported by their families, so the reported data on earnings does not always paint an accurate picture of their economic status.
1. Clive R. Belfield, Henry M. Levin, and Rachel Rosen, “The Economic Value of Opportunity Youth” (Washington: Civic Enterprises, 2012); Michael Wald and Tia Martinez, “Connected by 25: Improving the Life Chances of the Country’s Most Vulnerable 14-24 Year Olds” Working Paper (William and Flora Hewlett Foundation, 2003); Adrienne L. Fernandes and Thomas Gabe, “Disconnected Youth: A Look at 16- to 24-Year Olds Who are Not Working or in School” (Washington: Congressional Research Service, 2009); Douglas A. Besharov, ed., America’s Disconnected Youth: Toward a Preventive Strategy (Washington: Child Welfare League of America and American Enterprise Institute, 1999).
2. Paul Harrington and Ishwar Khatiwada, “U.S. Teens Want to Work” Federal Reserve Bank of Boston: Communities and Banking (27) (2) (2016): 9-11; Robert Halpern, Youth, Education, and the Role of Society (Cambridge: Harvard Education Press, 2013); Harvard Graduate School of Education, “Pathways to Prosperity: Meeting the Challenge of Preparing Young Americans for the 21st Century,” 2011; Andrew Sum et al, “Vanishing Work Among U.S. Teens, 2000-10: What a Difference a Decade Makes!” (Boston: Center for Labor Market Studies, Northeastern University, 2010); Jeylan Mortimer, “The Benefits and Risks of Adolescent Employment,” Prevention Researcher 17 (2) (2010: p 8-11).
Related Content


Related Books

Authors

The Brookings Institution is committed to quality, independence, and impact.
We are supported by a diverse array of funders. In line with our values and policies, each Brookings publication represents the sole views of its author(s).