Leaders in cities, metropolitan areas, and states across the country continue to seek ways to reenergize the American economy in a way that works better for more people. To support those efforts, this report provides an update on the changing momentum and geography of America’s advanced industries sector—a group of 50 R&D- and STEM (science-technology-engineering-mathematics)-worker intensive industries the vitality of which will be essential for supporting any broadly shared prosperity in U.S. regions.
What emerges from the update is a mixed picture of progress and drift that registers continued momentum in the manufacturing sub-sector; a major slump in energy; and strong, widely distributed growth in high-tech services— all of which adds up to a somewhat narrowed map of growth overall.
Three major findings emerge:
- The aggregate sector continued to expand between 2013 and 2015 despite global headwinds.
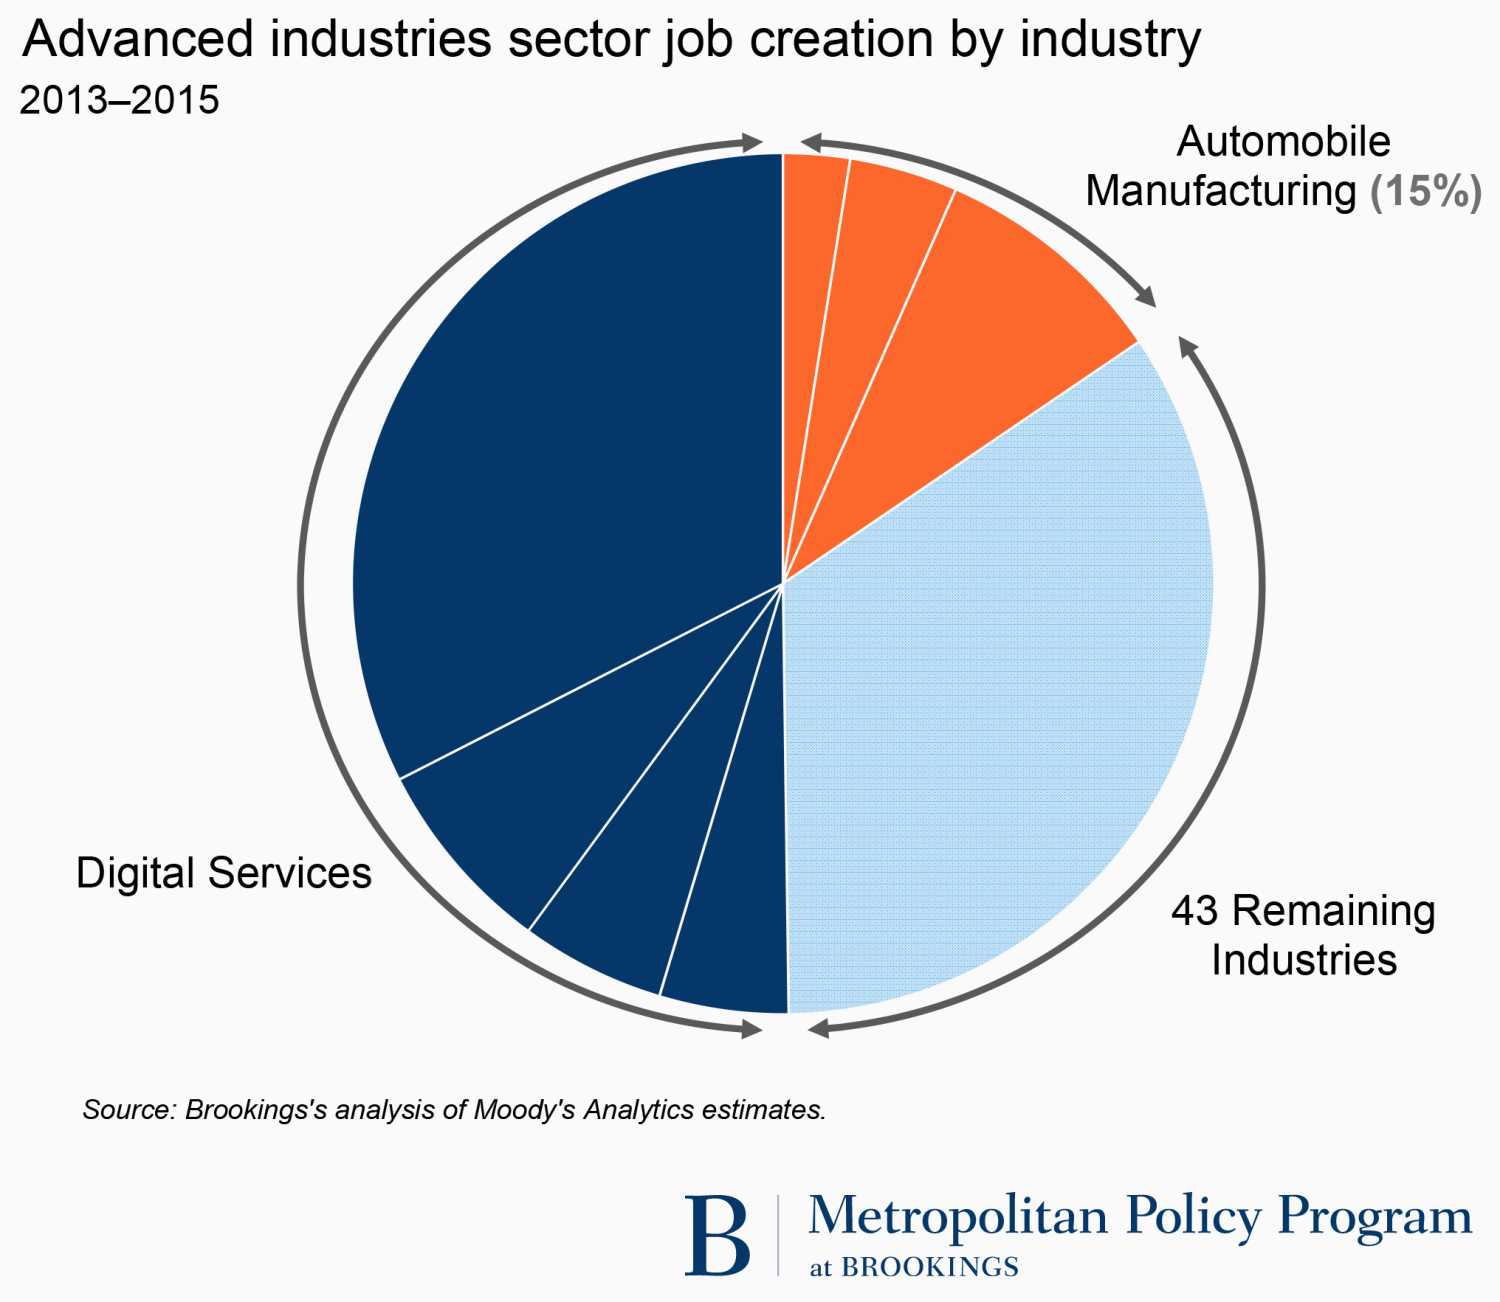
- Growth, however, emanated from a narrower set of auto manufacturing and “tech” service industries in the last two years. In fact, just three auto industries and four digital services industries accounted for more than 60 percent of the nation’s advanced-sector growth over the time period.
- The sector’s distribution grew more uneven across the country between 2013 and 2015. While a solid minority of the nation’s largest 100 metros achieved strong advanced-sector growth, some 59 saw advanced sector output or employment slow in those years.
Overall, these trends reveal both the value and evolving distribution of advanced economic activity and the need for federal and state-local strategies focused on boosting the sector’s growth and broadening its reach.
Interactive Data
Introduction
Summer 2016 finds the U.S. economy still performing only modestly well.
Output growth remains positive but middling, given sluggish labor productivity that limits the possibility for fast gains in standards of living.
Employment growth remains steady if unspectacular, but more than one-half of the nation’s hiring since 2010 has been concentrated in lower-wage industries with pay levels under $52,000 a year.
And otherwise, many are frustrated as the nation continues to debate what a rebuilt American economy that works better for more people might look like.
Which is why the Metropolitan Policy Program at Brookings has for the last several years been arguing that to truly rebuild America’s drifting economy, city and metropolitan area leaders—supported by their states and Washington—must work to build an “advanced economy that works for all.”[i]
Related Content

What would such an economy look like? An advanced economy that works for all would achieve a higher trajectory of long-run growth by improving the productivity of individuals and firms in ways that raise the standards of living for all people while reducing racial, spatial, and income disparities.
How might cities, metro areas, and the nation build such an economy? One step is certain: Along with improved innovation and training initiatives, stronger labor standards, and a rewoven social safety net, a key element of the needed reconstruction is a metro-by-metro rejuvenation of the nation’s high-tech “advanced industries” sector.
The importance of these high-value innovation and technology industries to any future shared prosperity is why the Metro Program began to focus on the sector in the wake of the 2008 economic crisis. Likewise, the centrality of these advanced industries’ progress to the nation’s long-run productivity and economic inclusion is why the program formally defined and began to track the growth of the sector, beginning with the 2015 report “America’s Advanced Industries: What They Are, Where They Are, and Why They Matter.” That report outlined 50 “advanced” industries that conduct inordinate amounts of R&D and employ large STEM (science, technology, engineering, and mathematics) workforces—key determinants of high-value economic enterprise.
Hence this expansion of that report. By adding two more years of data to the earlier trend analysis, this update looks beyond the immediate recovery years and into what has been a restive “new normal” characterized by a U.S. high-tech boom shadowed by a global trade slowdown, an oil and gas glut, and stubbornly high rates of poverty and disaffection.
In this fashion, the following analysis takes a fresh look at the changing momentum and geography of 50 industries whose vitality will be essential to any future a broadly shared prosperity in U.S. metropolitan areas. Output and employment growth data for the years 2013–2015 are compared to those for 2010–2013 for the 50 advanced industries at the national level, across all 50 states, and in the largest 100 metropolitan areas. New trends are identified across both industries and places.
What emerges is a mixed picture of continued progress in the manufacturing sector; a slump in energy; and rapid, accelerating, and widely distributed growth in high-tech services. Given these developments, the report depicts a somewhat narrowed map of growth overall. At the same time, the strong and surprisingly wide dispersion of digital services industries suggest the potential for broad gains through the diffusion of technology.
To present this story, the report first explains what advanced industries are and why they matter. It next charts the changing momentum and geography of the sector, with a special focus on these trends as they surface in larger metropolitan areas. Finally, a discussion section offers some takeaways for regional and national policymakers and economic development leaders. Maps, charts, and individualized state and metropolitan area “trend profiles” are available on the report website.
Overall, the trends reveal both the value and evolving distribution of advanced economic activity and the need for urgent federal as well as state and local efforts to boost their growth and broadening their reach.
Background
Before assessing the location and performance of the nation’s advanced industries, it bears discussing what advanced industries are and why they matter.
What advanced Industries are
This analysis like its predecessor asserts that a particular set of high-tech, high-skill technical industries constitutes the nation’s highest-value commercial sector—and so sets out to identify and track those industries.
Accordingly, the report reprises the definition employed in “America’s Advanced Industries” to designate as “advanced” those industries that conduct significant R&D and employ a disproportionate number of STEM workers. More precisely, advanced industries are those in which R&D spending per worker ranks among the top 20 percent of industries and the share of workers with a high level of STEM knowledge exceeds the national average. (See Chapter 3 and the methodology appendix of “America’s Advanced Industries” for more background on this definition and related analytic issues.)
On the basis of this definition, the U.S. advanced industries supersector encompasses 50 diverse industries, including 35 manufacturing, 3 energy, and 12 service industries. These industries include advanced manufacturing industries like aerospace, auto, medical devices, and pharmaceuticals, energy-oriented industries such as oil and gas extraction and electric power generation, and high-tech service activities such as computer system design, R&D services, software, and telecommunications.
As such, the supersector includes a wide array of industries using a wide variety of technologies. Yet, despite the variety, the flow of technology use and business transformation among the advanced industries appears to be erasing conventional industry and sector distinctions and turning the super-sector into the leading focal point of technology convergence in developed economies.
Along these lines, the advanced sector can be characterized as the nation’s prime site for technology development, application, and hybridization. Multiple developments in this supersector reveal this nexus:[ii]
- The physical and digital worlds are converging in these industries as the “digitization of everything” pervades all of its fields, transforming nearly all enterprises with software, “big data,” and connectivity to the internet
- The related Internet of Things (IoT)—the convergence of industrial machines, sensors, data, and the internet—is unleashing new ways to optimize the functionality, efficiency, and reliability of physical systems
- Advanced robotics, artificial intelligence, and machine learning are making it possible to automate more and more worker tasks, opening the possibility of both productivity gains and labor market disruption
- Applied physics, materials science, and chemistry are interacting to develop advanced materials with radically useful attributes, including incredible strength, conductivity or the ability to “remember” previous states
- Next-generation genomics is bringing low-cost genetic analysis and “editing” to bear to improve medical diagnostics, accelerate drug discovery, and develop drought- and pest-resistant crops
In sum, the advanced industries sector is the portion of the economy that is at once developing and utilizing the nation’s most transformative technologies.
Why Advanced Industries Matter
The advanced sector’s special value stems from its inordinate role in generating prosperity.
That generative role begins with the industries’ defining characteristics of R&D spending and STEM workers. These industries are the nation’s main locus of industrial innovation and technical skills.
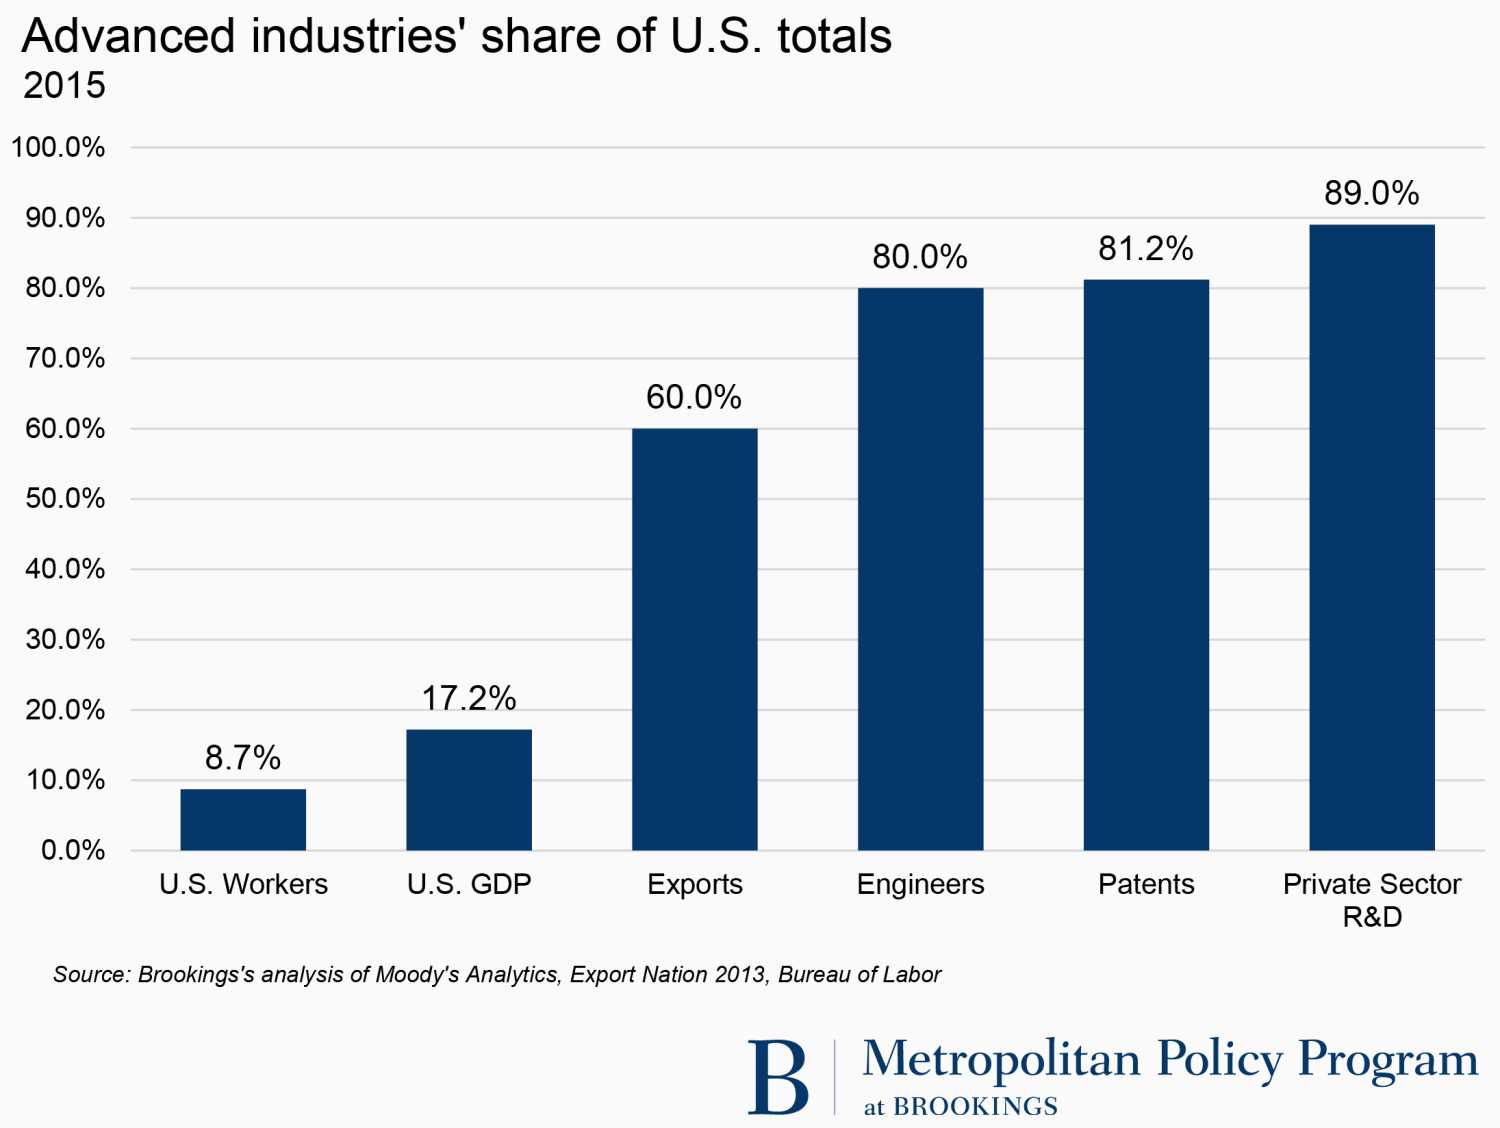
The sector’s innovation capacity matters because technology advancement represents the most viable way for nations, states, regions, companies, and workers to increase their productivity and continue to improve their standards of living.[iii] Given that, the advanced sector is critical to U.S. local and national prosperity because it conducts 89 percent of the nation’s private-sector R&D and generates more than 80 percent of the nation’s patents. As such, the sector represents the nation’s main source of the technical advances that drive increased productivity, which in turn generates increased profits and market share for firms, growth for industries, and potentially broader economic benefits for households, regions, and the nation.
Likewise, the advanced industries sector trains and employs much of the nation’s critical STEM workforce. STEM workers—from aerospace engineers and plant scientists to petroleum geologists, software developers, and skilled technicians—matter because they invent and install the technical innovations that sustain innovation and growth.[iv] At the professional level, highly trained scientists and engineers keep firms and industries on the cutting-edge through inventions and entrepreneurship. At the sub-bachelor’s level, skilled technicians produce, install, maintain, repair, and operate the systems designed and patented by researchers, allowing firms and industries to reach their markets, maximize sales, create process innovations, and enhance productivity. That advanced industries employ 80 percent of the nation’s engineers underscores the sector’s role as America’s main storehouse of its most economically valuable technical workers.
In keeping with its R&D and STEM-worker intensiveness, the sector generates multiple economic benefits:
- Because it is innovative and skilled, the sector is highly productive, which makes it competitive and profitable. Overall, the advanced industries sector has increased its aggregate productivity by about 2.7 percent annually since 1980, far faster than has the rest of the economy, which has managed annual productivity growth of just 1.4 percent[v]
- Because the sector is competitive it generates an outsized 60 percent of U.S. exports despite representing less than 10 percent of the nation’s employment
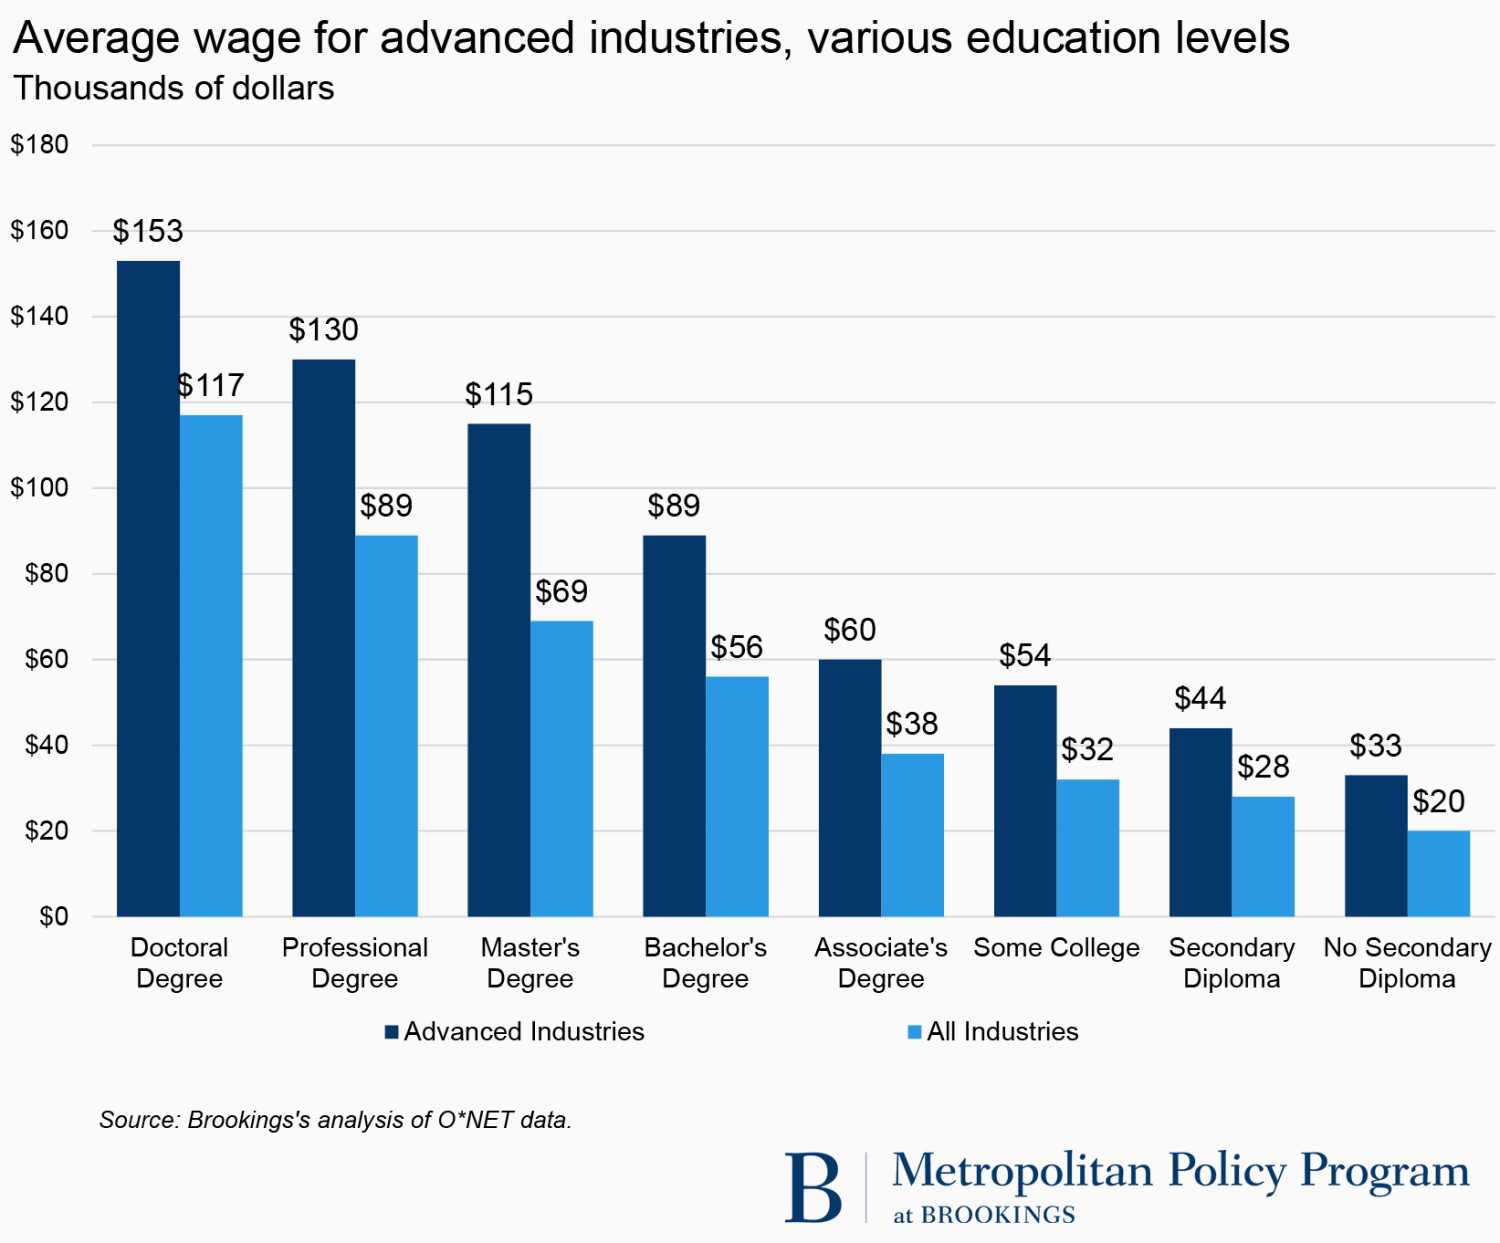
- And for similar reasons, the sector pays well. Because the sector is highly productive, each worker generates approximately $214,000 worth of output compared with $108,000 for the average worker outside the sector.[vi] That allows for high and rising salaries, which contrast strikingly with those in the rest of the economy. In 2015, the average advanced industries worker earned $95,000 in total compensation, or nearly double that ($53,000) of the average worker in other sectors. The compensation reflects a 68 percent increase between 1975 and 2015, after adjusting for inflation. That compares with just a 25 percent pay raise outside the sector. Moreover, the pay premium extends to workers of all education and skill levels in the sector. A worker with an associate’s degree earns approximately $58,000 a year in the sector compared with about $38,000 outside it.
Beyond those industry specific contributions, the sector’s positive impacts radiate outward through the economy:
- Given the sector’s long supply chains, the sector’s substantial “multiplier effect” means that every new advanced industries job creates 2.2 additional jobs domestically: 0.8 jobs locally and 1.4 outside the region. That ensures that the sector supports some 39 million jobs nationally—one quarter of all private employment. These impacts are more than twice the size of those associated with other industries and reflect that advanced industries purchase some $236,000 in goods and services per worker from other businesses annually compared with $67,000 spent by other types of businesses[vii]
- At the same time, the sector is the nation’s prime source of the technology and productivity diffusion, by which innovations spread through the economy to benefit workers, firms, industries, and regions.[viii] In this regard, the technical innovations and productivity of the advanced sector make the rest of the economy more innovative and productive as the sector’s technologies, tools, and processes diffuse outward through industry networks, customer and supplier relationships, and the labor market.[ix] These benefits accrue across the country as advanced sector innovations spread through formal sales, investments, imitation, and worker “job hopping.” In some cases—as with information and communications technology (ICT) products and services—advanced sector technologies have turned out to be “general purpose technologies” (GPTs) that have enabled major productivity advances through the economy.[x] Nothing shows this better than the wide adoption of ICT technology in the late 1990s and early 2000s. During the period technology developed by an advanced industry employing just 2.5 percent of the workforce was responsible for two-thirds of U.S. productivity growth across multiple industries. That impact improved the standard of living for almost everyone by driving the economy toward full employment. Given that, many economists are currently hoping for similarly broad productivity gains as advances in robotics, machine learning, and data science roll out across more industries. For now, though, the clear fact is that nation’s anemic productivity growth would be far worse today without the diffusion of advanced industry technology and productivity. Likewise, the wider diffusion of existing and future advanced industries innovations will likely be crucial to improving U.S. productivity growth.[xi]
In sum, although all jobs and industries matter, none matter more than those in the advanced industries sector. Which raises an important final point: Advanced industries’ vitality and growth will be essential to delivering on the advanced economy aspiration.
As the Metro Program’s “Metro Monitor” suggested earlier this year, an advanced economy that works for all will deliver economic expansion (growth) that also raises local standards of living (prosperity) for all people (inclusion). Yet as it happens, the advanced industries sector contributes heavily to all three of these goals as suggests its performance on many “Monitor” balanced-growth indicators.
As sources of growth, advanced industries contribute modestly to national and local job creation but are outsized contributors to output and wage growth.
As sources of prosperity, the industries are the nation’s leading sources of productivity growth, wage growth, and output per worker.
As sources of inclusion, the industries’ high median wages; accessible, quality jobs; and substantial wage premiums and skills training at all levels of employment compare favorably to other sectors.
In short, the vitality and growth of America’s advanced industries sector will be essential if the United States is to build an advanced economy that works for all.
Findings: Recent trends in America’s Advanced Industries Sector
So how, then, are America’s advanced industries doing? A new analysis of the growth and geography of the sector’s 50 industries covering the period from late 2013 to late 2015 finds that multiple high-tech service industries were booming as a “new normal” set in even as growth in advanced manufacturing and energy industries slowed slightly or in the latter case ceased.
Three major findings emerge:
1. The advanced industries sector continued to expand between 2013 and 2015 despite global headwinds, and it now employs 500,000 more workers than before the recession
Since 2013 and the previous Brookings analysis, America’s high-value advanced industries sector has continued to grow faster than the rest of the economy, despite several challenges.
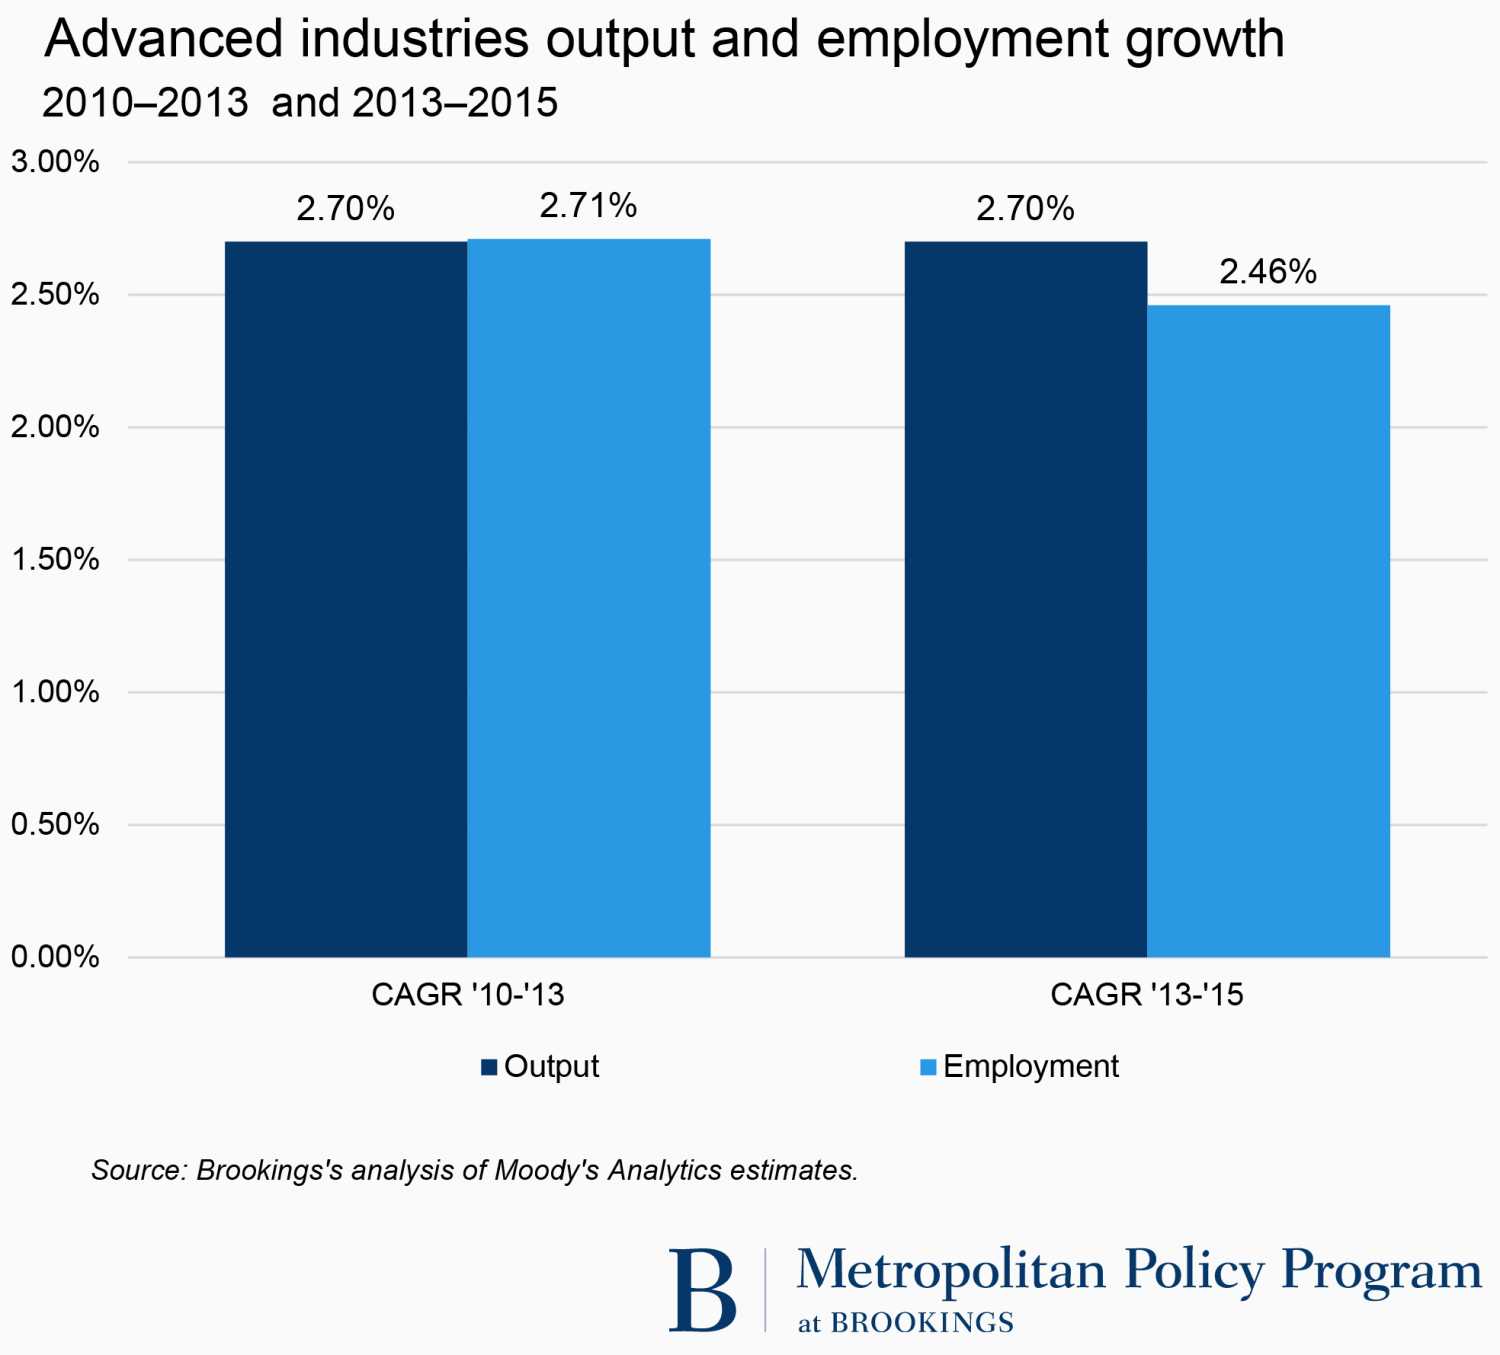
In aggregate, the sector added $143 billion to U.S. gross domestic product (GDP) in 2013–2015, and accounted for more than 20 percent of the growth of the economy. This output maintained the sector’s 2.7 percent compound annual growth rate (CAGR) since the Great Recession and again exceeded the growth of the overall economy, although by a slimmer 0.4 percent annual rate.
Overall, the sector’s recent rate of progress reflects both the continued steady recovery of the U.S. economy in 2014 and 2015, as well as the onset of weaker global demand (especially in China) and a global oil and gas glut. The interplay of these positive and negative factors allowed for stability but likely limited potentially greater output growth.
Nonetheless, the continued positive performance of the advanced industries sector raised brought it to its highest share of the U.S. economy in 30 years. By the end of 2015, U.S. advanced industries’ output accounted for 17.2 percent, or $2.8 trillion, of U.S. GDP, a share roughly twice its employment share that underscores the sector’s high productivity.
Employment trends, meanwhile, tracked with output, albeit with somewhat reduced job creation. During the two-year period (2013–2015), the aggregate sector added 611,500 jobs, reflecting a slight slowdown in hiring, from 2.7 percent to 2.5 percent CAGR.
Still, the sector accounted for 11.3 percent of all U.S. job growth in 2013–2015—an outsized share of the nation’s growth given the sector’s size, though a smaller share than the sector recorded in the immediate post-recession period. As a result, 12.9 million American workers are now employed in U.S. advanced industries, some 500,000 more than in 2008. These workers compose 8.7 percent of the total U.S. workforce. Factoring in the sectorwide multiplier effect suggests that the sector supports another 28.4 million jobs beyond direct employment. That means that the sector directly or indirectly employs 41.3 million workers, or as much as 28 percent of the American workforce.
Stepping back from these most recent trends, it is worth recalling that recent developments reflect a long-term disconnection between continued rapid output growth and modest employment growth in the aggregate advanced sector. Since 1980, U.S. advanced industries’ output has grown by 4.3 percent annually while employment has grown by just 0.5 percent annually (although it is growing faster now). The bifurcation reflects rapid productivity growth and potentially automation in the sector combined with substantial employment reductions in manufacturing industries.
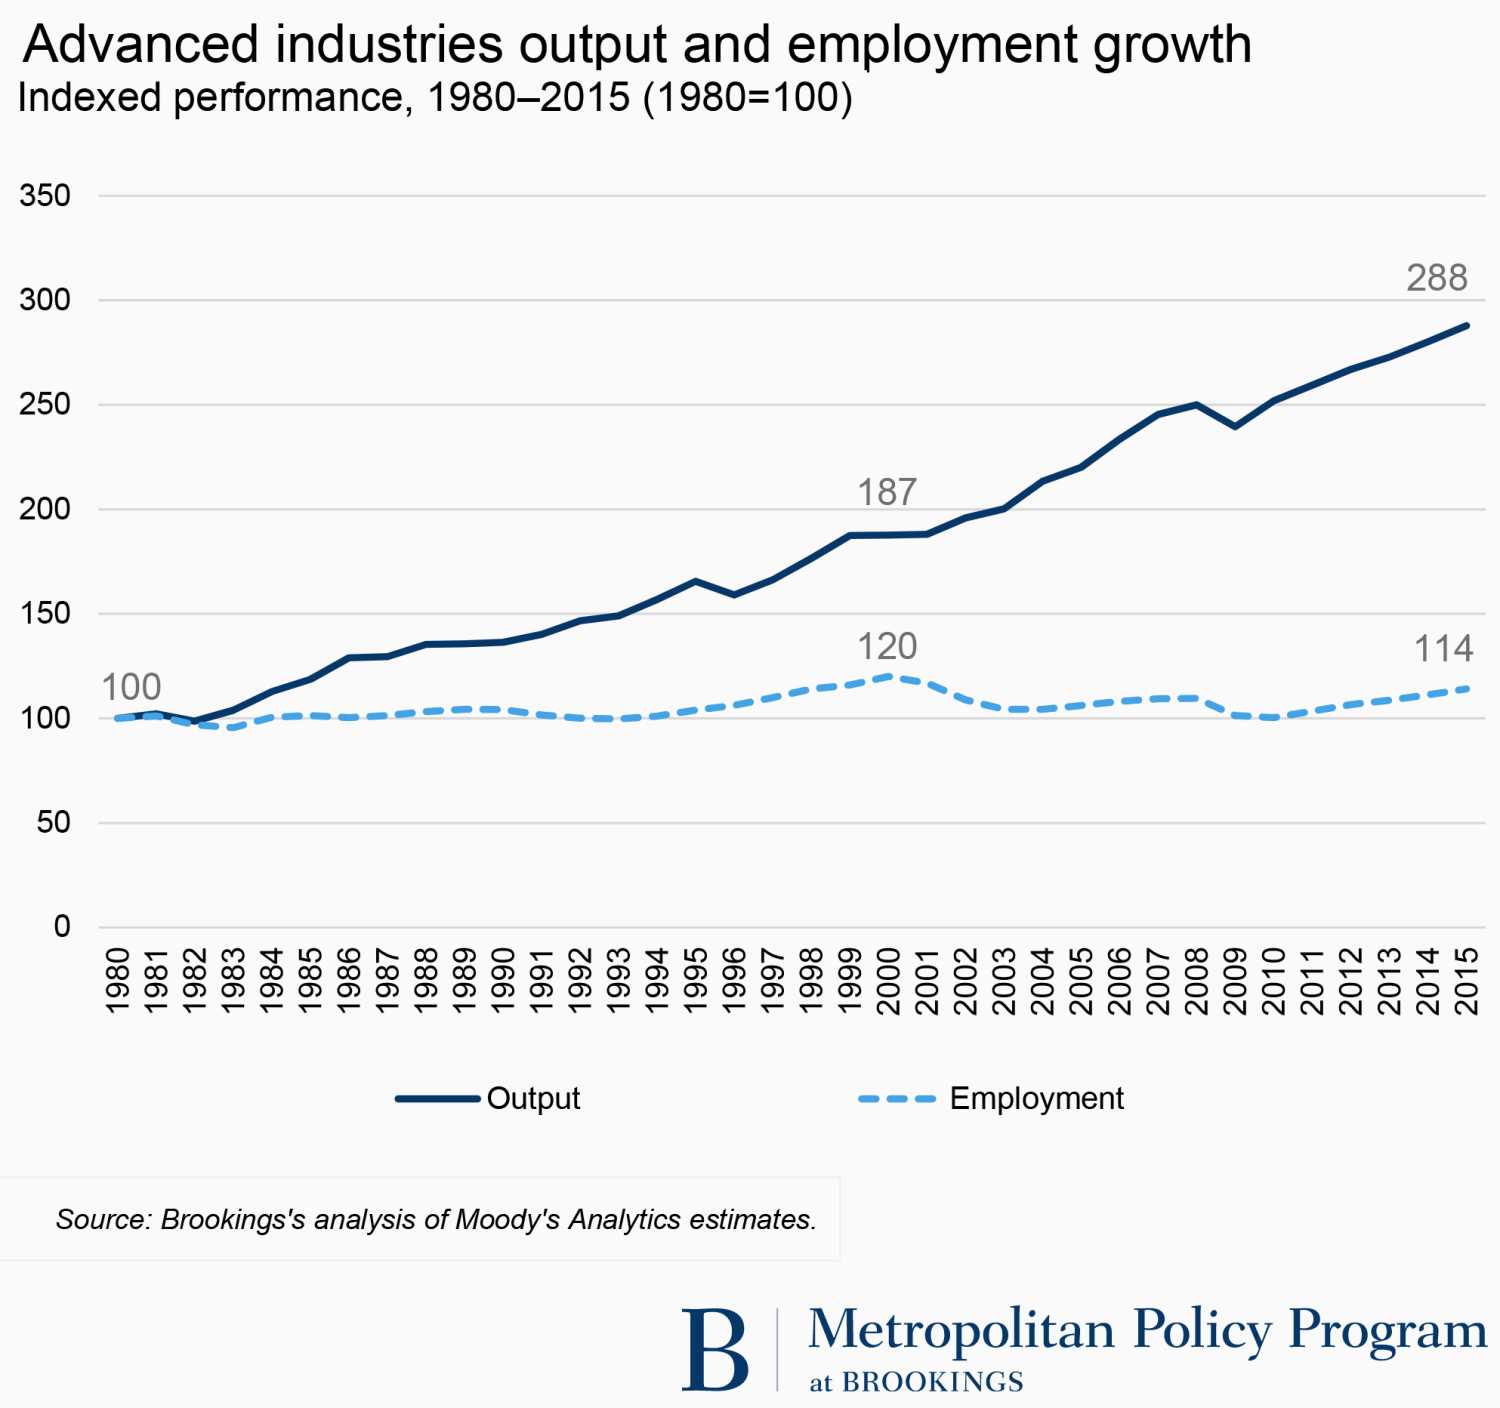
Given these trends, the advanced industries sector now accounts for a larger share of U.S. GDP than it has at any time since 1980, even though employment remains slightly below its 1980 share of the economy, despite the recent employment uptick.
2. Growth in the advanced sector, however, emanated from a narrower set of auto manufacturing and “tech” service industries in the last two years than in the previous three
Notwithstanding the sector’s continued expansion, the industry base of that growth narrowed between 2013 and 2015. Immediately following the recession, advanced industries employment and output grew solidly, driven by the sector’s three major subsectors: advanced manufacturing, energy, and services. This reflected not only the long-term rise of the services subsector simultaneous to long-term employment losses in manufacturing, but also an oil and gas boom between 2010 and 2013 driven by unconventional hydraulic fracturing (“fracking”) in the energy sector.
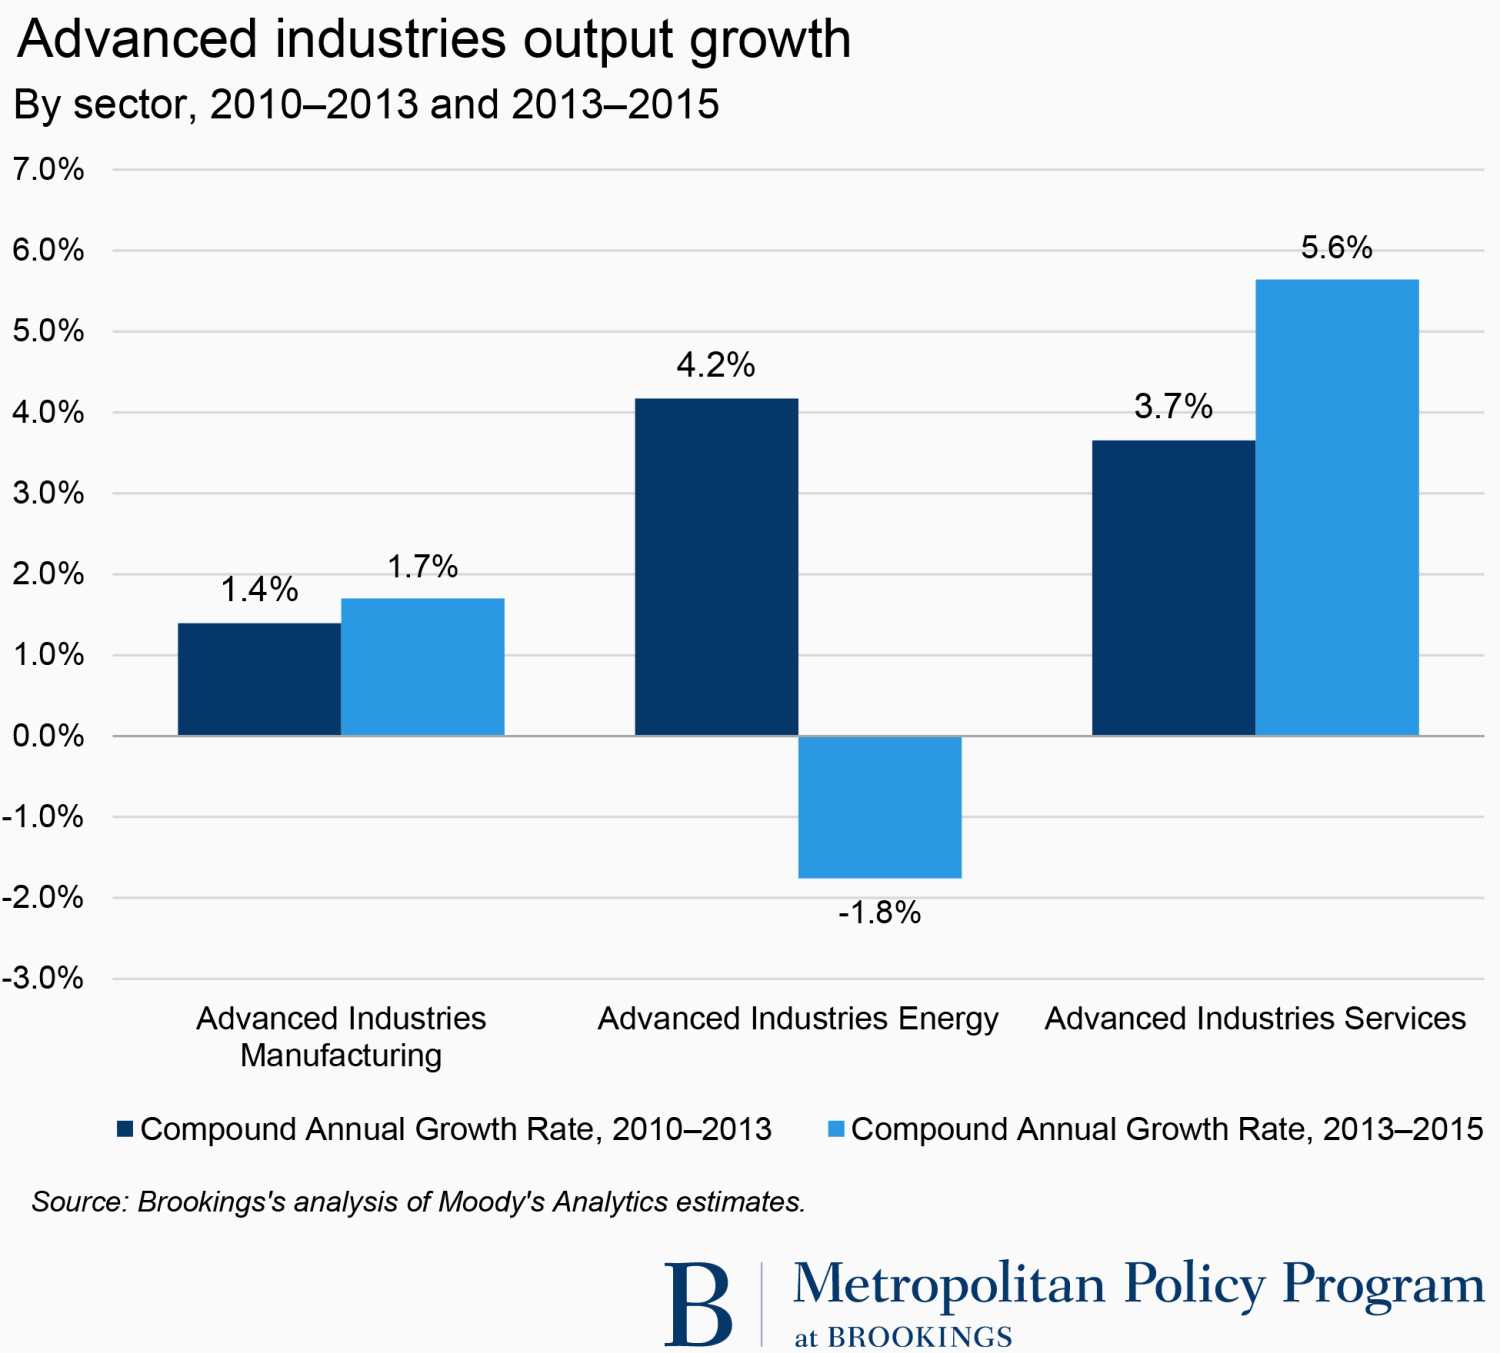
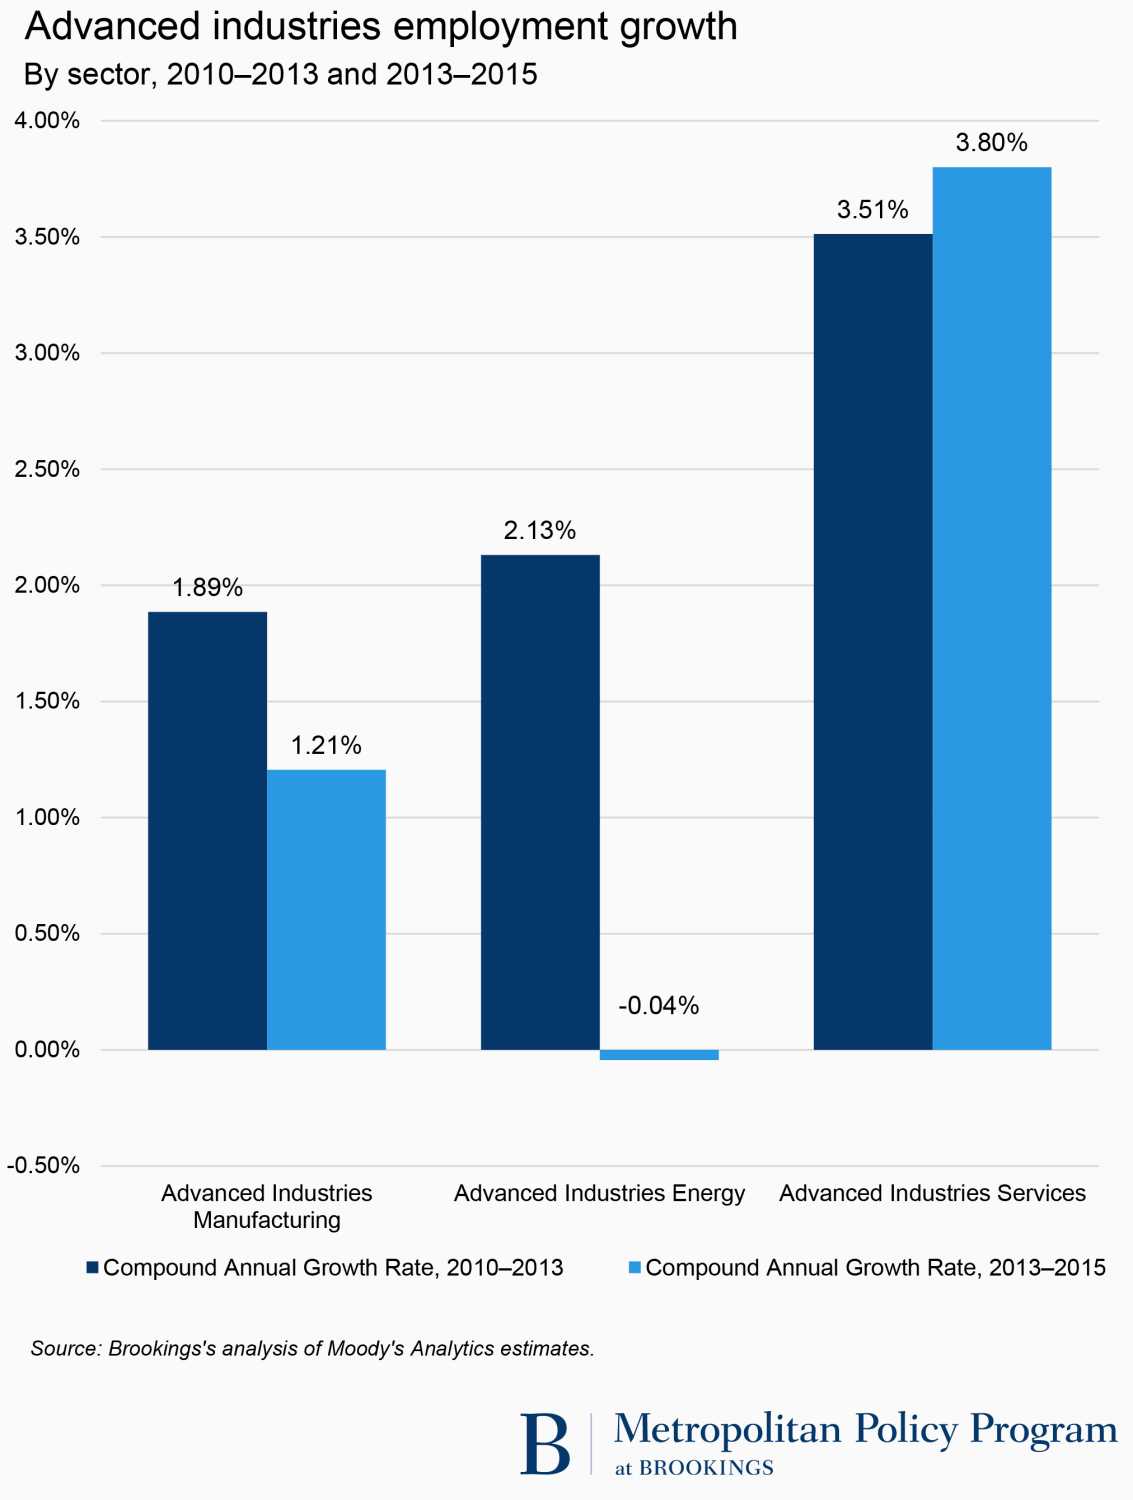
In the 2010–2013 period, these and other trends—including rapid export growth fueled by Asian demand—ensured that the advanced manufacturing, energy, and services subsectors each contributed solidly to growth, with annual output gains of 1.4, 4.2, and 3.7 percent, respectively, and employment gains of 1.9, 2.1, and 3.5 percent, respectively.
However, in 2013–2015 this relatively balanced pattern of growth shifted. With manufacturing exports depressed by a global economic slowdown and a strong dollar and a world oil and gas glut depressing the energy sector, a digital and technology services boom took center stage as the main engine of advanced industries’ growth. Meanwhile, advanced manufacturing employment growth slowed slightly (although output rose) and energy employment and output growth disappeared or declined.
Reflecting these trends, the locus of growth narrowed, as high-tech service industries emerged as the nation’s leading source of advanced industries’ growth between 2013 and 2015.
Altogether, the service subsector in advanced industries added 500,000 new jobs, or approximately 80 percent of the sector’s total growth between 2013 and 2015. That share was up from the subsector’s 64.5 percent share in the same period. By contrast, advanced manufacturing industries contributed just 132,000 jobs while advanced energy industries contributed none.
Looking across the entire sector, 29 of the 50 advanced industries saw both output and employment growth at once. Likewise, 16 of the 50 advanced industries saw output and employment growth accelerate.
Turning to the industry-specific components of growth, the surge of the services subsector between 2013 and 2015 had a strong digital orientation while auto industries kept the manufacturing subsector growing even as energy’s contributions disappeared.
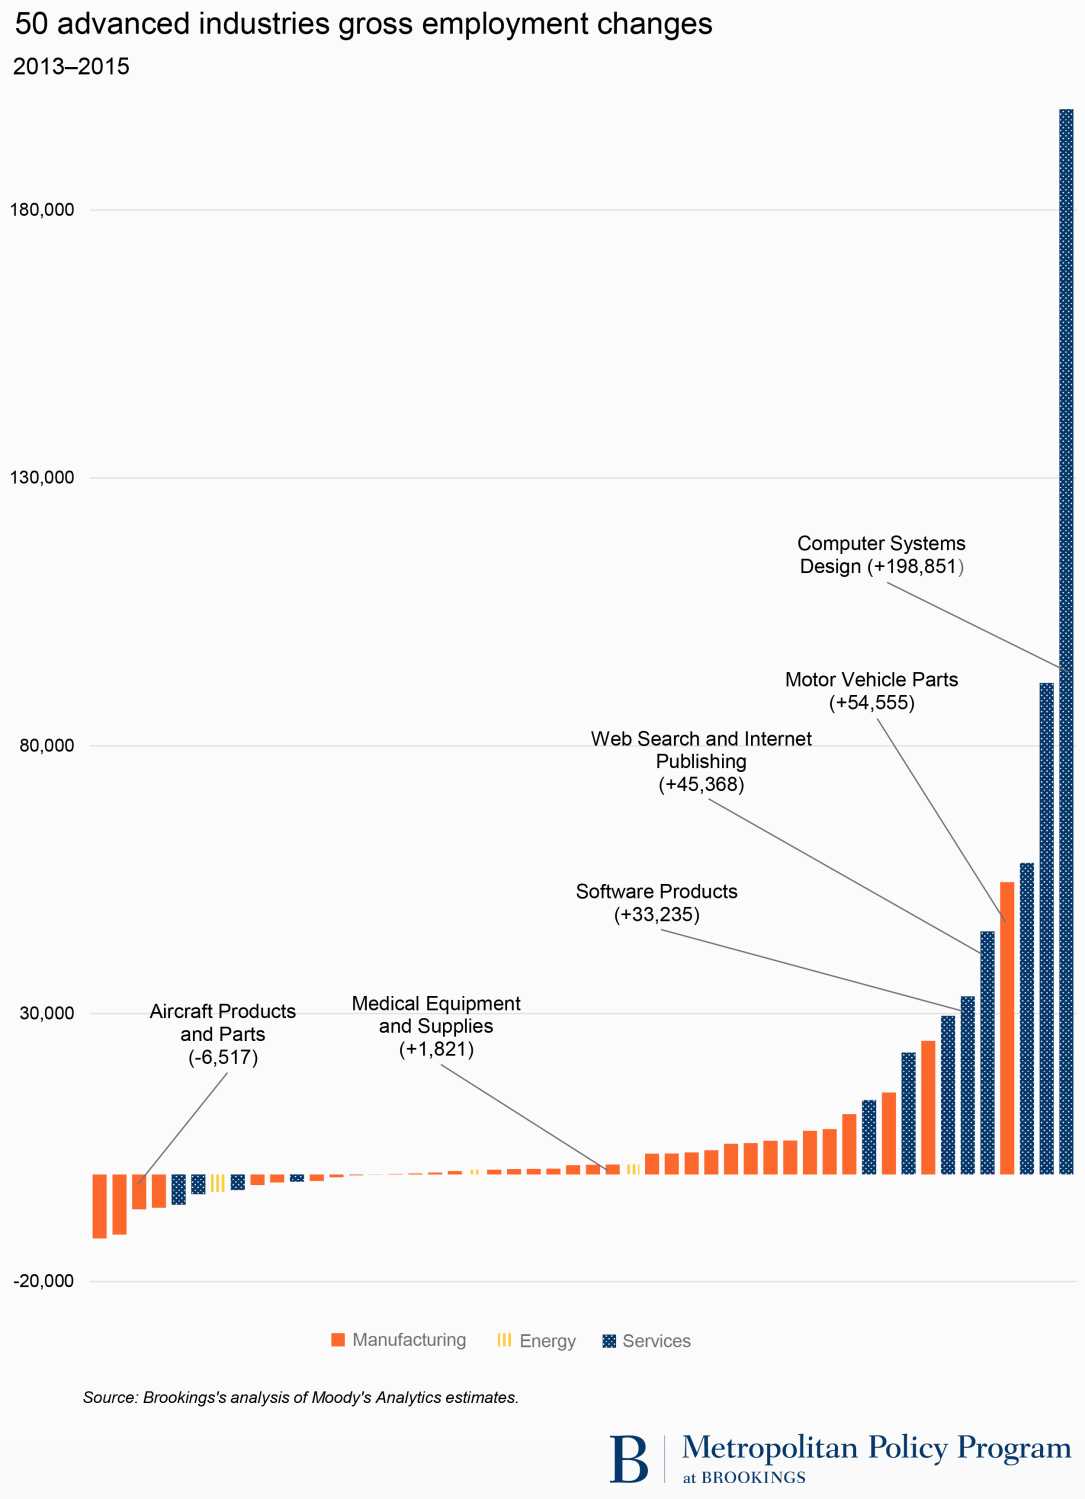
High-tech advanced service industries dominated the growth trends between 2013 and 2015 amid a wave of excitement about new software-based opportunities in social media, sharing platforms, digital health and “fin-tech,” automation, the Internet of Things, and big data.[xii] Consequently, although nearly four-fifths of advanced-sector employment growth (480,000 jobs) from 2013 to 2015 emerged from the services subsector, nearly two-thirds of that growth (307,000 jobs) originated in just four fast-growing digital services: computer systems design; web search and internet publishing; software products; and data processing and hosting. Employment in all of these industries grew by 5 percent CAGR from 2013 to 2015, and three of the four accelerated their growth over the pace during 2010–2013. Management consulting, engineering, and R&D services also continued to add jobs and grow quickly. Overall, 9 of the 12 industries in the advanced services subsector picked up the pace of their output and job growth (or slowed job losses) in the recent period compared with the prior one.
At the same time, progress among advanced manufacturing industries slowed somewhat between 2013 and 2015 as the solid expansion following the recession (2010–2013) ran into headwinds. This slowdown reflected the combination of a strong dollar and a major slowing of global demand for U.S. commodity and machinery exports. These factors led to a significant slowing of output and employment growth in a variety of materials and machinery industries, ranging from iron and steel and aluminum products to agriculture, construction, mining machinery, and engine and power equipment. In this regard, although advanced manufacturing industries still managed to contribute more than 20 percent of advanced-sector employment growth (132,200 jobs) between 2013 and 2015, nearly 70 percent of that growth (95,000 jobs) originated in the three auto-related industries: motor vehicle parts, motor vehicles, and motor vehicle body and trailers. Several of these industries saw slower output growth, and output growth slowed in 18 of the 35 advanced manufacturing industries. Meanwhile, 9 of the 35 manufacturing industries lost jobs between 2013 and 2015 while 20 experienced slower employment growth between 2013 and 2015 than between 2010 and 2013. Nonetheless, output growth for the advanced manufacturing sector as a whole increased (owing to gains in petroleum, chemicals, pharmaceuticals, industrial machinery, appliances, and medical equipment) even as employment growth slowed.
Finally, the advanced energy industries group slumped as the U.S. “fracking” boom led to an oil and gas glut and energy demand stagnated worldwide. Given those trends, both the oil and gas extraction and mining industries saw precipitous output and employment growth slowdowns. Given these pull-backs, the energy subsector shifted from being a significant contributor to the nation’s advanced industries economy to a nonfactor.
Overall, slower hiring in advanced manufacturing and a recession in the energy sector left the nation’s advanced industries economy increasingly reliant in 2013–2015 on a narrowed growth base.
Reflecting these trends, the locus of growth narrowed, as high-tech service industries emerged as the nation’s leading source of advanced industries’ growth between 2013 and 2015.
Altogether, the service subsector in advanced industries added 500,000 new jobs, or approximately 80 percent of the sector’s total growth between 2013 and 2015. That share was up from the subsector’s 64.5 percent share in the same period. By contrast, advanced manufacturing industries contributed just 132,000 jobs while advanced energy industries contributed none.
Looking across the entire sector, 29 of the 50 advanced industries saw both output and employment growth at once. Likewise, 16 of the 50 advanced industries saw output and employment growth accelerate.
Turning to the industry-specific components of growth, the surge of the services subsector between 2013 and 2015 had a strong digital orientation while auto industries kept the manufacturing subsector growing even as energy’s contributions disappeared.
High-tech advanced service industries dominated the growth trends between 2013 and 2015 amid a wave of excitement about new software-based opportunities in social media, sharing platforms, digital health and “fin-tech,” automation, the Internet of Things, and big data.[xii] Consequently, although nearly four-fifths of advanced-sector employment growth (480,000 jobs) from 2013 to 2015 emerged from the services subsector, nearly two-thirds of that growth (307,000 jobs) originated in just four fast-growing digital services: computer systems design; web search and internet publishing; software products; and data processing and hosting. Employment in all of these industries grew by 5 percent CAGR from 2013 to 2015, and three of the four accelerated their growth over the pace during 2010–2013. Management consulting, engineering, and R&D services also continued to add jobs and grow quickly. Overall, 9 of the 12 industries in the advanced services subsector picked up the pace of their output and job growth (or slowed job losses) in the recent period compared with the prior one.
At the same time, progress among advanced manufacturing industries slowed somewhat between 2013 and 2015 as the solid expansion following the recession (2010–2013) ran into headwinds. This slowdown reflected the combination of a strong dollar and a major slowing of global demand for U.S. commodity and machinery exports. These factors led to a significant slowing of output and employment growth in a variety of materials and machinery industries, ranging from iron and steel and aluminum products to agriculture, construction, mining machinery, and engine and power equipment. In this regard, although advanced manufacturing industries still managed to contribute more than 20 percent of advanced-sector employment growth (132,200 jobs) between 2013 and 2015, nearly 70 percent of that growth (95,000 jobs) originated in the three auto-related industries: motor vehicle parts, motor vehicles, and motor vehicle body and trailers. Several of these industries saw slower output growth, and output growth slowed in 18 of the 35 advanced manufacturing industries. Meanwhile, 9 of the 35 manufacturing industries lost jobs between 2013 and 2015 while 20 experienced slower employment growth between 2013 and 2015 than between 2010 and 2013. Nonetheless, output growth for the advanced manufacturing sector as a whole increased (owing to gains in petroleum, chemicals, pharmaceuticals, industrial machinery, appliances, and medical equipment) even as employment growth slowed.
Finally, the advanced energy industries group slumped as the U.S. “fracking” boom led to an oil and gas glut and energy demand stagnated worldwide. Given those trends, both the oil and gas extraction and mining industries saw precipitous output and employment growth slowdowns. Given these pull-backs, the energy subsector shifted from being a significant contributor to the nation’s advanced industries economy to a nonfactor.
Overall, slower hiring in advanced manufacturing and a recession in the energy sector left the nation’s advanced industries economy increasingly reliant in 2013–2015 on a narrowed growth base.
In contrast to the recovery years of 2010–2013, by 2013–2015 no less than one-half of the nation’s advanced industries’ employment growth was from a booming computer systems design industry and the three auto industries. With a few more digital services such as software and web search / internet publishing, just seven advanced industries in the digital services and auto domains generated two-thirds percent of the nation’s advanced sector growth between 2013 and 2015. That share was up from 55 percent in the previous three years. In short, the nation has grown more dependent on continued auto sector progress and a short list of rapidly growing high-tech services for output and employment growth.
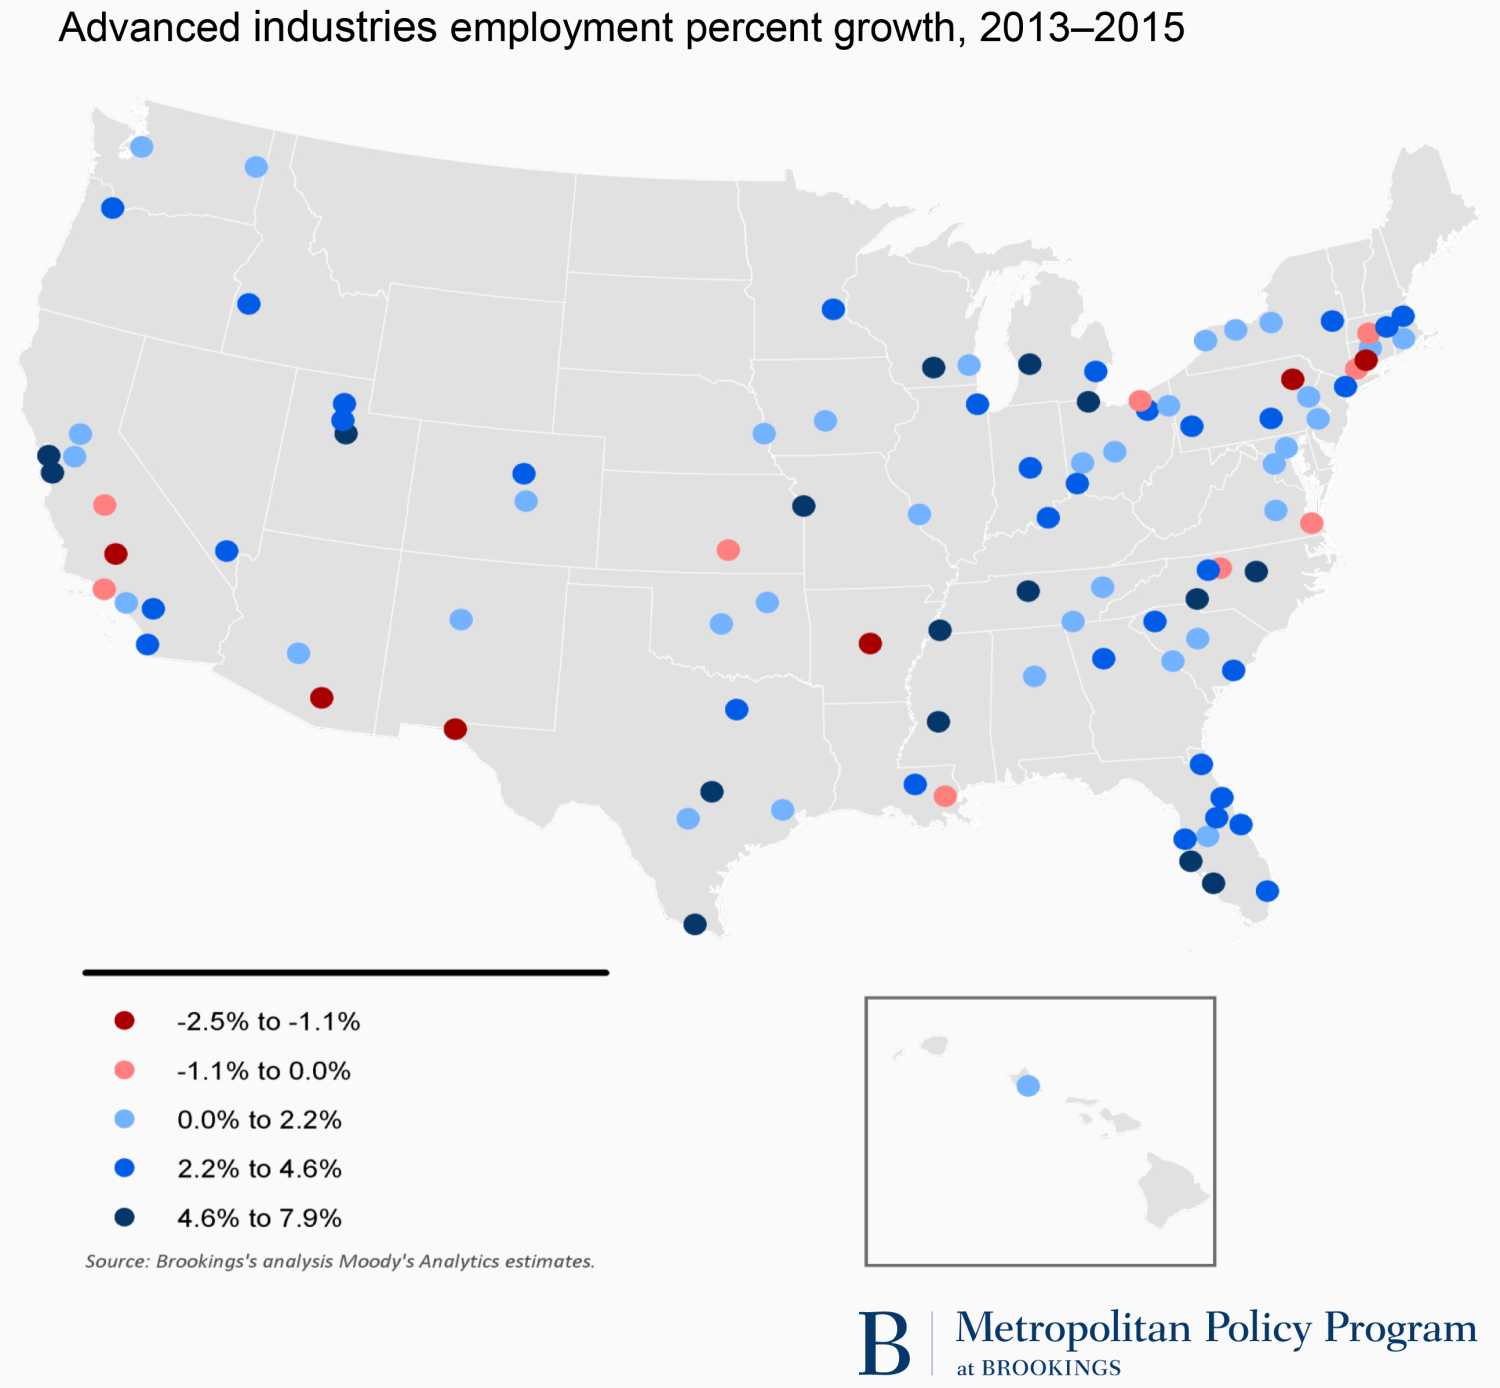
3. U.S. advanced industries’ growth trends grew more uneven across the country between 2013 and 2015
Advanced industries remain widely dispersed across the United States. Every region, state, and metropolitan area contains at least a few thousand advanced sector jobs. Given that, most areas of the country have had a toehold in the sector.
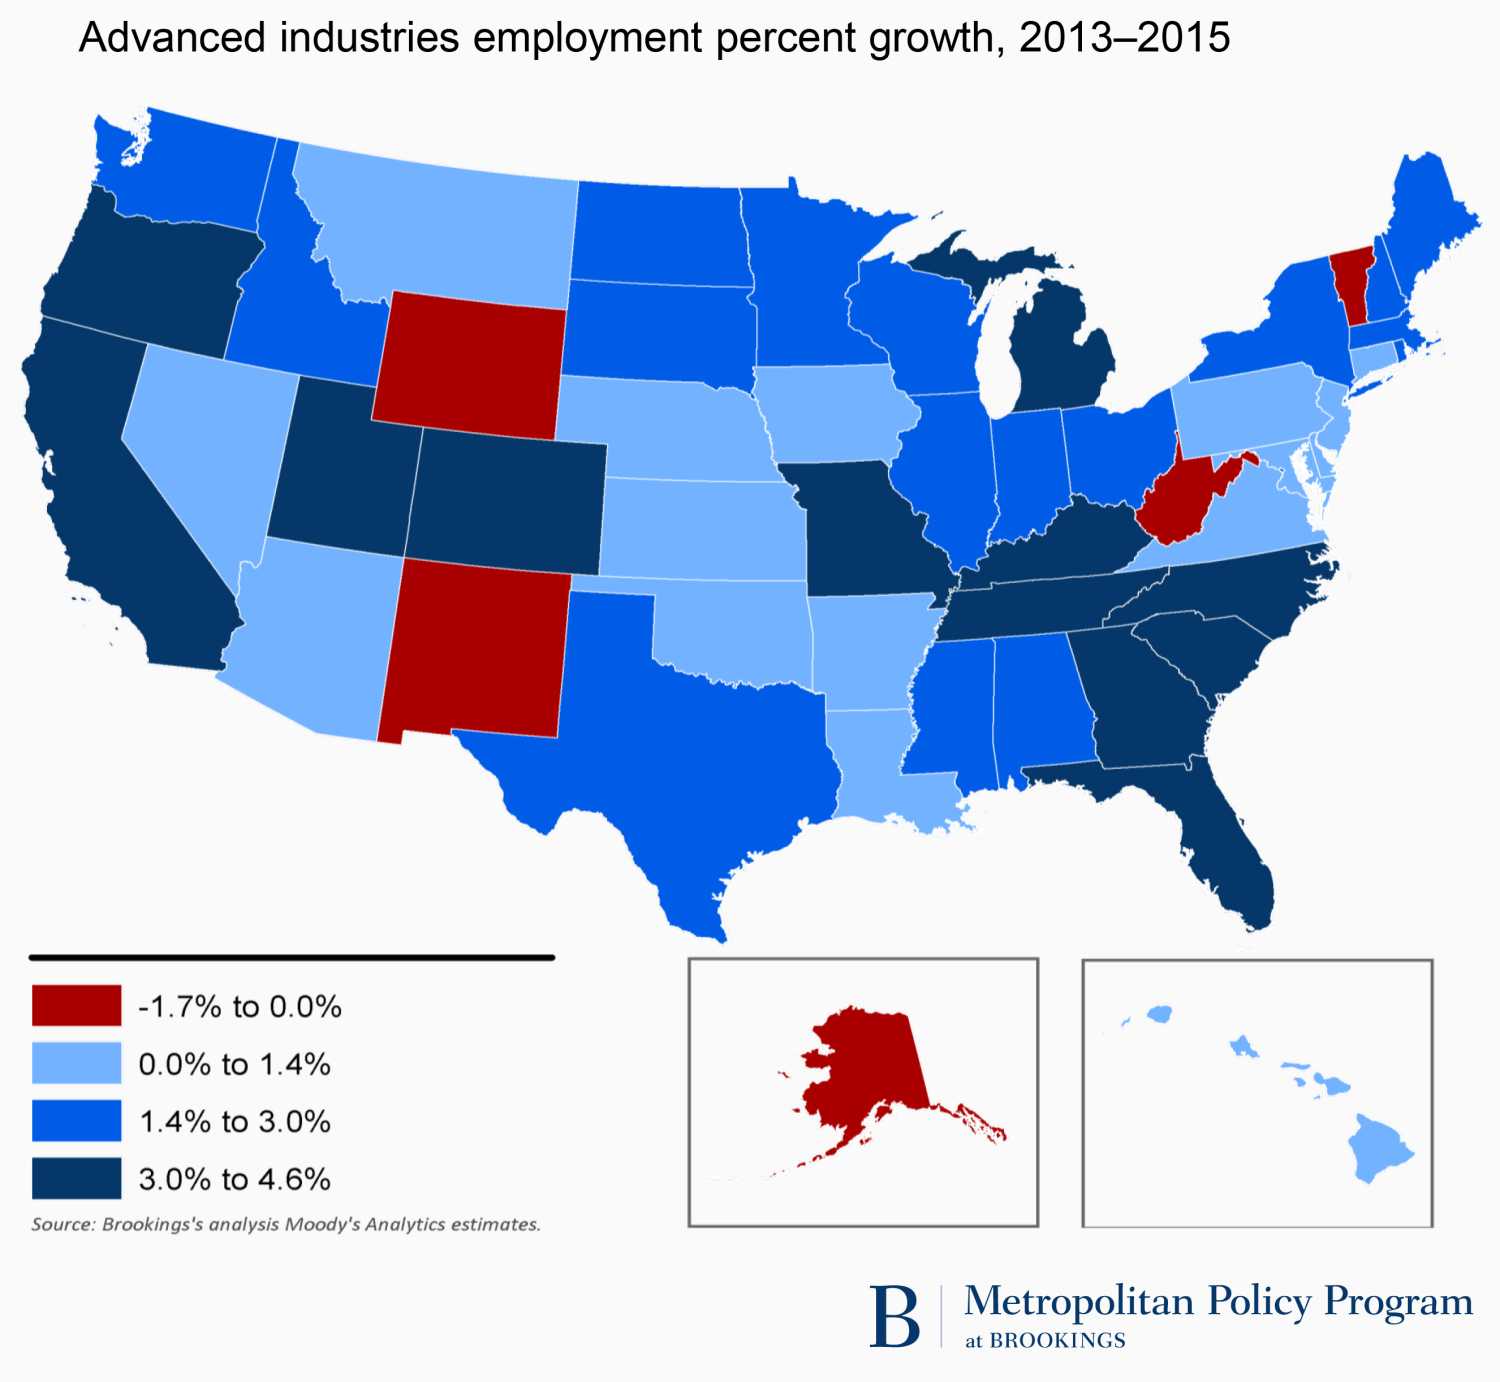
In keeping with that a wide portion of the country has continued to see growth in the sector. Between 2013 and 2015, all but seven states saw both output and employment expansions, as did 80 of the largest 100 metropolitan areas. Nonetheless, the shifting fortunes of the sector’s various industries are altering and, to an extent, narrowing the geography of advanced industries’ growth.
At the broadest level, the accelerated growth of high-tech services industries combined with the slowed or nonexistent growth in the advanced manufacturing and energy industries has shifted more growth to states in the West and Northeast (states traditionally strong in tech services).
Reflecting these trends, the locus of growth narrowed, as high-tech service industries emerged as the nation’s leading source of advanced industries’ growth between 2013 and 2015.
Altogether, the service subsector in advanced industries added 500,000 new jobs, or approximately 80 percent of the sector’s total growth between 2013 and 2015. That share was up from the subsector’s 64.5 percent share in the same period. By contrast, advanced manufacturing industries contributed just 132,000 jobs while advanced energy industries contributed none.
Looking across the entire sector, 29 of the 50 advanced industries saw both output and employment growth at once. Likewise, 16 of the 50 advanced industries saw output and employment growth accelerate.
Turning to the industry-specific components of growth, the surge of the services subsector between 2013 and 2015 had a strong digital orientation while auto industries kept the manufacturing subsector growing even as energy’s contributions disappeared.
High-tech advanced service industries dominated the growth trends between 2013 and 2015 amid a wave of excitement about new software-based opportunities in social media, sharing platforms, digital health and “fin-tech,” automation, the Internet of Things, and big data.[xii] Consequently, although nearly four-fifths of advanced-sector employment growth (480,000 jobs) from 2013 to 2015 emerged from the services subsector, nearly two-thirds of that growth (307,000 jobs) originated in just four fast-growing digital services: computer systems design; web search and internet publishing; software products; and data processing and hosting. Employment in all of these industries grew by 5 percent CAGR from 2013 to 2015, and three of the four accelerated their growth over the pace during 2010–2013. Management consulting, engineering, and R&D services also continued to add jobs and grow quickly. Overall, 9 of the 12 industries in the advanced services subsector picked up the pace of their output and job growth (or slowed job losses) in the recent period compared with the prior one.
At the same time, progress among advanced manufacturing industries slowed somewhat between 2013 and 2015 as the solid expansion following the recession (2010–2013) ran into headwinds. This slowdown reflected the combination of a strong dollar and a major slowing of global demand for U.S. commodity and machinery exports. These factors led to a significant slowing of output and employment growth in a variety of materials and machinery industries, ranging from iron and steel and aluminum products to agriculture, construction, mining machinery, and engine and power equipment. In this regard, although advanced manufacturing industries still managed to contribute more than 20 percent of advanced-sector employment growth (132,200 jobs) between 2013 and 2015, nearly 70 percent of that growth (95,000 jobs) originated in the three auto-related industries: motor vehicle parts, motor vehicles, and motor vehicle body and trailers. Several of these industries saw slower output growth, and output growth slowed in 18 of the 35 advanced manufacturing industries. Meanwhile, 9 of the 35 manufacturing industries lost jobs between 2013 and 2015 while 20 experienced slower employment growth between 2013 and 2015 than between 2010 and 2013. Nonetheless, output growth for the advanced manufacturing sector as a whole increased (owing to gains in petroleum, chemicals, pharmaceuticals, industrial machinery, appliances, and medical equipment) even as employment growth slowed.
Finally, the advanced energy industries group slumped as the U.S. “fracking” boom led to an oil and gas glut and energy demand stagnated worldwide. Given those trends, both the oil and gas extraction and mining industries saw precipitous output and employment growth slowdowns. Given these pull-backs, the energy subsector shifted from being a significant contributor to the nation’s advanced industries economy to a nonfactor.
Overall, slower hiring in advanced manufacturing and a recession in the energy sector left the nation’s advanced industries economy increasingly reliant in 2013–2015 on a narrowed growth base.
In contrast to the recovery years of 2010–2013, by 2013–2015 no less than one-half of the nation’s advanced industries’ employment growth was from a booming computer systems design industry and the three auto industries. With a few more digital services such as software and web search / internet publishing, just seven advanced industries in the digital services and auto domains generated two-thirds percent of the nation’s advanced sector growth between 2013 and 2015. That share was up from 55 percent in the previous three years. In short, the nation has grown more dependent on continued auto sector progress and a short list of rapidly growing high-tech services for output and employment growth.
3. U.S. advanced industries’ growth trends grew more uneven across the country between 2013 and 2015
Advanced industries remain widely dispersed across the United States. Every region, state, and metropolitan area contains at least a few thousand advanced sector jobs. Given that, most areas of the country have had a toehold in the sector.
In keeping with that a wide portion of the country has continued to see growth in the sector. Between 2013 and 2015, all but seven states saw both output and employment expansions, as did 80 of the largest 100 metropolitan areas. Nonetheless, the shifting fortunes of the sector’s various industries are altering and, to an extent, narrowing the geography of advanced industries’ growth.
At the broadest level, the accelerated growth of high-tech services industries combined with the slowed or nonexistent growth in the advanced manufacturing and energy industries has shifted more growth to states in the West and Northeast (states traditionally strong in tech services).
Along these lines, Northeastern and Western states captured larger shares of the nations’ 2013–2015 advanced sector growth than they did in the previous three years thanks in large part to their specializations in fast-growing high-tech services ranging from computer systems design to R&D. In the Northeast, for example, tech-intensive New York, Massachusetts, Rhode Island, Maine, New Hampshire, and Connecticut all saw significant quickening of their output and employment growth. Similarly, tech-oriented Western states, including Utah, Oregon, Colorado, California, and Idaho, also saw rapid, accelerating growth on both measures.
States in the Midwest and South experienced mixed trends, by contrast. Many saw a diminished pace of advanced sector growth, given slowing manufacturing growth and the energy contraction. Manufacturing-intensive Michigan continued to rank high on absolute employment and output measures but experienced a significant slowing of growth between 2013 and 2015. So did other manufacturing states such as Ohio, Indiana, Wisconsin, Illinois, and Iowa (although Indiana and Illinois saw quickened output growth, in a sign of underlying strength). Likewise, Midwestern “fracking” states like North Dakota and Oklahoma, saw significant losses of momentum on both employment and output. At the same time, slowing growth in numerous advanced manufacturing industries began to affect some, but not all, of the fast-growing states in the South. To be sure, no less than six of the fastest growing 10 advanced-sector states based on employment growth continued to lie south of the Mason-Dixon line in 2013–2015. However, four of those states (Tennessee, Georgia, South Carolina, and Kentucky) saw either their rapid job growth or solid output growth between 2010 and 2013 slow after 2013, thanks to slowing expansion in various advanced manufacturing industries, especially auto industries.
In short, the state growth map depicts an unsettled geography of momentum. Although advanced sector output accelerated across a healthy 33 states, only 20 states saw the pace of their advanced industries’ employment growth accelerate between 2010 and 2013. That means that 30 states saw employment growth slow, which adds to the many questions about the robustness of the nation’s overall advanced industries economy.
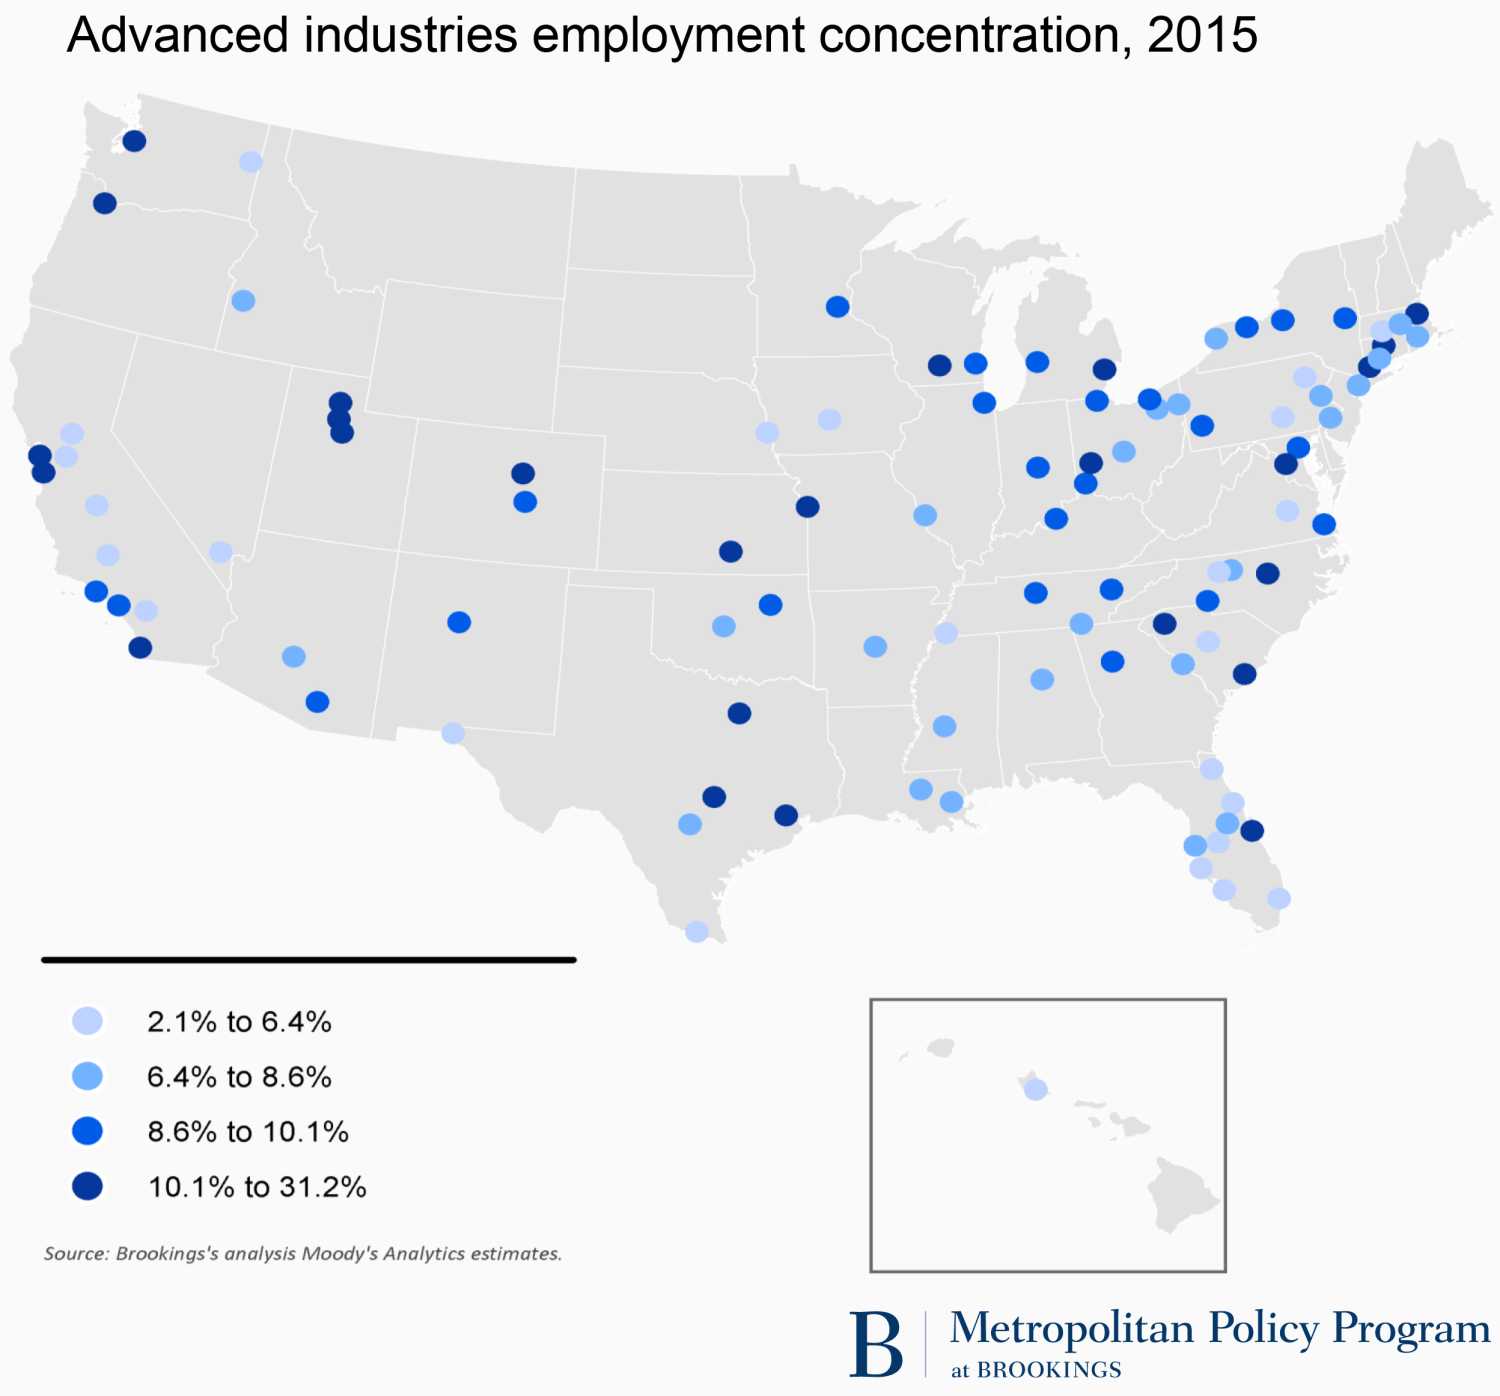
Turning to the metropolitan geography of the sector’s evolution, it remains important to note that advanced industries’ production takes place principally in metropolitan areas, where the universities, technology innovation assets, supply chains, STEM workers, and industry clusters on which the sector depends reside.[xiii] Altogether, the country’s 100 largest metropolitan areas contained 74 percent of all U.S. jobs in the advanced industries sector in 2015 while the country’s full list of 381 metropolitan areas contained 89 percent of those jobs. Large metropolitan areas contained at least four of five U.S. workers in 17 individual advanced industries, among them management and technical consulting services, data processing and hosting, and software publishing. Given these facts and the sector’s importance to prosperity, the distribution and nature of the sector’s growth in metro areas remain critical the economic health of the nation.
What do recent trends in the urban distribution of advanced sector growth say about the nation’s economic trajectory?
To start with, recent trends reflect the wide dispersal of advanced industries in metropolitan America. Many metros in many states and regions continued to maintain solid advanced industry enterprises as the national economic recovery settled into a “new normal” of economic performance between 2013 and 2015.
Reflecting these trends, the locus of growth narrowed, as high-tech service industries emerged as the nation’s leading source of advanced industries’ growth between 2013 and 2015.
Altogether, the service subsector in advanced industries added 500,000 new jobs, or approximately 80 percent of the sector’s total growth between 2013 and 2015. That share was up from the subsector’s 64.5 percent share in the same period. By contrast, advanced manufacturing industries contributed just 132,000 jobs while advanced energy industries contributed none.
Looking across the entire sector, 29 of the 50 advanced industries saw both output and employment growth at once. Likewise, 16 of the 50 advanced industries saw output and employment growth accelerate.
Turning to the industry-specific components of growth, the surge of the services subsector between 2013 and 2015 had a strong digital orientation while auto industries kept the manufacturing subsector growing even as energy’s contributions disappeared.
High-tech advanced service industries dominated the growth trends between 2013 and 2015 amid a wave of excitement about new software-based opportunities in social media, sharing platforms, digital health and “fin-tech,” automation, the Internet of Things, and big data.[xii] Consequently, although nearly four-fifths of advanced-sector employment growth (480,000 jobs) from 2013 to 2015 emerged from the services subsector, nearly two-thirds of that growth (307,000 jobs) originated in just four fast-growing digital services: computer systems design; web search and internet publishing; software products; and data processing and hosting. Employment in all of these industries grew by 5 percent CAGR from 2013 to 2015, and three of the four accelerated their growth over the pace during 2010–2013. Management consulting, engineering, and R&D services also continued to add jobs and grow quickly. Overall, 9 of the 12 industries in the advanced services subsector picked up the pace of their output and job growth (or slowed job losses) in the recent period compared with the prior one.
At the same time, progress among advanced manufacturing industries slowed somewhat between 2013 and 2015 as the solid expansion following the recession (2010–2013) ran into headwinds. This slowdown reflected the combination of a strong dollar and a major slowing of global demand for U.S. commodity and machinery exports. These factors led to a significant slowing of output and employment growth in a variety of materials and machinery industries, ranging from iron and steel and aluminum products to agriculture, construction, mining machinery, and engine and power equipment. In this regard, although advanced manufacturing industries still managed to contribute more than 20 percent of advanced-sector employment growth (132,200 jobs) between 2013 and 2015, nearly 70 percent of that growth (95,000 jobs) originated in the three auto-related industries: motor vehicle parts, motor vehicles, and motor vehicle body and trailers. Several of these industries saw slower output growth, and output growth slowed in 18 of the 35 advanced manufacturing industries. Meanwhile, 9 of the 35 manufacturing industries lost jobs between 2013 and 2015 while 20 experienced slower employment growth between 2013 and 2015 than between 2010 and 2013. Nonetheless, output growth for the advanced manufacturing sector as a whole increased (owing to gains in petroleum, chemicals, pharmaceuticals, industrial machinery, appliances, and medical equipment) even as employment growth slowed.
Finally, the advanced energy industries group slumped as the U.S. “fracking” boom led to an oil and gas glut and energy demand stagnated worldwide. Given those trends, both the oil and gas extraction and mining industries saw precipitous output and employment growth slowdowns. Given these pull-backs, the energy subsector shifted from being a significant contributor to the nation’s advanced industries economy to a nonfactor.
Overall, slower hiring in advanced manufacturing and a recession in the energy sector left the nation’s advanced industries economy increasingly reliant in 2013–2015 on a narrowed growth base.
In contrast to the recovery years of 2010–2013, by 2013–2015 no less than one-half of the nation’s advanced industries’ employment growth was from a booming computer systems design industry and the three auto industries. With a few more digital services such as software and web search / internet publishing, just seven advanced industries in the digital services and auto domains generated two-thirds percent of the nation’s advanced sector growth between 2013 and 2015. That share was up from 55 percent in the previous three years. In short, the nation has grown more dependent on continued auto sector progress and a short list of rapidly growing high-tech services for output and employment growth.
3. U.S. advanced industries’ growth trends grew more uneven across the country between 2013 and 2015
Advanced industries remain widely dispersed across the United States. Every region, state, and metropolitan area contains at least a few thousand advanced sector jobs. Given that, most areas of the country have had a toehold in the sector.
In keeping with that a wide portion of the country has continued to see growth in the sector. Between 2013 and 2015, all but seven states saw both output and employment expansions, as did 80 of the largest 100 metropolitan areas. Nonetheless, the shifting fortunes of the sector’s various industries are altering and, to an extent, narrowing the geography of advanced industries’ growth.
At the broadest level, the accelerated growth of high-tech services industries combined with the slowed or nonexistent growth in the advanced manufacturing and energy industries has shifted more growth to states in the West and Northeast (states traditionally strong in tech services).
Along these lines, Northeastern and Western states captured larger shares of the nations’ 2013–2015 advanced sector growth than they did in the previous three years thanks in large part to their specializations in fast-growing high-tech services ranging from computer systems design to R&D. In the Northeast, for example, tech-intensive New York, Massachusetts, Rhode Island, Maine, New Hampshire, and Connecticut all saw significant quickening of their output and employment growth. Similarly, tech-oriented Western states, including Utah, Oregon, Colorado, California, and Idaho, also saw rapid, accelerating growth on both measures.
States in the Midwest and South experienced mixed trends, by contrast. Many saw a diminished pace of advanced sector growth, given slowing manufacturing growth and the energy contraction. Manufacturing-intensive Michigan continued to rank high on absolute employment and output measures but experienced a significant slowing of growth between 2013 and 2015. So did other manufacturing states such as Ohio, Indiana, Wisconsin, Illinois, and Iowa (although Indiana and Illinois saw quickened output growth, in a sign of underlying strength). Likewise, Midwestern “fracking” states like North Dakota and Oklahoma, saw significant losses of momentum on both employment and output. At the same time, slowing growth in numerous advanced manufacturing industries began to affect some, but not all, of the fast-growing states in the South. To be sure, no less than six of the fastest growing 10 advanced-sector states based on employment growth continued to lie south of the Mason-Dixon line in 2013–2015. However, four of those states (Tennessee, Georgia, South Carolina, and Kentucky) saw either their rapid job growth or solid output growth between 2010 and 2013 slow after 2013, thanks to slowing expansion in various advanced manufacturing industries, especially auto industries.
In short, the state growth map depicts an unsettled geography of momentum. Although advanced sector output accelerated across a healthy 33 states, only 20 states saw the pace of their advanced industries’ employment growth accelerate between 2010 and 2013. That means that 30 states saw employment growth slow, which adds to the many questions about the robustness of the nation’s overall advanced industries economy.
Turning to the metropolitan geography of the sector’s evolution, it remains important to note that advanced industries’ production takes place principally in metropolitan areas, where the universities, technology innovation assets, supply chains, STEM workers, and industry clusters on which the sector depends reside.[xiii] Altogether, the country’s 100 largest metropolitan areas contained 74 percent of all U.S. jobs in the advanced industries sector in 2015 while the country’s full list of 381 metropolitan areas contained 89 percent of those jobs. Large metropolitan areas contained at least four of five U.S. workers in 17 individual advanced industries, among them management and technical consulting services, data processing and hosting, and software publishing. Given these facts and the sector’s importance to prosperity, the distribution and nature of the sector’s growth in metro areas remain critical the economic health of the nation.
What do recent trends in the urban distribution of advanced sector growth say about the nation’s economic trajectory?
To start with, recent trends reflect the wide dispersal of advanced industries in metropolitan America. Many metros in many states and regions continued to maintain solid advanced industry enterprises as the national economic recovery settled into a “new normal” of economic performance between 2013 and 2015.
In that regard, it bears noting that—as with the states—nearly all large metropolitan areas (80 of 100) enjoyed output and employment growth in advanced industries since 2013.
At the same time, though, the list of metro areas with strong momentum narrowed between 2013 and 2015—influenced again by changing trends in the industries. At the broadest level, while almost all large metro areas continued to grow on one or the other dimension of advanced industry growth, 59 saw either advanced sector output or employment growth slow between 2013 and 2015. Output growth slowed in 42 of these metropolitan areas; employment growth slowed in 49 of them.
Looking beyond the aggregate, meanwhile, the changing dynamics of industry-by-industry momentum reoriented the metro growth map as high-tech services rose, the automotive boom crested, and the energy crash set in.
To begin with, the nation’s decidedly mixed distribution of advanced economy growth in recent years means that some places boomed while others lost ground between 2013 and 2015. Some 18 large metropolitan areas generated advanced industries’ output gains of 5 percent CAGR in those years, while 16 metros delivered employment growth that fast. In Provo, Utah; San Francisco, Calif.; San Jose, Calif.; and Madison, Wisc., annual output growth topped 8 percent, while in Nashville, Tenn.; San Francisco; Jackson, Miss.; Cape Coral, Fla.; Kansas City, Mo.; and Raleigh, N.C., employment growth exceeded 7 percent a year. However, 10 metros saw their output contract and 15 shed jobs between 2013 and 2015. Output in Bakersfield, Calif. slumped by 10.9 percent while Bakersfield; Tucson, Ariz.; and New Haven, Conn., all shed more than 1.5 percent of their job bases.
Table 1. Fifteen Best-Performing Large Metro Areas by Employment Growth Rate, 2013–2015
| Output (in $ billions) | Employment | |||||||||
| 2010 | 2013 | 2015 | CAGR, 2010-2013 | CAGR, 2013-2015 | 2010 | 2013 | 2015 | CAGR, 2010-2013 | CAGR, 2013-2015 | |
| Nashville, Tenn. | $8.7 | $11.5 | $12.7 | 9.6% | 5.0% | 56,011 | 70,545 | 82,206 | 8.0% | 7.9% |
| San Francisco, Calif. | $65.3 | $74.1 | $88.1 | 4.3% | 9.0% | 255,585 | 298,646 | 347,802 | 5.3% | 7.9% |
| Jackson, Miss. | $2.3 | $2.4 | $2.6 | 1.2% | 4.6% | 14,945 | 16,204 | 18,756 | 2.7% | 7.6% |
| Cape Coral, Fla. | $1.3 | $1.5 | $1.6 | 4.9% | 2.6% | 7,098 | 8,800 | 10,184 | 7.4% | 7.6% |
| Kansas City, Mo./Kan. | $13.3 | $13.7 | $15.2 | 0.9% | 5.4% | 86,447 | 95,090 | 109,208 | 3.2% | 7.2% |
| Raleigh, N.C. | $11.7 | $12.9 | $15.3 | 3.3% | 9.0% | 55,010 | 64,545 | 73,881 | 5.5% | 7.0% |
| Charlotte, N.C./S.C. | $15.8 | $18.6 | $20.1 | 5.6% | 3.8% | 81,916 | 93,213 | 106,203 | 4.4% | 6.7% |
| Memphis, Tenn./Miss./Ark. | $4.8 | $5.3 | $5.9 | 3.3% | 5.6% | 29,095 | 31,792 | 35,955 | 3.0% | 6.3% |
| Toledo, Ohio | $4.5 | $5.3 | $5.8 | 5.6% | 4.9% | 22,593 | 27,795 | 31,427 | 7.2% | 6.3% |
| Provo, Utah | $3.4 | $3.6 | $4.3 | 1.4% | 9.8% | 21,064 | 24,945 | 28,195 | 5.8% | 6.3% |
| Madison, Wisc. | $5.4 | $6.3 | $7.3 | 4.9% | 8.1% | 34,215 | 39,257 | 44,143 | 4.7% | 6.0% |
| Austin, Texas | $20.5 | $24.2 | $28.1 | 5.7% | 7.8% | 94,333 | 113,534 | 127,514 | 6.4% | 6.0% |
| San Jose, Calif. | $56.9 | $74.8 | $87.8 | 9.5% | 8.3% | 260,441 | 293,743 | 329,409 | 4.1% | 5.9% |
| Grand Rapids, Mich. | $6.3 | $8.2 | $8.8 | 9.1% | 4.2% | 37,714 | 46,817 | 52,154 | 7.5% | 5.5% |
| McAllen, Texas | $1.2 | $1.6 | $1.8 | 11.2% | 5.4% | 4,495 | 4,903 | 5,450 | 2.9% | 5.4% |
|
CAGR = Compound Annual Growth Rate Source: Brookings’s analysis of Moody’s Analytics estimates. |
||||||||||
Variations of the local industry mix lie behind much of the unevenness of the metro growth map.
Accentuating the continued growth of the nation’s production subsector, the 26 metropolitan areas especially oriented toward advanced manufacturing saw their aggregate advanced industries’ output grow at a steady 2.17 percent CAGR between 2013 and 2015 (compared with 0.88 percent between 2010 and 2013) while employment growth doubled to 3.38 percent.[xiv] This group of advanced manufacturing-oriented metros ranges from the highly specialized Wichita, Kan.; Toledo, Ohio; and Grand Rapids, Mich.; to Ogden, Utah; Boise, Idaho; and Providence, R.I. Fourteen of these 26 metro areas saw the pace of their output growth increase, and a slightly different 14 saw the pace of their employment growth pick up.
And yet, the aggregate performance of the manufacturing metro areas masked varied local growth stories influenced by particular industry dynamics. Auto-focused metros such as Nashville, Tenn.; Jackson, Miss.; Grand Rapids, Mich.; and Toledo, Ohio, continued to enjoy rapid growth in output and employment, albeit with some slowing. Meanwhile, manufacturing regions with other production specializations saw gains. Indianapolis, Ind.; Worcester, Mass.; Ogden, Utah; and Boise, Idaho, all saw significant output and employment growth acceleration driven at least in part by their diverse specializations in auto parts and medical equipment, pharmaceuticals, precision instruments, aircraft parts, or semiconductors. By contrast, three manufacturing-focused metros saw their output shrink between 2013 and 2015 while five experienced employment losses. These losses are largely the result of contractions in specific advanced manufacturing industries in which these metros are highly specialized: chemical products manufacturing in Rochester, N.Y., and Oxnard, Calif., and iron and steel production in Cleveland, Ohio.
For their part, a smaller group of 11 advanced energy-focused metros had a more sharply divided experience.[xv] These metros either specialize in oil and gas extraction (Oklahoma City, Okla.; Bakersfield, Calif.; Tulsa, Okla.; and New Orleans, La.) or host large power-generation plants (Birmingham, Ala.; Columbia, S.C.; Syracuse, N.Y.; Augusta, Ga.; Little Rock, Ark.; and Scranton, Penn.)—and performed accordingly. The oil and gas regions absorbed an abrupt slowing of job growth, reflecting rapid layoffs in fracking locations, while metro areas with power plants tended to bump along with more mixed outcomes. As a group, these metro areas saw below-average output growth of 1.3 percent CAGR between 2013 and 2015 and negligible employment growth.
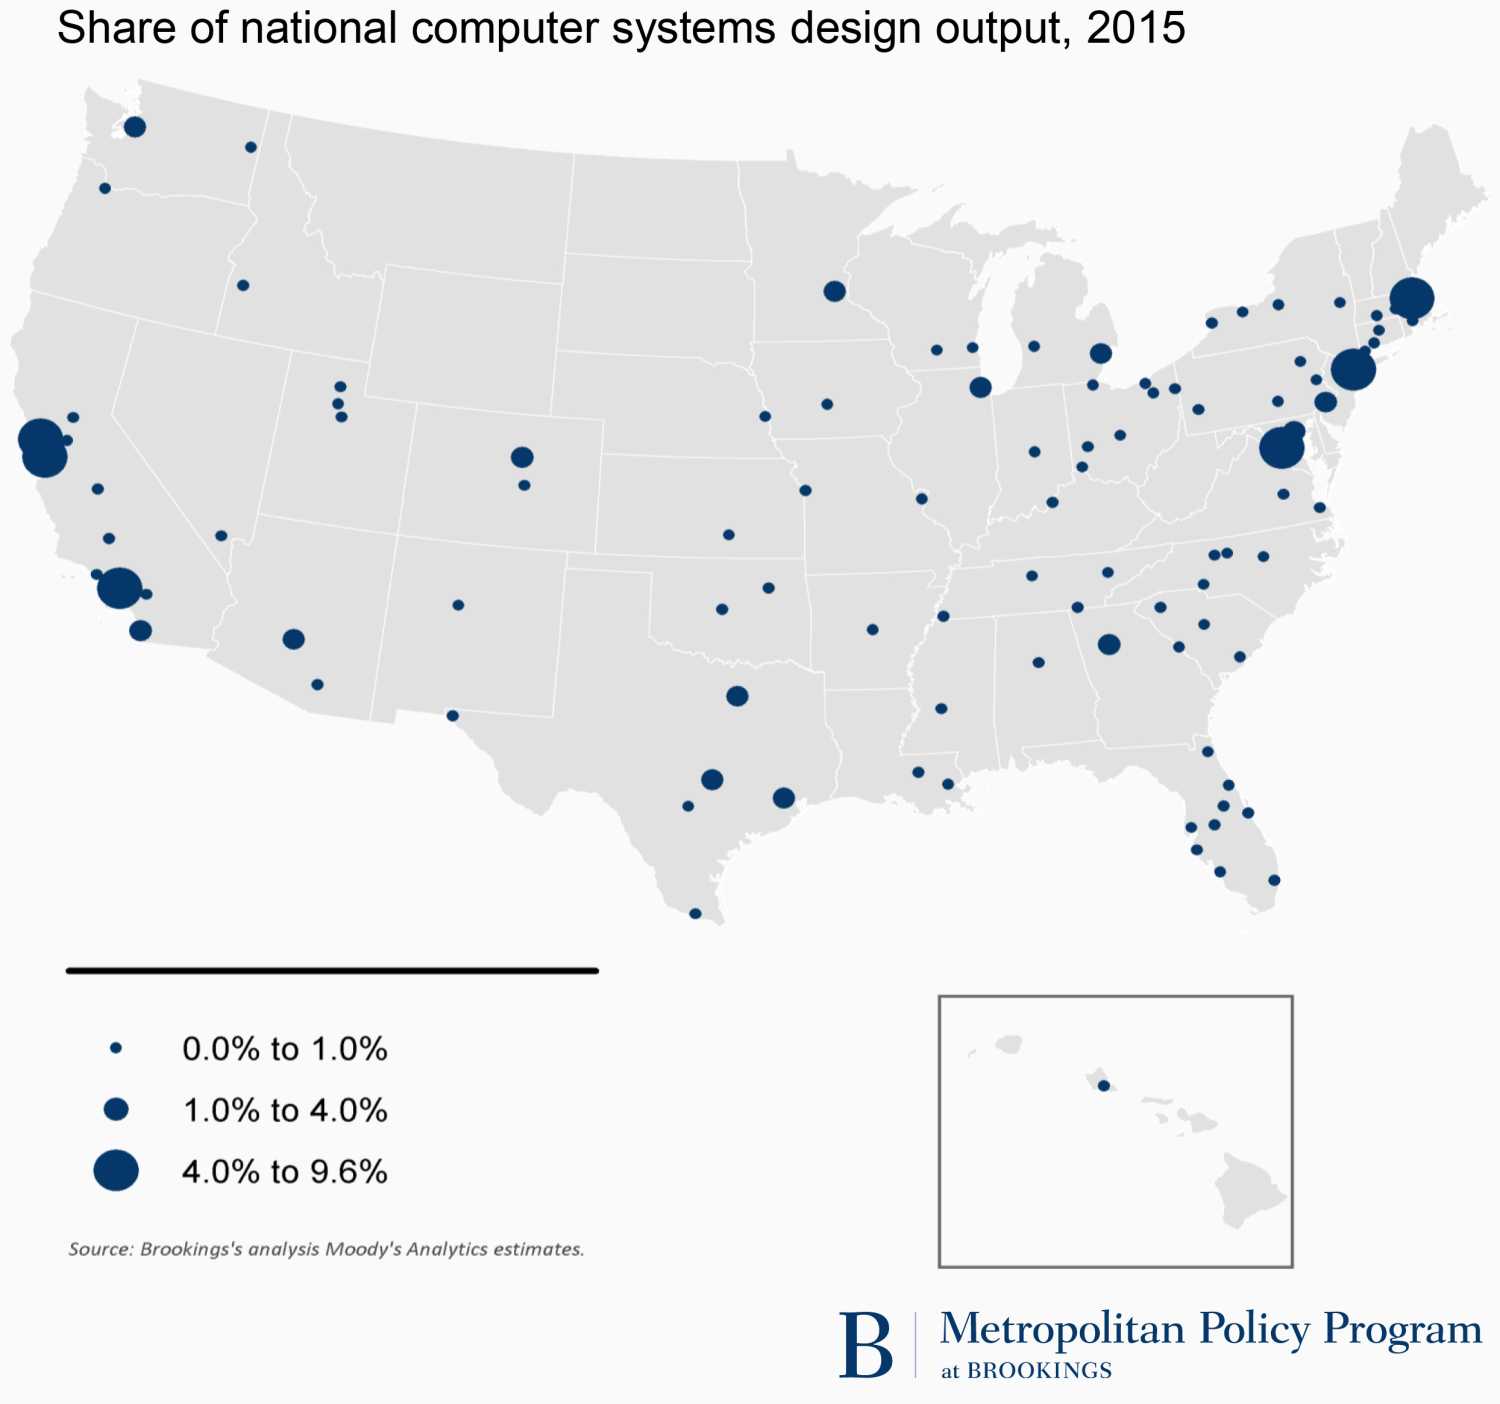
By contrast, and not surprisingly, the 15 metropolitan areas oriented toward advanced services surged.[xvi] Ranging from San Francisco, Calif.; Kansas City, Mo.; and Raleigh, N.C., to Provo, Utah; Boston, Mass.; New York, N.Y.; Washington, D.C.; and Philadelphia, Penn., these metros profited from rapid services growth. Advanced industries’ output grew solidly in 14 of the 15 metros and was accelerating in 13 of them. All the metros saw employment grow, sometimes rapidly, and in 11 places, employment growth accelerated. What was driving the growth? In 12 of the 15 locations, computer systems design was the largest advanced industry and the largest source of new advanced industry jobs, although software, web hosting, and data processing figured in places like Provo, Raleigh, and Atlanta. Accordingly, growth was rapid in these locations. Advanced sector output exceeded 9 percent CAGR in Provo, Raleigh, and San Francisco, while annual employment growth topped 3 percent in eight of these metro areas. Of these service-oriented metros, only Albuquerque, N.M., saw shrinking output. Overall, output growth nearly tripled, to 4 percent CAGR between 2013 and 2015, and employment growth nearly doubled, to 3.7 percent.
HIGHLIGHT: The Computer Systems Design Economy IS Not So Narrow After All
Reflecting these trends, the locus of growth narrowed, as high-tech service industries emerged as the nation’s leading source of advanced industries’ growth between 2013 and 2015.
Altogether, the service subsector in advanced industries added 500,000 new jobs, or approximately 80 percent of the sector’s total growth between 2013 and 2015. That share was up from the subsector’s 64.5 percent share in the same period. By contrast, advanced manufacturing industries contributed just 132,000 jobs while advanced energy industries contributed none.
Looking across the entire sector, 29 of the 50 advanced industries saw both output and employment growth at once. Likewise, 16 of the 50 advanced industries saw output and employment growth accelerate.
Turning to the industry-specific components of growth, the surge of the services subsector between 2013 and 2015 had a strong digital orientation while auto industries kept the manufacturing subsector growing even as energy’s contributions disappeared.
High-tech advanced service industries dominated the growth trends between 2013 and 2015 amid a wave of excitement about new software-based opportunities in social media, sharing platforms, digital health and “fin-tech,” automation, the Internet of Things, and big data.[xii] Consequently, although nearly four-fifths of advanced-sector employment growth (480,000 jobs) from 2013 to 2015 emerged from the services subsector, nearly two-thirds of that growth (307,000 jobs) originated in just four fast-growing digital services: computer systems design; web search and internet publishing; software products; and data processing and hosting. Employment in all of these industries grew by 5 percent CAGR from 2013 to 2015, and three of the four accelerated their growth over the pace during 2010–2013. Management consulting, engineering, and R&D services also continued to add jobs and grow quickly. Overall, 9 of the 12 industries in the advanced services subsector picked up the pace of their output and job growth (or slowed job losses) in the recent period compared with the prior one.
At the same time, progress among advanced manufacturing industries slowed somewhat between 2013 and 2015 as the solid expansion following the recession (2010–2013) ran into headwinds. This slowdown reflected the combination of a strong dollar and a major slowing of global demand for U.S. commodity and machinery exports. These factors led to a significant slowing of output and employment growth in a variety of materials and machinery industries, ranging from iron and steel and aluminum products to agriculture, construction, mining machinery, and engine and power equipment. In this regard, although advanced manufacturing industries still managed to contribute more than 20 percent of advanced-sector employment growth (132,200 jobs) between 2013 and 2015, nearly 70 percent of that growth (95,000 jobs) originated in the three auto-related industries: motor vehicle parts, motor vehicles, and motor vehicle body and trailers. Several of these industries saw slower output growth, and output growth slowed in 18 of the 35 advanced manufacturing industries. Meanwhile, 9 of the 35 manufacturing industries lost jobs between 2013 and 2015 while 20 experienced slower employment growth between 2013 and 2015 than between 2010 and 2013. Nonetheless, output growth for the advanced manufacturing sector as a whole increased (owing to gains in petroleum, chemicals, pharmaceuticals, industrial machinery, appliances, and medical equipment) even as employment growth slowed.
Finally, the advanced energy industries group slumped as the U.S. “fracking” boom led to an oil and gas glut and energy demand stagnated worldwide. Given those trends, both the oil and gas extraction and mining industries saw precipitous output and employment growth slowdowns. Given these pull-backs, the energy subsector shifted from being a significant contributor to the nation’s advanced industries economy to a nonfactor.
Overall, slower hiring in advanced manufacturing and a recession in the energy sector left the nation’s advanced industries economy increasingly reliant in 2013–2015 on a narrowed growth base.
In contrast to the recovery years of 2010–2013, by 2013–2015 no less than one-half of the nation’s advanced industries’ employment growth was from a booming computer systems design industry and the three auto industries. With a few more digital services such as software and web search / internet publishing, just seven advanced industries in the digital services and auto domains generated two-thirds percent of the nation’s advanced sector growth between 2013 and 2015. That share was up from 55 percent in the previous three years. In short, the nation has grown more dependent on continued auto sector progress and a short list of rapidly growing high-tech services for output and employment growth.
3. U.S. advanced industries’ growth trends grew more uneven across the country between 2013 and 2015
Advanced industries remain widely dispersed across the United States. Every region, state, and metropolitan area contains at least a few thousand advanced sector jobs. Given that, most areas of the country have had a toehold in the sector.
In keeping with that a wide portion of the country has continued to see growth in the sector. Between 2013 and 2015, all but seven states saw both output and employment expansions, as did 80 of the largest 100 metropolitan areas. Nonetheless, the shifting fortunes of the sector’s various industries are altering and, to an extent, narrowing the geography of advanced industries’ growth.
At the broadest level, the accelerated growth of high-tech services industries combined with the slowed or nonexistent growth in the advanced manufacturing and energy industries has shifted more growth to states in the West and Northeast (states traditionally strong in tech services).
Along these lines, Northeastern and Western states captured larger shares of the nations’ 2013–2015 advanced sector growth than they did in the previous three years thanks in large part to their specializations in fast-growing high-tech services ranging from computer systems design to R&D. In the Northeast, for example, tech-intensive New York, Massachusetts, Rhode Island, Maine, New Hampshire, and Connecticut all saw significant quickening of their output and employment growth. Similarly, tech-oriented Western states, including Utah, Oregon, Colorado, California, and Idaho, also saw rapid, accelerating growth on both measures.
States in the Midwest and South experienced mixed trends, by contrast. Many saw a diminished pace of advanced sector growth, given slowing manufacturing growth and the energy contraction. Manufacturing-intensive Michigan continued to rank high on absolute employment and output measures but experienced a significant slowing of growth between 2013 and 2015. So did other manufacturing states such as Ohio, Indiana, Wisconsin, Illinois, and Iowa (although Indiana and Illinois saw quickened output growth, in a sign of underlying strength). Likewise, Midwestern “fracking” states like North Dakota and Oklahoma, saw significant losses of momentum on both employment and output. At the same time, slowing growth in numerous advanced manufacturing industries began to affect some, but not all, of the fast-growing states in the South. To be sure, no less than six of the fastest growing 10 advanced-sector states based on employment growth continued to lie south of the Mason-Dixon line in 2013–2015. However, four of those states (Tennessee, Georgia, South Carolina, and Kentucky) saw either their rapid job growth or solid output growth between 2010 and 2013 slow after 2013, thanks to slowing expansion in various advanced manufacturing industries, especially auto industries.
In short, the state growth map depicts an unsettled geography of momentum. Although advanced sector output accelerated across a healthy 33 states, only 20 states saw the pace of their advanced industries’ employment growth accelerate between 2010 and 2013. That means that 30 states saw employment growth slow, which adds to the many questions about the robustness of the nation’s overall advanced industries economy.
Turning to the metropolitan geography of the sector’s evolution, it remains important to note that advanced industries’ production takes place principally in metropolitan areas, where the universities, technology innovation assets, supply chains, STEM workers, and industry clusters on which the sector depends reside.[xiii] Altogether, the country’s 100 largest metropolitan areas contained 74 percent of all U.S. jobs in the advanced industries sector in 2015 while the country’s full list of 381 metropolitan areas contained 89 percent of those jobs. Large metropolitan areas contained at least four of five U.S. workers in 17 individual advanced industries, among them management and technical consulting services, data processing and hosting, and software publishing. Given these facts and the sector’s importance to prosperity, the distribution and nature of the sector’s growth in metro areas remain critical the economic health of the nation.
What do recent trends in the urban distribution of advanced sector growth say about the nation’s economic trajectory?
To start with, recent trends reflect the wide dispersal of advanced industries in metropolitan America. Many metros in many states and regions continued to maintain solid advanced industry enterprises as the national economic recovery settled into a “new normal” of economic performance between 2013 and 2015.
In that regard, it bears noting that—as with the states—nearly all large metropolitan areas (80 of 100) enjoyed output and employment growth in advanced industries since 2013.
At the same time, though, the list of metro areas with strong momentum narrowed between 2013 and 2015—influenced again by changing trends in the industries. At the broadest level, while almost all large metro areas continued to grow on one or the other dimension of advanced industry growth, 59 saw either advanced sector output or employment growth slow between 2013 and 2015. Output growth slowed in 42 of these metropolitan areas; employment growth slowed in 49 of them.
Looking beyond the aggregate, meanwhile, the changing dynamics of industry-by-industry momentum reoriented the metro growth map as high-tech services rose, the automotive boom crested, and the energy crash set in.
To begin with, the nation’s decidedly mixed distribution of advanced economy growth in recent years means that some places boomed while others lost ground between 2013 and 2015. Some 18 large metropolitan areas generated advanced industries’ output gains of 5 percent CAGR in those years, while 16 metros delivered employment growth that fast. In Provo, Utah; San Francisco, Calif.; San Jose, Calif.; and Madison, Wisc., annual output growth topped 8 percent, while in Nashville, Tenn.; San Francisco; Jackson, Miss.; Cape Coral, Fla.; Kansas City, Mo.; and Raleigh, N.C., employment growth exceeded 7 percent a year. However, 10 metros saw their output contract and 15 shed jobs between 2013 and 2015. Output in Bakersfield, Calif. slumped by 10.9 percent while Bakersfield; Tucson, Ariz.; and New Haven, Conn., all shed more than 1.5 percent of their job bases.
Table 1. Fifteen Best-Performing Large Metro Areas by Employment Growth Rate, 2013–2015
| Output (in $ billions) | Employment | |||||||||
| 2010 | 2013 | 2015 | CAGR, 2010-2013 | CAGR, 2013-2015 | 2010 | 2013 | 2015 | CAGR, 2010-2013 | CAGR, 2013-2015 | |
| Nashville, Tenn. | $8.7 | $11.5 | $12.7 | 9.6% | 5.0% | 56,011 | 70,545 | 82,206 | 8.0% | 7.9% |
| San Francisco, Calif. | $65.3 | $74.1 | $88.1 | 4.3% | 9.0% | 255,585 | 298,646 | 347,802 | 5.3% | 7.9% |
| Jackson, Miss. | $2.3 | $2.4 | $2.6 | 1.2% | 4.6% | 14,945 | 16,204 | 18,756 | 2.7% | 7.6% |
| Cape Coral, Fla. | $1.3 | $1.5 | $1.6 | 4.9% | 2.6% | 7,098 | 8,800 | 10,184 | 7.4% | 7.6% |
| Kansas City, Mo./Kan. | $13.3 | $13.7 | $15.2 | 0.9% | 5.4% | 86,447 | 95,090 | 109,208 | 3.2% | 7.2% |
| Raleigh, N.C. | $11.7 | $12.9 | $15.3 | 3.3% | 9.0% | 55,010 | 64,545 | 73,881 | 5.5% | 7.0% |
| Charlotte, N.C./S.C. | $15.8 | $18.6 | $20.1 | 5.6% | 3.8% | 81,916 | 93,213 | 106,203 | 4.4% | 6.7% |
| Memphis, Tenn./Miss./Ark. | $4.8 | $5.3 | $5.9 | 3.3% | 5.6% | 29,095 | 31,792 | 35,955 | 3.0% | 6.3% |
| Toledo, Ohio | $4.5 | $5.3 | $5.8 | 5.6% | 4.9% | 22,593 | 27,795 | 31,427 | 7.2% | 6.3% |
| Provo, Utah | $3.4 | $3.6 | $4.3 | 1.4% | 9.8% | 21,064 | 24,945 | 28,195 | 5.8% | 6.3% |
| Madison, Wisc. | $5.4 | $6.3 | $7.3 | 4.9% | 8.1% | 34,215 | 39,257 | 44,143 | 4.7% | 6.0% |
| Austin, Texas | $20.5 | $24.2 | $28.1 | 5.7% | 7.8% | 94,333 | 113,534 | 127,514 | 6.4% | 6.0% |
| San Jose, Calif. | $56.9 | $74.8 | $87.8 | 9.5% | 8.3% | 260,441 | 293,743 | 329,409 | 4.1% | 5.9% |
| Grand Rapids, Mich. | $6.3 | $8.2 | $8.8 | 9.1% | 4.2% | 37,714 | 46,817 | 52,154 | 7.5% | 5.5% |
| McAllen, Texas | $1.2 | $1.6 | $1.8 | 11.2% | 5.4% | 4,495 | 4,903 | 5,450 | 2.9% | 5.4% |
|
CAGR = Compound Annual Growth Rate Source: Brookings’s analysis of Moody’s Analytics estimates. |
||||||||||
Variations of the local industry mix lie behind much of the unevenness of the metro growth map.
Accentuating the continued growth of the nation’s production subsector, the 26 metropolitan areas especially oriented toward advanced manufacturing saw their aggregate advanced industries’ output grow at a steady 2.17 percent CAGR between 2013 and 2015 (compared with 0.88 percent between 2010 and 2013) while employment growth doubled to 3.38 percent.[xiv] This group of advanced manufacturing-oriented metros ranges from the highly specialized Wichita, Kan.; Toledo, Ohio; and Grand Rapids, Mich.; to Ogden, Utah; Boise, Idaho; and Providence, R.I. Fourteen of these 26 metro areas saw the pace of their output growth increase, and a slightly different 14 saw the pace of their employment growth pick up.
And yet, the aggregate performance of the manufacturing metro areas masked varied local growth stories influenced by particular industry dynamics. Auto-focused metros such as Nashville, Tenn.; Jackson, Miss.; Grand Rapids, Mich.; and Toledo, Ohio, continued to enjoy rapid growth in output and employment, albeit with some slowing. Meanwhile, manufacturing regions with other production specializations saw gains. Indianapolis, Ind.; Worcester, Mass.; Ogden, Utah; and Boise, Idaho, all saw significant output and employment growth acceleration driven at least in part by their diverse specializations in auto parts and medical equipment, pharmaceuticals, precision instruments, aircraft parts, or semiconductors. By contrast, three manufacturing-focused metros saw their output shrink between 2013 and 2015 while five experienced employment losses. These losses are largely the result of contractions in specific advanced manufacturing industries in which these metros are highly specialized: chemical products manufacturing in Rochester, N.Y., and Oxnard, Calif., and iron and steel production in Cleveland, Ohio.
For their part, a smaller group of 11 advanced energy-focused metros had a more sharply divided experience.[xv] These metros either specialize in oil and gas extraction (Oklahoma City, Okla.; Bakersfield, Calif.; Tulsa, Okla.; and New Orleans, La.) or host large power-generation plants (Birmingham, Ala.; Columbia, S.C.; Syracuse, N.Y.; Augusta, Ga.; Little Rock, Ark.; and Scranton, Penn.)—and performed accordingly. The oil and gas regions absorbed an abrupt slowing of job growth, reflecting rapid layoffs in fracking locations, while metro areas with power plants tended to bump along with more mixed outcomes. As a group, these metro areas saw below-average output growth of 1.3 percent CAGR between 2013 and 2015 and negligible employment growth.
By contrast, and not surprisingly, the 15 metropolitan areas oriented toward advanced services surged.[xvi] Ranging from San Francisco, Calif.; Kansas City, Mo.; and Raleigh, N.C., to Provo, Utah; Boston, Mass.; New York, N.Y.; Washington, D.C.; and Philadelphia, Penn., these metros profited from rapid services growth. Advanced industries’ output grew solidly in 14 of the 15 metros and was accelerating in 13 of them. All the metros saw employment grow, sometimes rapidly, and in 11 places, employment growth accelerated. What was driving the growth? In 12 of the 15 locations, computer systems design was the largest advanced industry and the largest source of new advanced industry jobs, although software, web hosting, and data processing figured in places like Provo, Raleigh, and Atlanta. Accordingly, growth was rapid in these locations. Advanced sector output exceeded 9 percent CAGR in Provo, Raleigh, and San Francisco, while annual employment growth topped 3 percent in eight of these metro areas. Of these service-oriented metros, only Albuquerque, N.M., saw shrinking output. Overall, output growth nearly tripled, to 4 percent CAGR between 2013 and 2015, and employment growth nearly doubled, to 3.7 percent.
HIGHLIGHT: The Computer Systems Design Economy IS Not So Narrow After All
The clear star of the advanced economy growth story in 2013–2015 is the computer systems design industry (NAICS 5415), and its effects turn out to be wider than might be expected.
In the conventional wisdom, the “tech” industry is believed to be important but highly concentrated in a short list of coastal tech hubs such as San Francisco and Boston and not heavily associated with “regular America.” However, the present analysis makes clear that the industry—which focuses on software development, system design, and consulting to support enterprise computer systems—is larger and broader than may be understood.
Not only did the industry generate nearly one-third (198,000) of the entire advanced sector’s job creation between 2013 and 2015, but its geographical reach extended far beyond the conventionally assumed “tech” geography. To be sure, nearly 38 percent of the industry’s 2015 national employment is concentrated in just six metro areas—Washington, D.C.; New York, N.Y.; San Francisco, Calif.; San Jose, Calif.; Boston, Mass.; and Los Angeles, Calif.—that also receive more than 70 percent of national IT-industries venture capital. These six locations would seem to be the industry’s core “creative hubs”—and the ones most oriented to earlier-stage invention. However, what is striking is the geographical breadth of the computer systems design industry. No less than 71 of the nation’s largest metros, ranging from Jacksonville, Fla., to Spokane, Wash., feature computer systems design as one of its largest three sources of advanced industries’ employment and growth. This broad array of metros would seem to reflect less the creative side of the industry than its applications side. These “installation” metros are likely places where the industry is busy deploying technologies and systems designed in the creative hubs. As such, this less glamorous majority of the industry is likely occupied with the crucial work of technology “diffusion”—installing technologies and practices that will improve the productivity of relatively stagnant industries beyond the more famous technology hubs.
In short, the high-tech services economy turns out to be less narrow than the VC-fueled stories emanating from the coastal tech centers suggests. Computer systems design by itself is providing thousands of jobs in hundreds of places in Main Street America.
Finally, two groups of metro areas have relatively balanced assortments of advanced industries. One of these groups encompasses 27 metro areas that lack any subsectoral specialization. Most of these metro areas have thin advanced industries bases and exhibit decidedly mixed performance as a group. The gains and losses of some of these metros likely reflect the impacts of “one-off” establishment expansions, downsizing, locations, or departures in “thin” advanced sector regions. Although Memphis, Tenn.—driven by the expansion of advanced services such as engineering, medical equipment, and management consulting—experienced some of the strongest employment and output growth of all large metros, advanced industries in Fresno, Calif., and New Haven, Conn., contracted by both measures, hard hit by the performance downturn in the advanced manufacturing and energy subsectors. In aggregate, output growth for the group with no specialization was slightly below the U.S. average of 2.7 percent CAGR, and employment growth was slightly above average at approximately 3 percent CAGR. Among these metros, output was declining in 12 metros between 2013 and 2015 and employment was declining in 14.
Turning to the other group of balanced metros, 22 metros are specialized in two or more sub-sectors—often manufacturing and services. [xvii] Such diverse and broadly concentrated regions turn out to be some of the most fortunate in the advanced sector growth tables. Reflecting their strong engagement in multiple types of enterprises, this group of metros maintained a very strong aggregate output rate of 4.55 percent CAGR between 2013 and 2015 and also saw employment growth accelerate from 2.5 in 2013 to a fast 4 percent in 2015. None of these balanced metros saw output decline, and only one—Bridgeport, Conn.—had shrinking employment. By the same token, output in 13 of these metros accelerated, and 10 metros charted faster employment growth. These balanced metros include some of the advanced industries sector’s growth stars. Madison, Wisc.—with above-average concentrations of employment in 13 advanced manufacturing industries and three services—saw its output surge from 4.95 percent CAGR between 2010 and 2013 to more than 8 percent CAGR as annual employment growth hit 6 percent. Austin, Texas—with considerable specialization in five manufacturing industries and five services—turned in similar numbers. And although output growth slowed slightly to a still-torrid 8 percent CAGR in San Jose, Calif., employment growth there accelerated to nearly 6 percent annually. San Jose specializes in 19 different advanced industries—including 11 manufacturing industries and 8 services—ranging from computer equipment and semiconductors to computer systems design, web search and internet publishing, and R&D. Elsewhere, semiconductor manufacturing and software gains fueled large output growth in Portland, Ore., while Boston, Mass., benefited from accelerating gains in software, pharmaceuticals, and medical devices.
Metros like these with broad, deep, and varied technology specializations rank among the nation’s most favored regional economies. Not only do they profit now from diverse advanced activities, but they may gain for years to come from the productive convergence and hybridization of diverse technologies.
Which prospect points to the question of metro areas’ longer-term progress in building dense, highly productive advanced industries sectors. Ultimately, metro areas that increase the share of their output and employment derived from advanced industries will improve their ability to increase their region’s productivity, increase the average wage, and improve the regional standard of living.
So what do the new data on advanced industries say about large metro areas’ progress in increasing their specialization in advanced industries and increasing their local productivity? Looking first at advanced sector specialization, 47 large metropolitan areas (just under one-half of regions) managed to increase the share of their output derived from advanced industries between 2010 and 2015. These metros include San Jose, Calif.; Detroit, Mich.; Madison, Wisc.; Grand Rapids, Mich.; Raleigh, N.C.; San Francisco, Calif.; Nashville, Tenn.; Boston, Mass.; and Seattle, Wash.—all of which increased the share of total output attributed to advanced industries by more than 2 percent without a heavy reliance on the recent energy boom. Most of these metros plus Louisville, Ky., Kansas City, Mo.; and Austin, Texas, also saw the share of their employment in advanced industries rise by more than 1 percent. These metros are making solid progress in assembling a robust advanced economy.
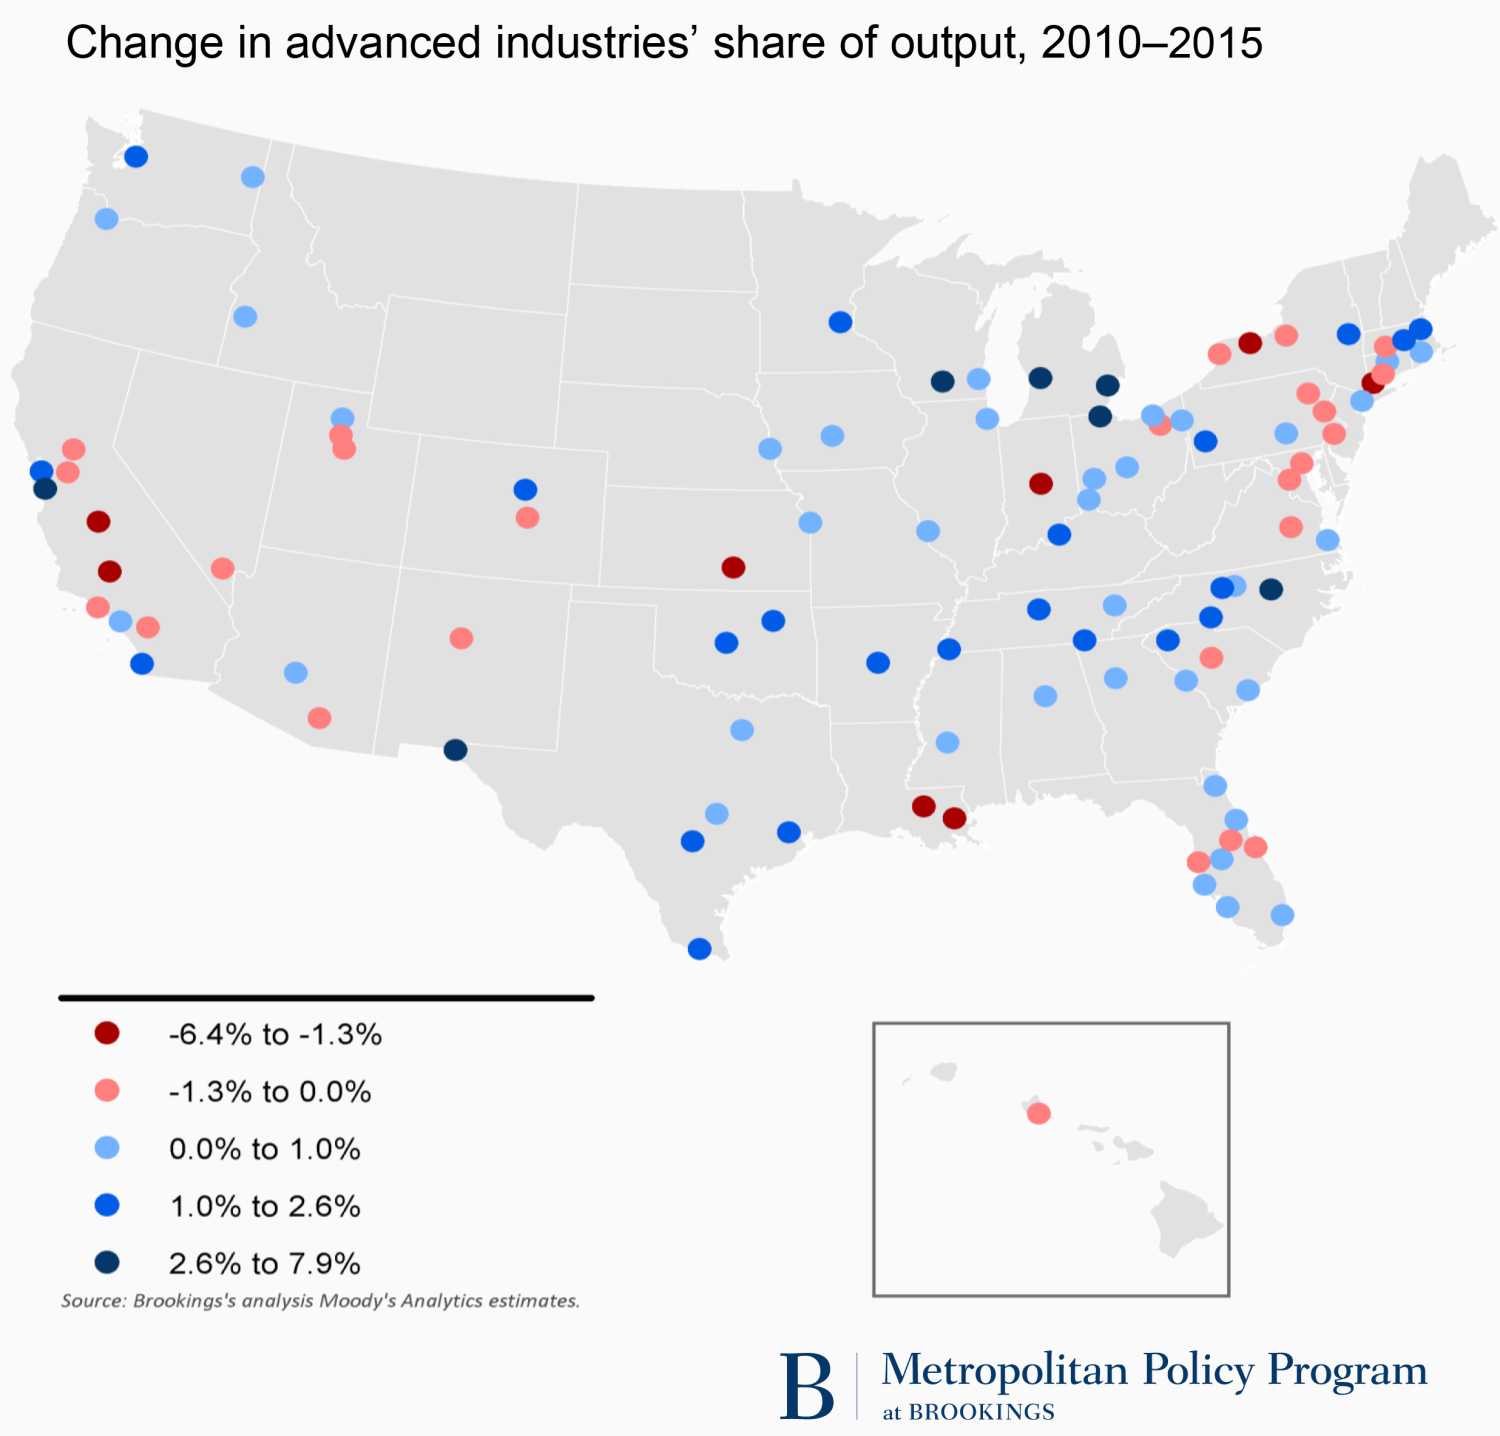
Turning to regions’ overall productivity growth, 45 of the 100 largest metro areas saw their overall productivity grow (as measured by the change in their gross metropolitan product per job) between 2010 and 2015, most driven by a strong productivity growth in advanced industries. Among the metros with the greatest gains in productivity since the Great Recession (without a heavy dependence on cyclical energy industries) are San Jose, Calif.; Austin, Texas; Pittsburgh, Penn.; San Francisco, Calif.; Seattle, Wash.; San Diego, Calif.; Madison, Wisc.; Nashville, Tenn.; Minneapolis–St. Paul, Minn., and Portland, Ore. all of which have increased their output per job by more than 1 percent since 2010. In these metro areas, advanced industry productivity gains are contributing to broader productivity increases that are allowing regional economies to making important strides toward the delivery of an advanced economy that works for all. Increases in productivity and the increased wages it can provide are the best way to improve the economic well-being of workers and families.
In sum, a number of cross-cutting industry dynamics have slowed the post-recession gains of the advanced industries sector, exacerbating the unevenness of the sector’s growth and sharpening geographic variation. The trends are distinct.
With advanced manufacturing growth slowing slightly and energy growth virtually nil, more of the sector’s output and employment growth is coming from a shorter list of high-tech services and automotive industries. Consequently, a somewhat shorter list of metro areas profited between 2013 and 2015 from trends that tended to favor the auto corridor and tech hubs in the Northeast and West. That means that the nation’s search for broadly shared prosperity—which very much depends on the vitality of the advanced industries sector—must now depend on a narrower base of industries and places. Nonetheless, a relatively short list of deep and diversified advanced industry centers continued to orient their economies to the sector and so assemble a promising base for future prosperity.
Discussion
Tracking the progress and location of America’s advanced industries is important because local advanced industries drive prosperity. Not only do these industries constitute the nation’s most significant local concentrations of commercial innovation, technical skills, and high-tech industry clustering, but they represent important sources of high-value output and employment. As such, the sector will be inordinately important in helping to build an advanced economy that works for all—both locally and nationally.
Accordingly, metropolitan leaders would do well to use the present trend data to benchmark the density, size, and growth of their advanced industries sector against those of their peers to better understand if they are putting their metropolitan economies on a higher-value trajectory of growth. To that end, placing the data in this report and the web-based state and metro trend “profiles” alongside the top-line measures in the “Metro Monitor” allows leaders to assess the performance of their region on a variety of industrial and socioeconomic measures.
These data also have a broader, national relevance that speaks to two of the nation’s most pressing economic problems: its vexing productivity slump and its inclusion crisis. The importance of productivity growth to local and national prosperity suggests leaders should pay special attention to the areas of the economy (such as key advanced industries) that are exhibiting such growth. That many portions of the advanced industries sector are increasing their productivity argues for supporting such growth, learning from it, and seeking to transmit those increases to the rest of the sector and the national economy. It could be, for example, that the single best strategy for boosting U.S. productivity growth is to encourage the diffusion of advanced-industry technologies, tools, processes, and business models across the entire economy and into all industries, including low-productivity ones.[xviii] In any event, accelerated, regional advanced industries’ growth and productivity will be key to providing the models, practices, and products and services necessary to drive further productivity gains inside the sector and spark much needed new gains outside it. In this vein, federal, state, and local economic development strategies should seek to foster innovation at the advanced-sector frontier while also facilitating the diffusion of the sector’s innovations to industries and firms beyond it.
Similarly, that a robust advanced sector will be a prerequisite for an advanced economy that works for all suggests that the sector’s growth will be an important element of pushing back against economic exclusion. To be sure, suspicions that high-productivity, high-tech growth does not benefit most workers persist in the national debate. However, abundant evidence suggests that high-tech productivity growth has and can continue to translate into high wages and living standards for the average worker.[xix] Given that, regional and national economic leaders, workers’ advocates, and social voices should consider that expanding the advanced industries sector and diffusing its innovations will be essential if the nation is to see increased wages and more employment for workers with less than a four-year degree.[xx]
All of which throws a particular light on the trends reported in this update.
On the upside, the continued growth of many advanced industries in many communities—led by the strong performance of the digital services subsector in many places—gives cause for some encouragement about the nation’s growth path as it moves beyond the Great Recession and into a jittery “new normal.”
That output or employment growth accelerated between 2013 and 2015 in about one-half of the industries confirms a degree of solidity in these industries in the face of global headwinds. Moreover, the truly dynamic and quite broadly dispersed growth of the digital services subsector bodes well. Digital technologies are currently the most effective tools for raising the nation’s productivity. That digital services growth is rapid in the nation’s top tech-creation hubs and solid in dozens of other metro areas where digital technologies are being installed locally suggests that widespread digital investment may well be positioning both advanced and other industries for future growth. That is something for the nation and its cities to build on as they seek to craft an advanced economy that works for all.
With that said, though, many of the trends revealed by this trend are disquieting. Although one-half of the sector was accelerating, one-half was not, and others among the growing industries were progressing only sluggishly.
The slowing of manufacturing growth and the collapse of employment in the energy subsector means that the advanced sector’s growth base has narrowed. That 60 percent of the nation’s advanced industries’ employment growth since 2014 owes to four booming digital services and three slowing auto-related industries should concern leaders and workers alike. For one thing, industrial diversity is not just important as a hedge against industry-specific shocks but as a source of innovation in an era of technological complexity and convergence. In addition, the higher education demands of the advanced services subsector compared with manufacturing mean that some of the fastest growing advanced industries today may be less accessible to those with less education in the next few years. Serious thought and action are needed to implement needed industry, government, and nonprofit sector responses to foster advanced manufacturing growth and access to its jobs while at the same time encouraging the application of advanced-sector technologies and practices outside the sector. (A forthcoming report from the Metro Program will offer an array of such responses.) Key action agendas include continuous increases in the nation’s drifting R&D budgets and urgent investments of sector-relevant STEM education and workforce training.
Similarly, the geography of advanced industries’ progress has also narrowed across an already uneven map of metropolitan areas. With the modest surge of the immediate recovery years ebbing, the sector’s growth and deepening in many metro communities has slowed. It should be deeply troubling for leaders that more than one-half of the nation’s largest metropolitan areas have grown less specialized in advanced industries since the economic crisis. That means that fewer cities and fewer regions are deepening their participation in the industries that matter most for constructing broadly shared prosperity. In that sense, economic inclusion is still eroding on another dimension—the spatial one. That trend challenges metropolitan and state leaders to weigh a new round of strategies to stimulate, broaden, and sustain advanced industries growth. The coming report will also outline such strategies.
In the meantime, we hope that city-metropolitan, state, and national leaders will profit from using this report and its interactive website to assess their current progress in assembling a key portion of the industry base they will need to craft an advanced economy that works for all.
Endnotes
[i] For more on the outlines of an “advanced economy that works for all” see Alan Berube and Amy Liu, “Achieving an Advanced Economy That Works for All: The Brookings Metropolitan Policy Program in 2016 and Beyond” (Washington: Brookings, 2016).
[ii] For background on key technology trends that are defining and transforming the advanced industries sector, see Chapter 2 of Muro and others, “America’s Advanced Industries: What They Are, Where They Are, and Why They Matter” (Washington: Brookings, YEAR). For a more detailed overview, see James Manyika and others, “Disruptive Technologies: Advances That Will Transform Life, Business, and the Global Economy” (San Francisco: McKinsey Global Institute, 2013). For an early discussion of “digitization,” see Robert Atkinson and Andrew McKay, “Digital Prosperity: Understanding the Economic Benefits of the Information Technology Revolution” (Washington: Information Technology and Innovation Foundation, 2007), and James Manyika and others, “Digital America: A Tale of the Haves and Have-Mores” (San Francisco: McKinsey Global Institute, 2015). For more on the Internet of Things, see Michael Porter and James Heppelmann, “How Smart, Connected Products Are Transforming Companies,” Harvard Business Review, vol., 2015, and Porter and Heppelmann, “How Smart, Connected Products Are Transforming Competition,” Harvard Business Review, vol., 2014.
[iii] See, most recently, Robert Atkinson, “Think Like an Enterprise: Why Nations Need Comprehensive Productivity Strategies” (Washington: Information Technology and Innovation Foundation, 2016).
[iv] Jonathan Rothwell, “The Hidden STEM Economy” (Washington: Brookings, 2013).
[v] Brookings analysis of Moody’s Analytics data.
[vi] Ibid., here and through this paragraph.
[vii] Ibid.
[viii] For a recent discussion of the importance of technology diffusion as a crucial source of economywide productivity growth, see the Organisation for Economic Co-Operation and Development, The Future of Productivity (Paris: 2015).
[ix] See Muro and others, “America’s Advanced Industries.” See also Atkinson, “Think Like an Enterprise.”
[x] Boyan Jovanovic and Peter Rousseau, “General Purpose Technologies.” In Philippe Aghion and Steven Durlauf, eds., Handbook of Economic Growth Volume 1B (New York: Elsevier, 2005).
[xi] Substantial research confirms that ICT is a powerful driver of productivity and that it supports greater productivity growth at the firm, industry, and country levels alike. Research has shown specifically that the application of ICT was responsible for more than one-third of total labor productivity growth between 2002 and 2012 as nontech sectors such as retail, wholesale, and hospitality have begun to invest heavily. See, for example, Dale Jorgenson and others, “Information Technology and U.S. Productivity Growth: Evidence from a Prototype Industry Production Account,” Journal of Productivity Analysis, 35 (2) (2011).
[xii] See, for example, Manyika and others, “Disruptive Technologies.”
[xiii] Muro and others, “America’s Advanced Industries.”
[xiv] To be deemed a metropolitan area “oriented to” advanced manufacturing, a metro was required to have a location quotient of greater than 1 for its aggregate manufacturing subsector with neither its advanced energy or services subsectors similarly specialized.
[xv] To be deemed an “energy metro,” a region was required to have a location quotient of greater than 1 for its aggregate energy subsector with neither its advanced manufacturing or services subsectors similarly specialized.
[xvi] A metro “oriented to services” was required to have a location quotient of greater than 1 for its aggregate services subsector with neither its advanced manufacturing nor energy subsectors similarly specialized.
[xvii] The balanced metros were required to have a location quotient of greater than 1 for at least two of their aggregate subsectors.
[xviii] This is also the view of innovation and productivity expert Rob Atkinson (see “Think Like An Enterprise”). Scholars at the Organisation for Economic Cooperation and Development (OECD) have also concluded that the surest path to improved productivity is to encourage across-the-board productivity growth rather than trying to increase it by shifting the region’s sector mix to high-productivity sectors. See Margit Molnar and Thomas Chalaux, “Recent Trends in Productivity in China: Shift-Share Analysis of Labor Productivity Growth and the Evolution of the Productivity Gap” (Paris: OECD Publishing, 2015).
[xix] For some of this literature see Atkinson, “Think Like an Enterprise.”
[xx]See, for example, Neil Lee and Andres Rodriquez-Pose, “Is There Trickle-Down from Tech? Poverty, Employment, and the High-Technology Multiplier in U.S. Cities,” Annals of the American Association of Geographers (online) (Washington: American Association of Geographers, June 8, 2016).
Acknowledgments
The Metropolitan Policy Program at Brookings would like to thank the Alcoa Foundation, Central Indiana Corporate Partnership, Charles Stewart Mott Foundation, Lear Corporation, Switch, and Antoine van Agtmael for their support of the program’s advanced industries work. The program is also grateful to the Metropolitan Council, a network of business, civic, and philanthropic leaders who act as financial and intellectual partners to the Metro Program.
In addition, the report’s authors would like to thank Randy Boyd, Jon Cardinal, Ferki Ferati, Richard Florida, Michelle Hadwiger, Sue Helper, Peter Hirshberg, David Johnson, Bruce Katz, Helmuth Ludwig, Ken Lund, Jason Miller, Robert McMahan, Richard Kimball, Kelly Kline, Thomas Mason, Stefan Pryor, Ralph Schulz, Greg Spencer, Ted Townsend, and Perry Wood.
And finally, at Brookings, the authors would like to thank Alan Berube, Liza Cole, Allison Courtin, Jody Franklin, Alec Friedhoff, Amy Liu, Joe Parilla, Emily Rabadi, and Phoebe Silag for their substantive assistance; Barbara Ray for her editorial help; and Stephen Russ for visual development, design, and layout.
Authors

The Brookings Institution is committed to quality, independence, and impact.
We are supported by a diverse array of funders. In line with our values and policies, each Brookings publication represents the sole views of its author(s).