Reported Trade and Value-Added Trade
In 2012, the U.S. exported $2,196 billion and imported $2,736 billion worth of goods and services, producing a trade deficit of $540 billion. This U.S. trade balance with the world comprises the sum of all the bilateral trade balances the U.S. runs with its trading partners, some of which are in surplus and others that are in deficit. For instance, in 2012, the U.S. had bilateral trade in goods deficits with China ($315 billion), Japan ($76 billion), Mexico ($61 billion) and Germany ($60 billion), and bilateral trade surpluses with Australia ($22 billion), Brazil ($12 billion), Chile ($10 billion) and Panama ($9 billion).
The reported trade balances of the U.S., and all other countries for that matter, are based on the gross commercial value of the goods and services as they depart and enter the country. What these reported trade balances don’t adequately capture is the complex nature of the global economic relationships of international trade today. Quite often goods and services move across multiple national borders in order produce a final product that is then exported. WTO Director-General Pasqual Lamy has described this phenomenon as goods being “made in the world”.
For instance, the U.S., Canada and Mexico are economically very integrated with goods and services often crossing their borders many times in order to produce a final product. According to reported trade data in 2009, [1] the U.S. had a trade deficit with Mexico of $48 billion and a trade deficit with Canada of $22 billion. This would suggest the U.S. simply buys more from Mexico and Canada than it sells to these countries. However, the economic ties between producers, manufacturers, and consumers across borders mean that this is only part of the story. In many cases, U.S. imports from Mexico and Canada are of intermediate goods that are used to produce products which the U.S. then exports back to Mexico and Canada, or the rest of the world.
Reported trade data also fails to capture the role of third countries in bilateral trading relationships. For instance, Japan exports goods to South Korea that are then exported to the United States.
Reported trade data also fails to capture the role of third countries in bilateral trading relationships. For instance, Japan exports goods to South Korea that are then exported to the United States. In these cases, Japan is exporting to South Korea but is also exporting to the U.S. via South Korea. However, the way that the U.S.-South Korea trade balance is currently reported does not adequately capture the role of Japanese inputs into Korean exports, which in value-added terms are Japanese exports to the U.S.
Value-added trade data reveals these economic relationships. But to date developing value-added statistics has been difficult to compile for a range of reasons, including obtaining what can be considered commercially sensitive data, the absence of a common statistical framework, and challenges in distinguishing between intermediate and final goods. Recent joint work undertaken by the WTO and the OECD assists with calculations of value-added trade.
For example, under a value-added calculation for 2009, both Mexico’s and Canada’s exports to the U.S. actually decline by around 25 percent each. Additionally, the value-added data reveal that 12 and 8 percent of total exports from Mexico and Canada to the world, respectively, reflects U.S. value-added trade. Moreover, in value-added terms the bilateral U.S. trade deficit with Japan would increase dramatically by 60 percent, from $23 billion to $36 billion.
The following table explains these differences between reported and value-added trade:
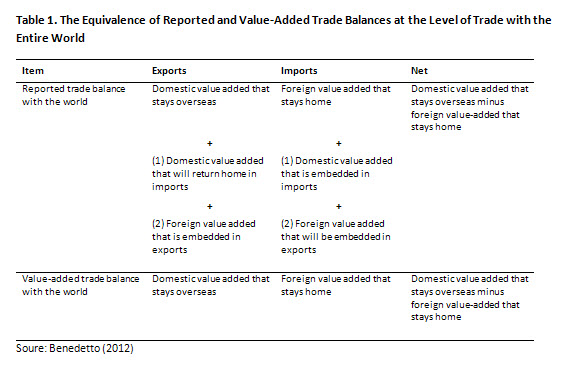
The table above explains how a country’s reported exports comprise three elements: domestic value-added that stays overseas; domestic value-added that returns home via imports; and foreign value-added incorporated into its exports. Similarly, reported imports includes the foreign value-added that remains in the country of import, the domestic value-added incorporated in its imports, and the foreign value-added in the imports that are later re-exported. In contrast, a country’s value-added exports capture only the domestic value-added that stays overseas and value-added imports are only the foreign value-added that remains in the country of import.
This table also explains why a country’s overall trade balance will be the same in reported and value-added terms, as the over and under accounting of exports and imports that arises from the inclusion of domestic and foreign value-added goods are themselves imports and exports that cancel each other out over a country’s total trade. This is to be expected as the current account balance, which equals the trade balance and net factor income, the latter unaffected by the conversion to value-added, is a function of the gap between domestic savings and investment and does not depend on whether trade is calculated in reported or value-added terms.
While a country’s trade with the world is the same in reported and value-added terms, bilateral trade balances can diverge greatly under value-added and reported data. But as the sum of a country’s reported and value-added bilateral trade balances sum to the same overall trade balance, a reduced bilateral trade deficit using value-added data with one country must be offset with changes in other value-added bilateral trade relationships. For instance, both reported and value-added trade data will still see the U.S. running the same overall trade deficit and China the same overall trade surplus, even when the value-added data shows a reduced U.S.-China bilateral trade deficit.
Trade Policy Implications for U.S.-China Trade
Differences between reported and value-added bilateral trade relationships have important implications for trade policy. As noted, value-added trade data captures the value traded and thereby reveals the income generated by trade in multiple countries and industries.
There is no bilateral trade relationship of greater economic and political significance for the U.S. than with China. For example, in 2012, U.S.-China trade in goods deficit was $315 billion, the largest bilateral deficit the United States has ever had. And it is the size of the trade deficit that feeds all manner of concerns in the U.S. about declining competitiveness, job losses, and unfair trade practices by Chinese companies. China is also the world’s largest exporter and a global center for the manufacturing and assembling of goods for export. In addition, manufactured exports tend to have higher levels of foreign value-added due to the role of imported intermediate goods and services in their production.
As a result, calculating the U.S.-China trade deficit using value-added data reduces the deficit by 25 percent. However, as China’s overall trade balance remains the same under reported and value-added trade data, a reduced bilateral trade deficit with the United States also means that China has greater bilateral trade surpluses (or reduced deficits) with other countries. This suggests that while China is exporting less domestic value to the U.S., it is adding more value to its exports to other countries.
One of the important trade policy insights here from the value-added data is that barriers to Chinese imports will often harm U.S. consumers through higher prices for final goods.
One of the important trade policy insights here from the value-added data is that barriers to Chinese imports will often harm U.S. consumers through higher prices for final goods. In addition, U.S. manufacturers would end up paying more for intermediate goods, which would reduce the competitiveness of their final goods in the U.S. and in export markets overseas. Furthermore, to the extent that U.S. trade barriers reduce demand for Chinese imports, they also reduce demand for the U.S. goods and services incorporated into China’s exports.
Value-added trade also reveals why it is also in China’s interest to reduce its trade barriers. Given the significant trade in intermediate goods and services used in China, reducing its trade barriers would make Chinese products even more competitive domestically and overseas.
This is only one example of how value-added data can change the way we understand how the international economy works, the role of trade and with important implications for trade policy. Reported data gives the impression that each country is wholly responsible for the production of its exports and this is now significantly out of a step with an international economy that increasingly relies on disaggregated supply chains spread across many countries where goods and services are trade across borders multiple times. In contrast, value-added data calculates these economic linkages and reveals the contribution that countries make to global processes. Economists since David Ricardo in the 19th century have demonstrated the economic gains to countries from trade. Value-added trade data reaffirms these insights and reveals how in today’s economically-integrated world trade barriers are also often barriers against goods and services that domestic industry had a role in creating.
These realities may also help explain why protectionist pressures have been relatively subdued during the difficult economic period after the 2008 global crisis. Does this mean that international trade comes with no problems? Not at all. Whether in value-added or traditional final products form, trade supports a process of “creative destruction” where national wealth increases but some firms and households lose out to others. There are, therefore, strong ethical and political arguments for assisting the “losers” in their needs to adjust and providing a social safety net to those who are not in a position to adjust. The increasing importance of international value chains raises tax avoidance issues for multinationals. This is a big topic but suffice it to say here that international cooperation to avoid excessive tax avoidance is reasonable. Finally, while international value chains make it easier for some poorer countries to “break-into” the world economy, it may also make it more difficult for them to develop national economic strategies aimed at reaping the benefits of agglomeration of economic activities and deepening their industrial production.
Footnote
[1] The most recent value-added trade data is from 2009
References
Benedetto, John. July 2012. “Implications and Interpretations of Value-Added Trade Balances,” Journal of International Commerce & Economics, Vol. 4, No. 2. U.S. International Trade Commission.


Commentary
Op-edValue-Added Trade and Its Implications for International Trade Policy
April 2, 2013