We have posted the full update to end-2020 of the External Wealth of Nations database, covering 212 economies, plus the euro area and the Eastern Caribbean Currency Union as a whole. We provide here some stylized facts from this updated data.
- The run-up in global stock prices boosted the value of cross-border equity claims and liabilities.
- Financial centers play an outsized role in cross-border asset holdings.
- After falling sharply between 1995 and the early 2010s, the external debt ratio in emerging and developing economies, excluding China, has been on the rise.
The External Wealth of Nations database was developed with Philip Lane over the past 23 years. This blog provides a short description as well as relevant references. The September 2021 update highlighted important developments in 2020, focusing on the evolution of net creditor and debtor positions across the main countries.
The drivers of external positions
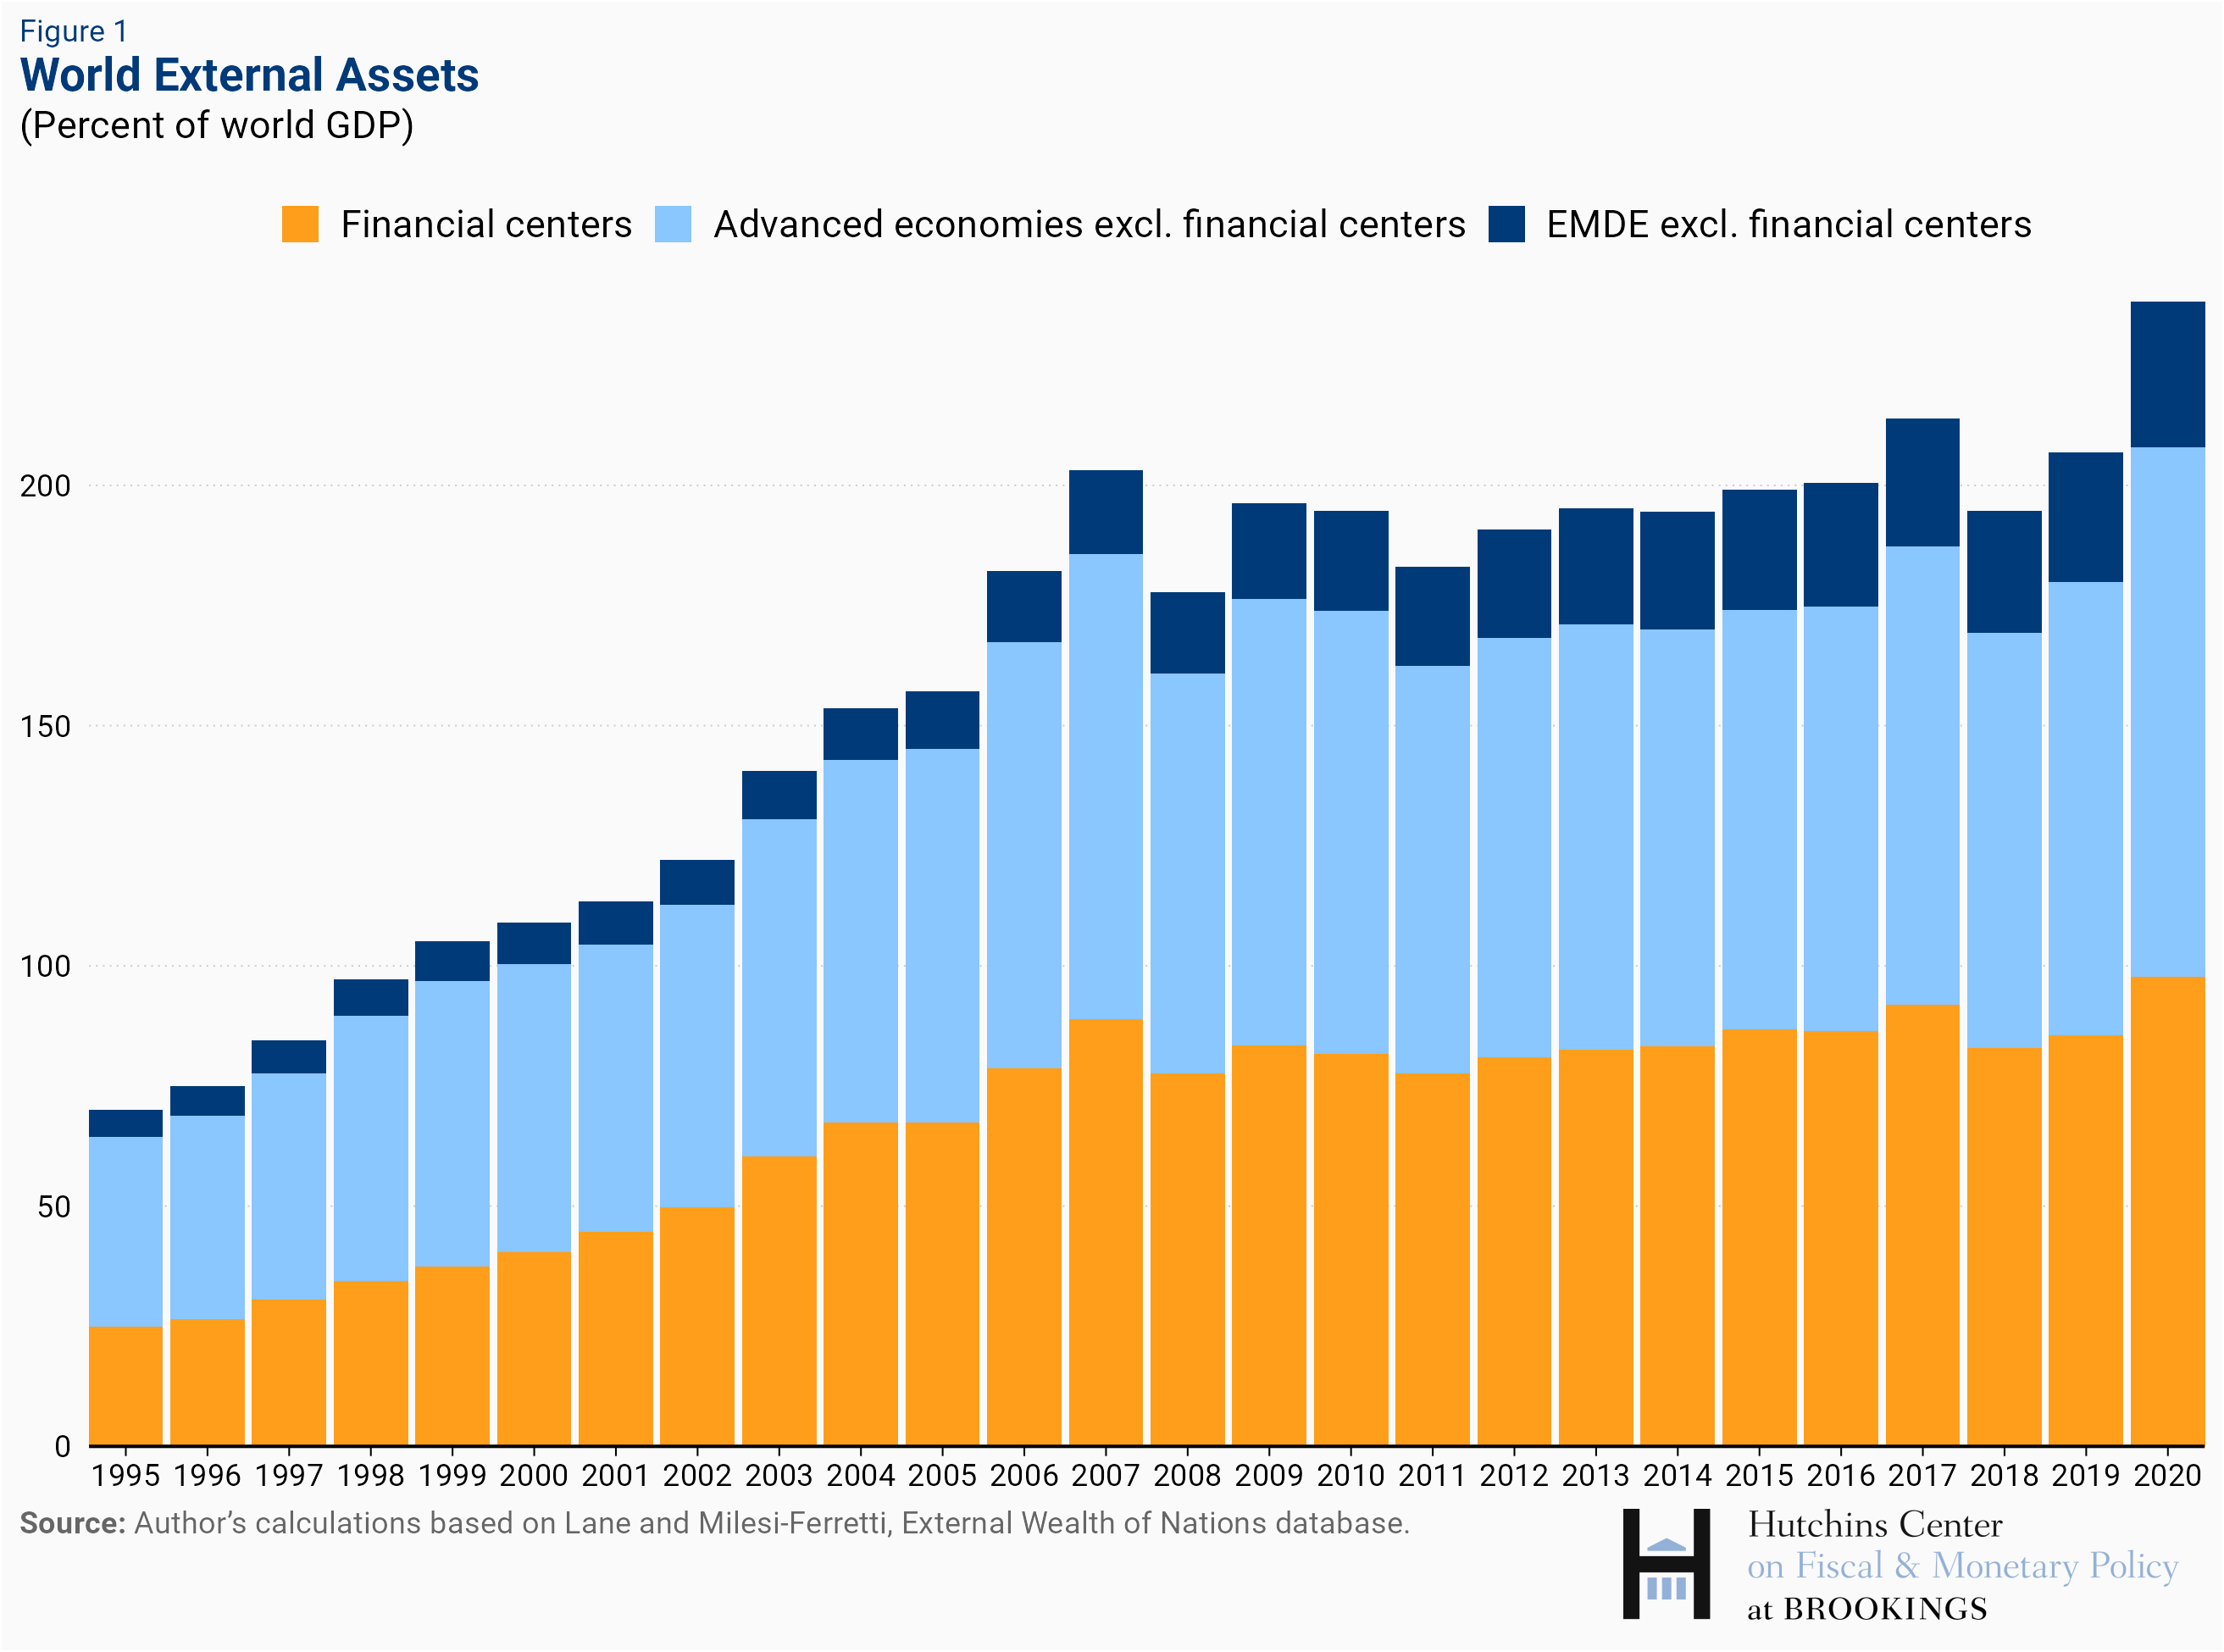
World external assets and liabilities, scaled by world GDP, rose sharply in 2020. Two factors explain this rise. The first was the COVID-induced decline in GDP in most world economies, which mechanically raised the ratio of assets and liabilities to GDP. The second was the runup in world stock prices, which boosted the value of cross-border equity claims and liabilities: foreign direct investment (controlling stakes in nonresident firms) and portfolio equity (shares in nonresident companies). These are around half of total external claims and liabilities, excluding financial derivatives. The second chart shows the striking correlation between changes in stock prices and changes in global equity claims.
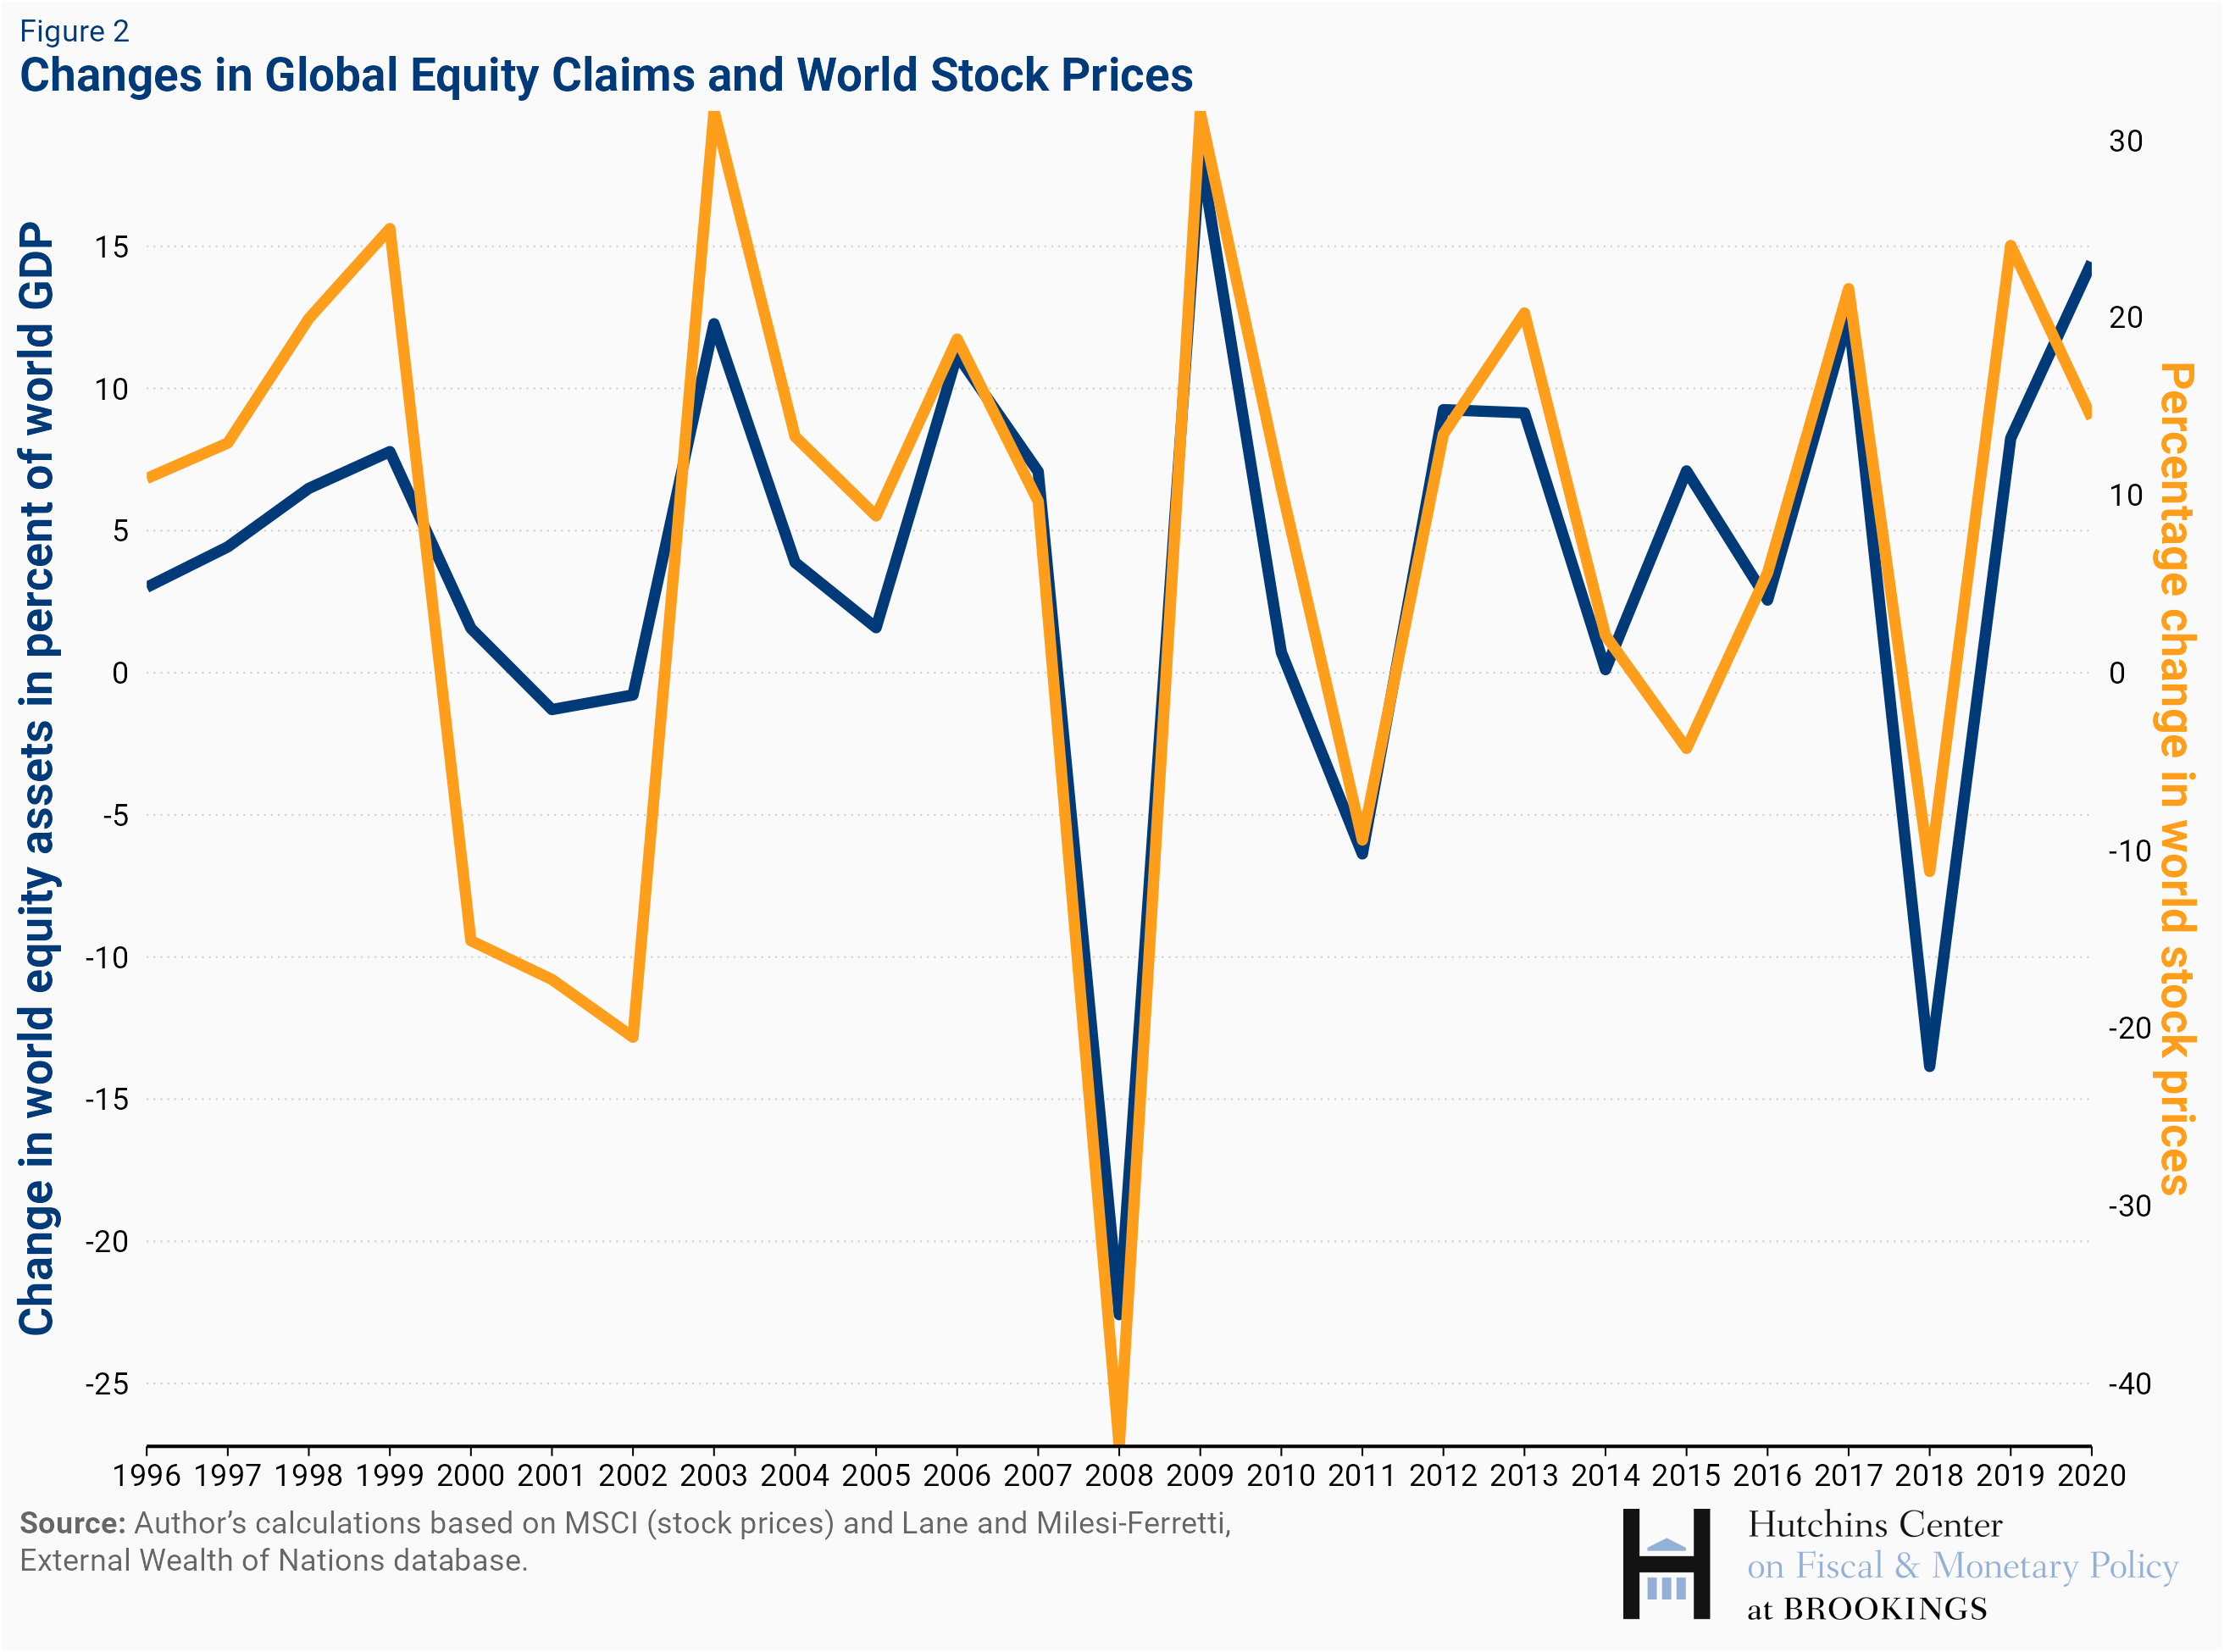
Global claims and liabilities are also driven by global financial flows, which represent net acquisitions of new cross-border holdings. In 2020 these flows remained close to their average over the previous decade, at about 7½ percent of world GDP, well below the peaks reached before the global financial crisis. For global equity claims, higher valuations accounted for over ¾ of their increase between end-2019 and end-2020, with flows accounting for the remaining ¼.

The role of financial centers
International financial centers play a major role in cross-border asset holdings. We define these as economies whose main role in international finance consists of intermediating financial flows between ultimate source and destination countries. They include a few large and medium-sized economies (United Kingdom, Netherlands, Switzerland, Belgium, Ireland) which are also ultimate sources and destinations of cross-border investment, and several smaller economies (Luxembourg, Malta, Cyprus) and tiny offshore centers (such as Bermuda, the British Virgin Islands, the Cayman Islands, and Jersey) which overwhelmingly play an intermediation role. Their combined GDP is about 7 percent of the world total, but their total external claims and liabilities are about 40 percent of the world total.
The charts show the relative weight of financial centers in the different asset and liability categories at the end of 2020, compared to the remainder of advanced economies and emerging market and developing economies. The weight of financial centers is highest in FDI, reflecting the complex financial structures adopted by multinational corporations for tax and regulatory reasons. These structures include heavy use of so-called special purpose vehicles, legal entities with little or no employment or physical presence, which are used to channel funds from one location to another. (The FDI positions of Luxembourg and the Netherlands are notable in this respect, with combined FDI claims and liabilities each exceeding $12 trillion.) Financial centers also account for a large share of global portfolio equity liabilities. These liabilities are mostly shares of investment funds domiciled in financial centers such as the Cayman Islands, Ireland, and Luxembourg. In turn, these funds are invested in different financial instruments, including both equity and debt securities, which are captured in external asset statistics.
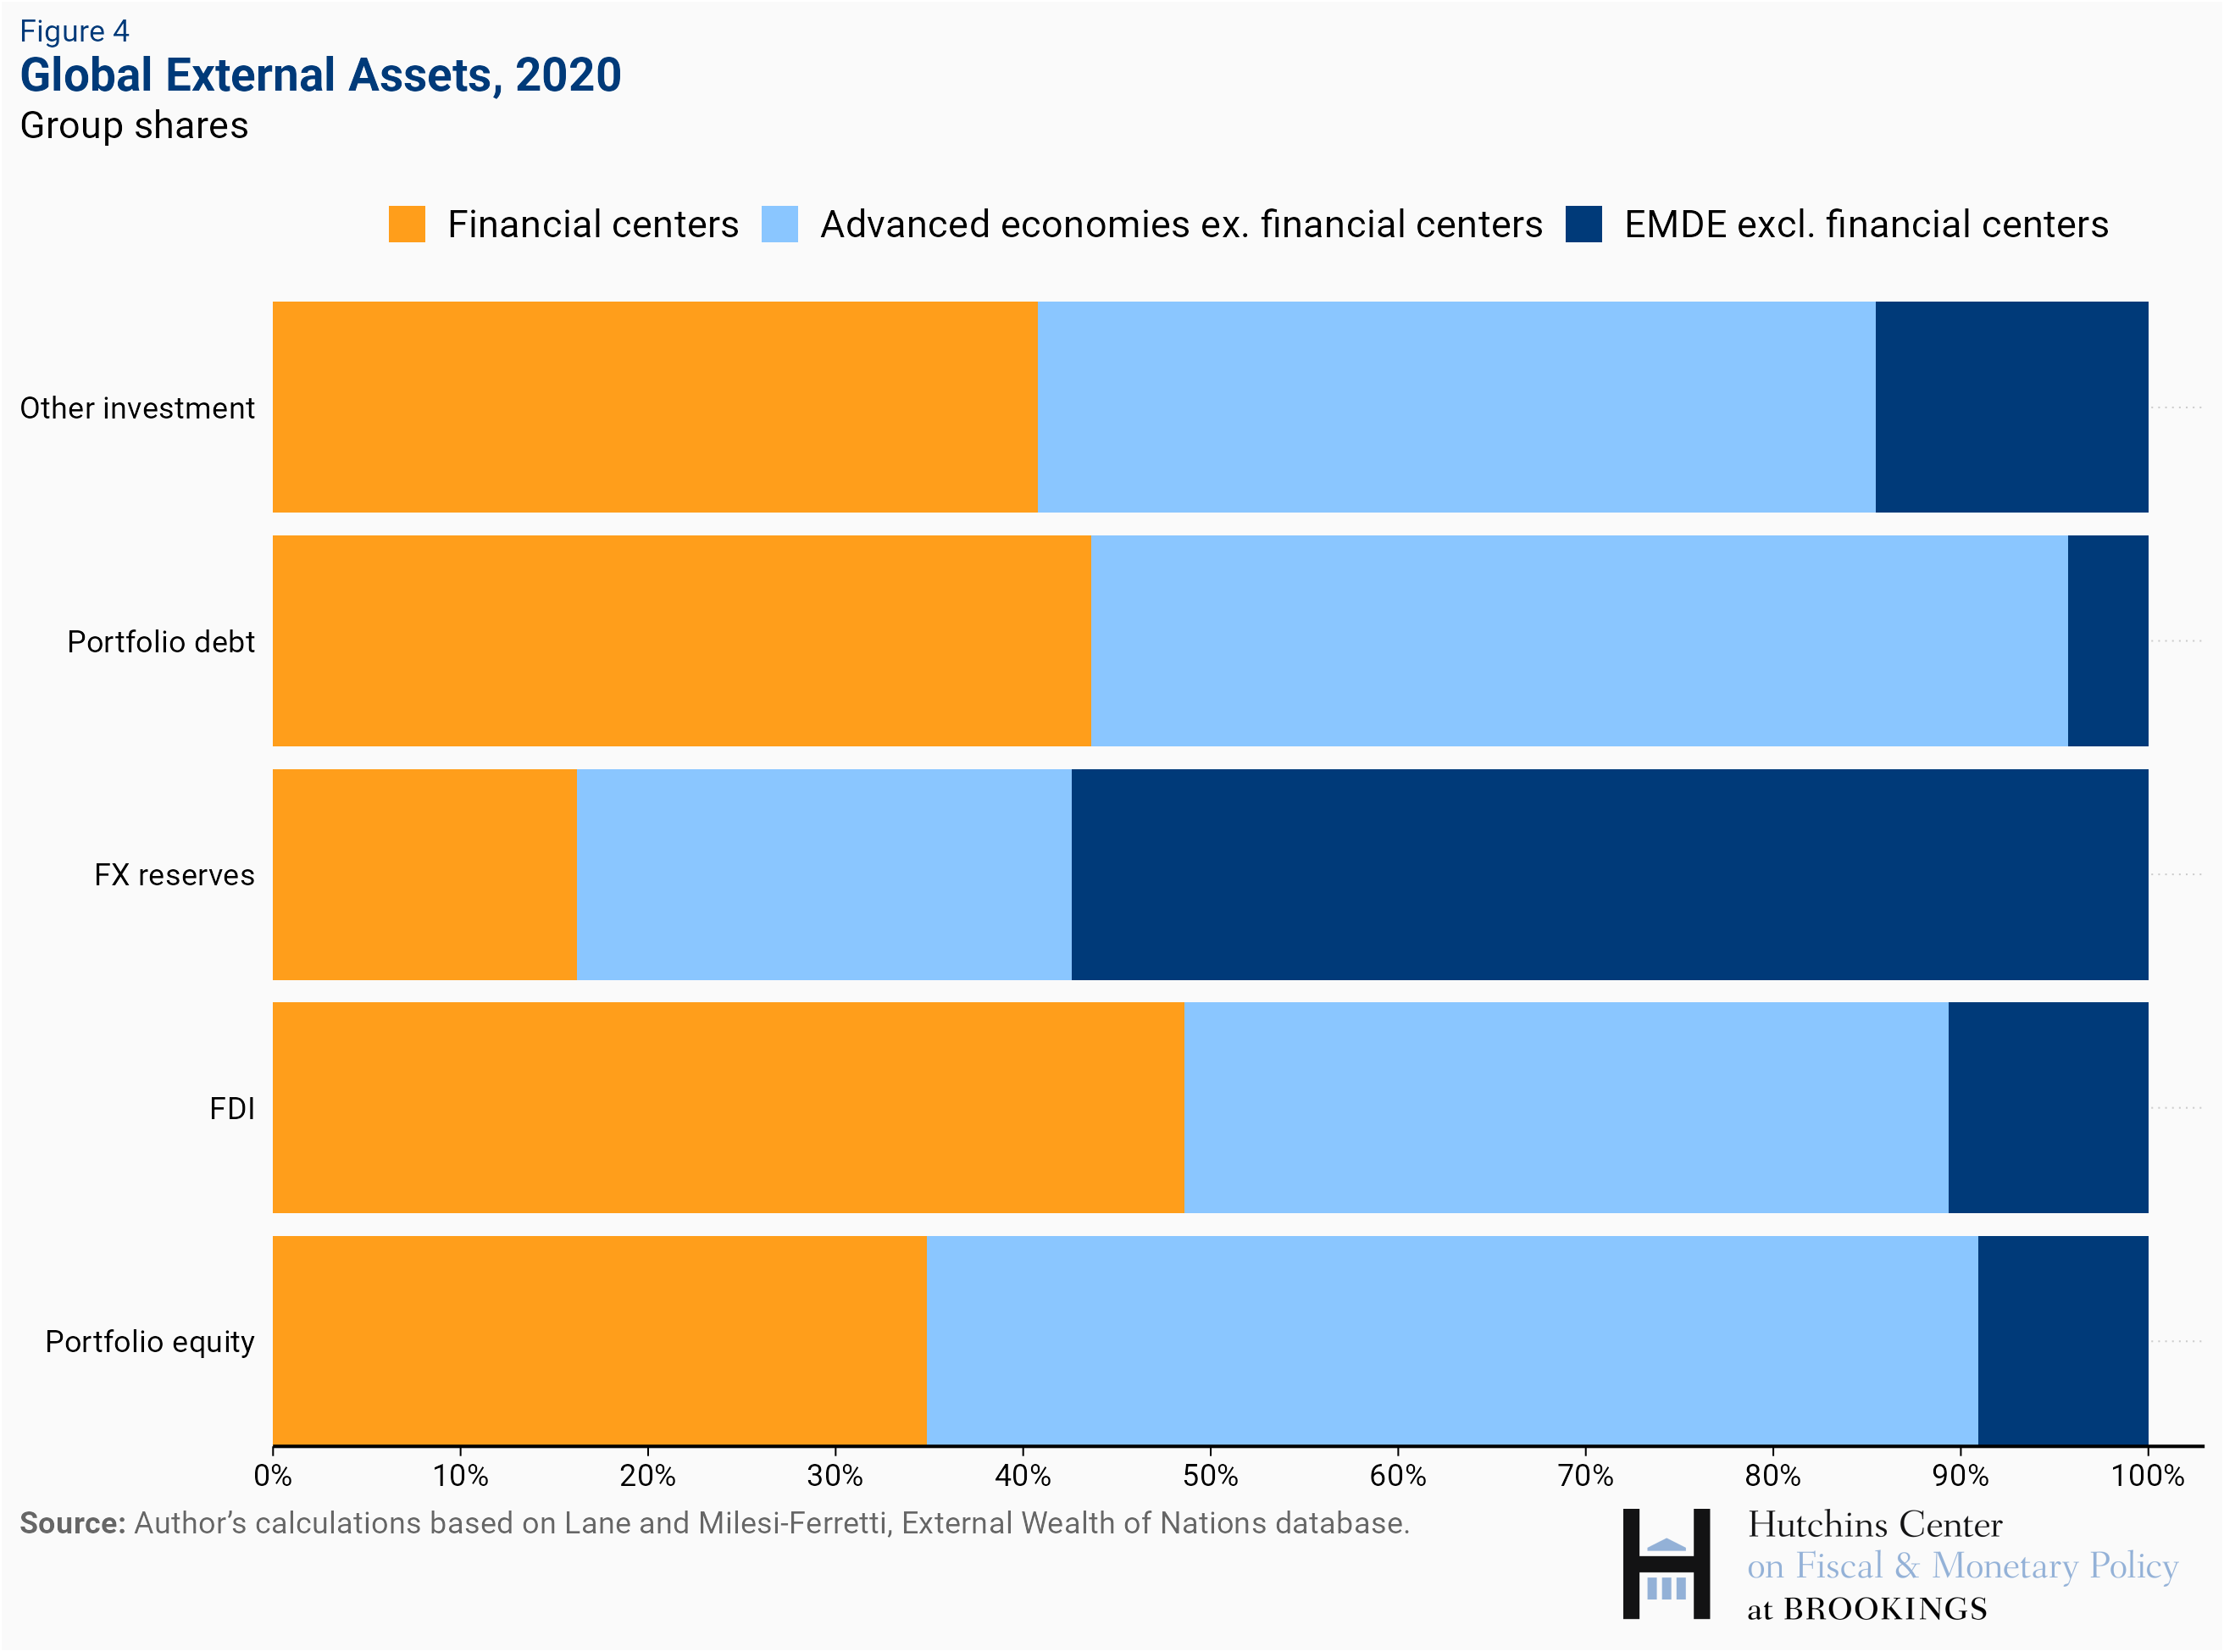
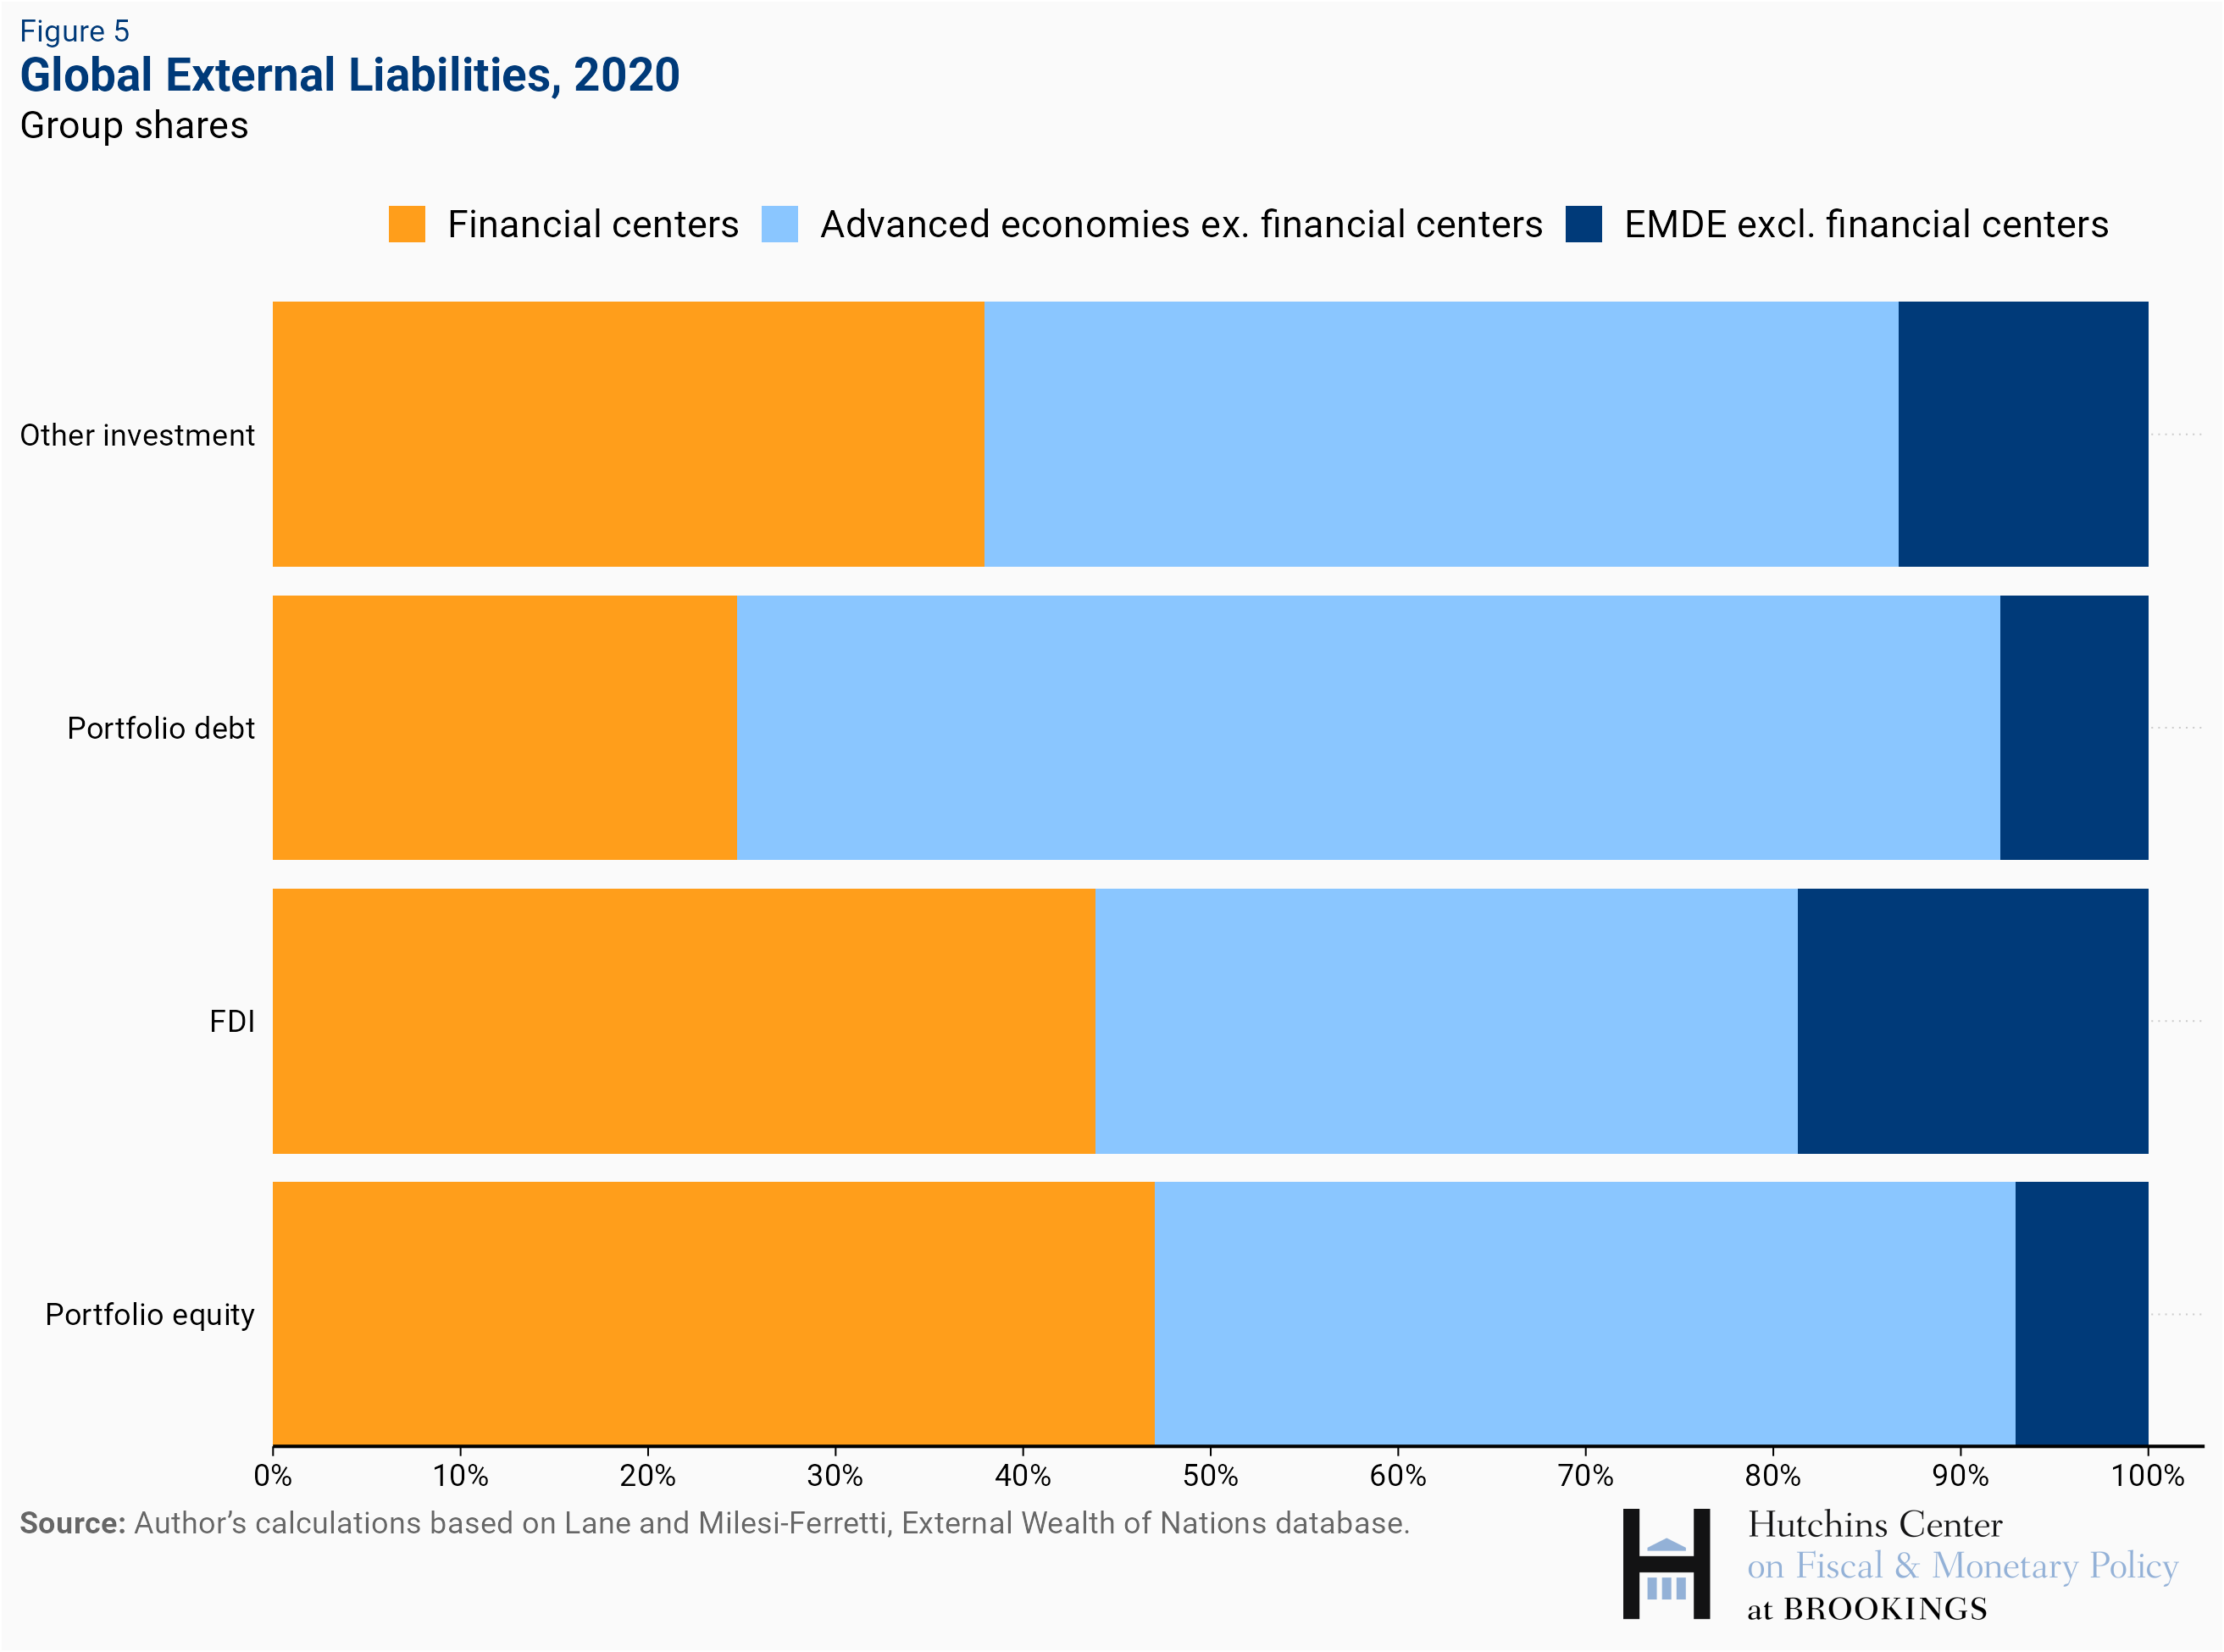
Emerging market and developing economies account for the majority of holdings of foreign exchange reserves, while they play a more modest role in claims of portfolio instruments, both equity and debt. Advanced economies excluding financial centers account for the lion’s share of portfolio debt liabilities, with U.S. and euro area securities held as foreign exchange reserves playing an important role.
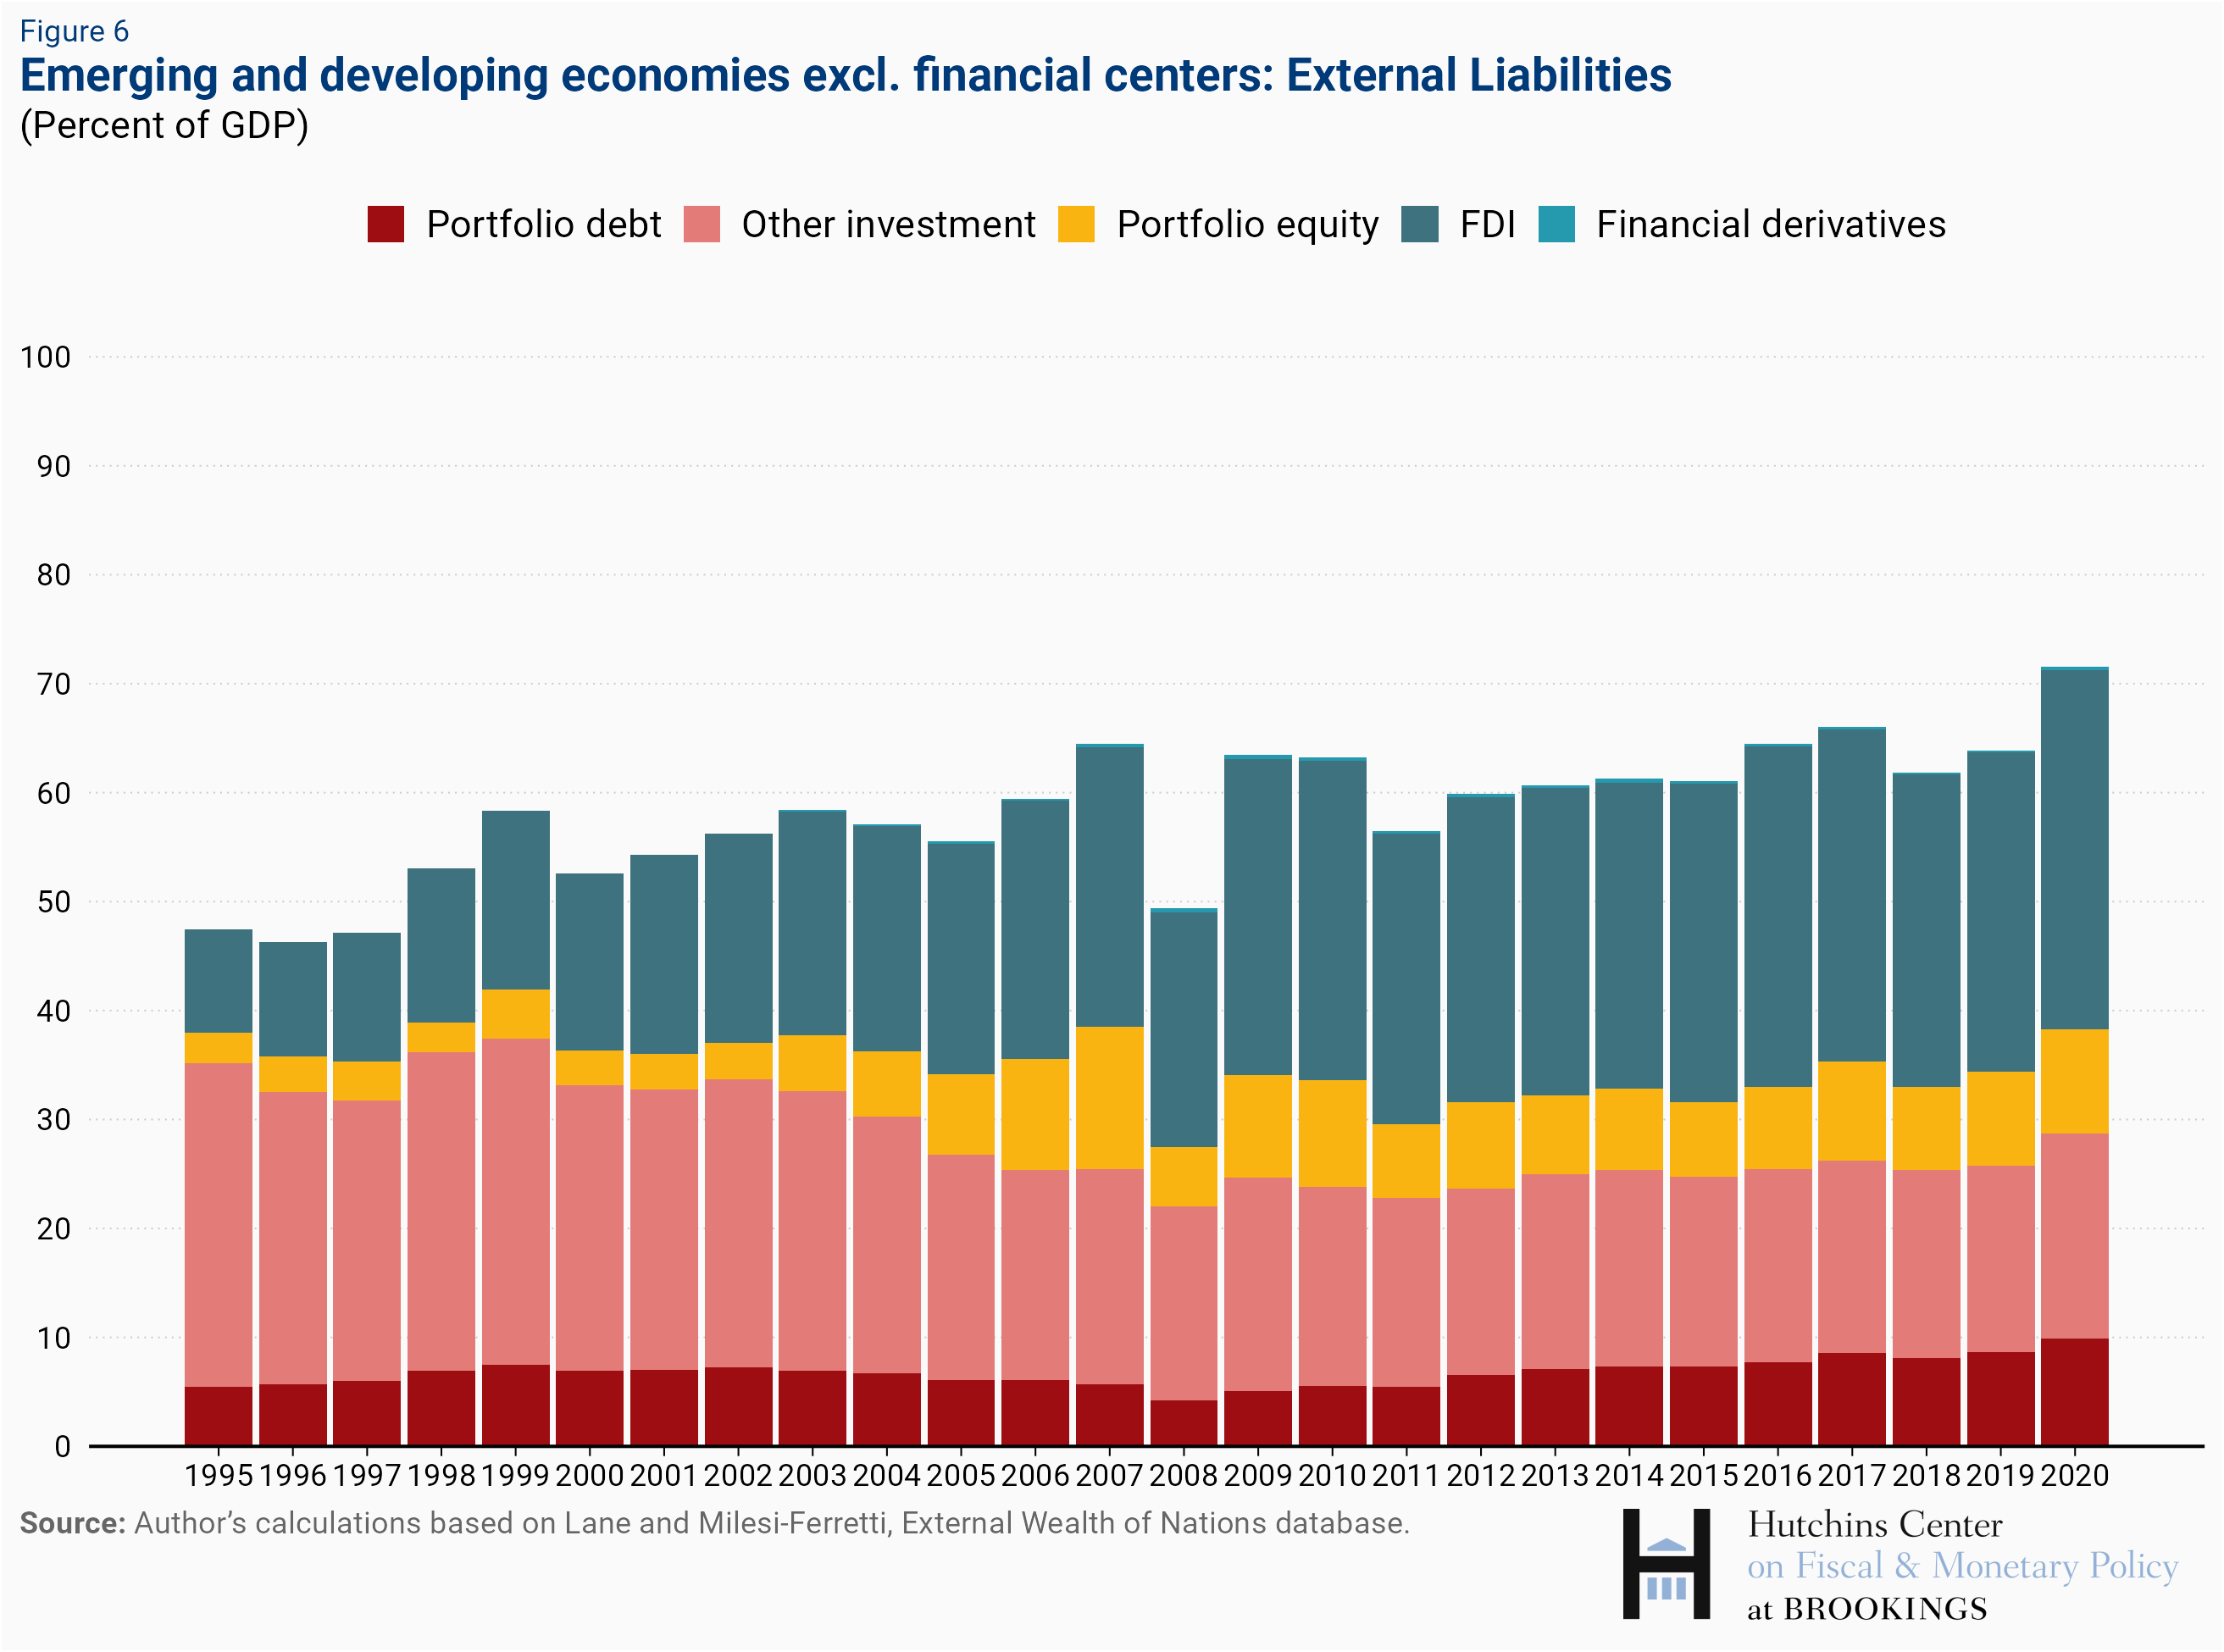
The balance sheet of emerging and developing economies
Much attention has been devoted to the build-up of debt in emerging and developing economies in the aftermath of the COVID crisis. The level and composition of these economies’ external liabilities have evolved over the past 25 years. As the first chart shows, there was a notable reduction in the external debt (red and pink bars) as a share of GDP between the mid-1990s and the beginning of the past decade, and a sharp increase in equity liabilities (portfolio equity and especially FDI). These latter categories are mostly denominated in domestic currency. Coupled with some shift in the currency composition of external debt towards local currency instruments, this shift reduced the balance sheet vulnerability of emerging economies to currency depreciation. External debt does show some modest increase between 2018 and 2020.
China represented over 43 percent of the aggregate GDP of emerging market and developing economies in 2020, so it is instructive to look at the balance sheet of emerging and developing economies excluding it. Once China is excluded, the level of external liabilities scaled by GDP rises as the average extent of financial integration of the remainder of emerging and developing economies is higher. Even more notable is the protracted rise in external liabilities, starting in 2012, including a gradual build-up of external debt.
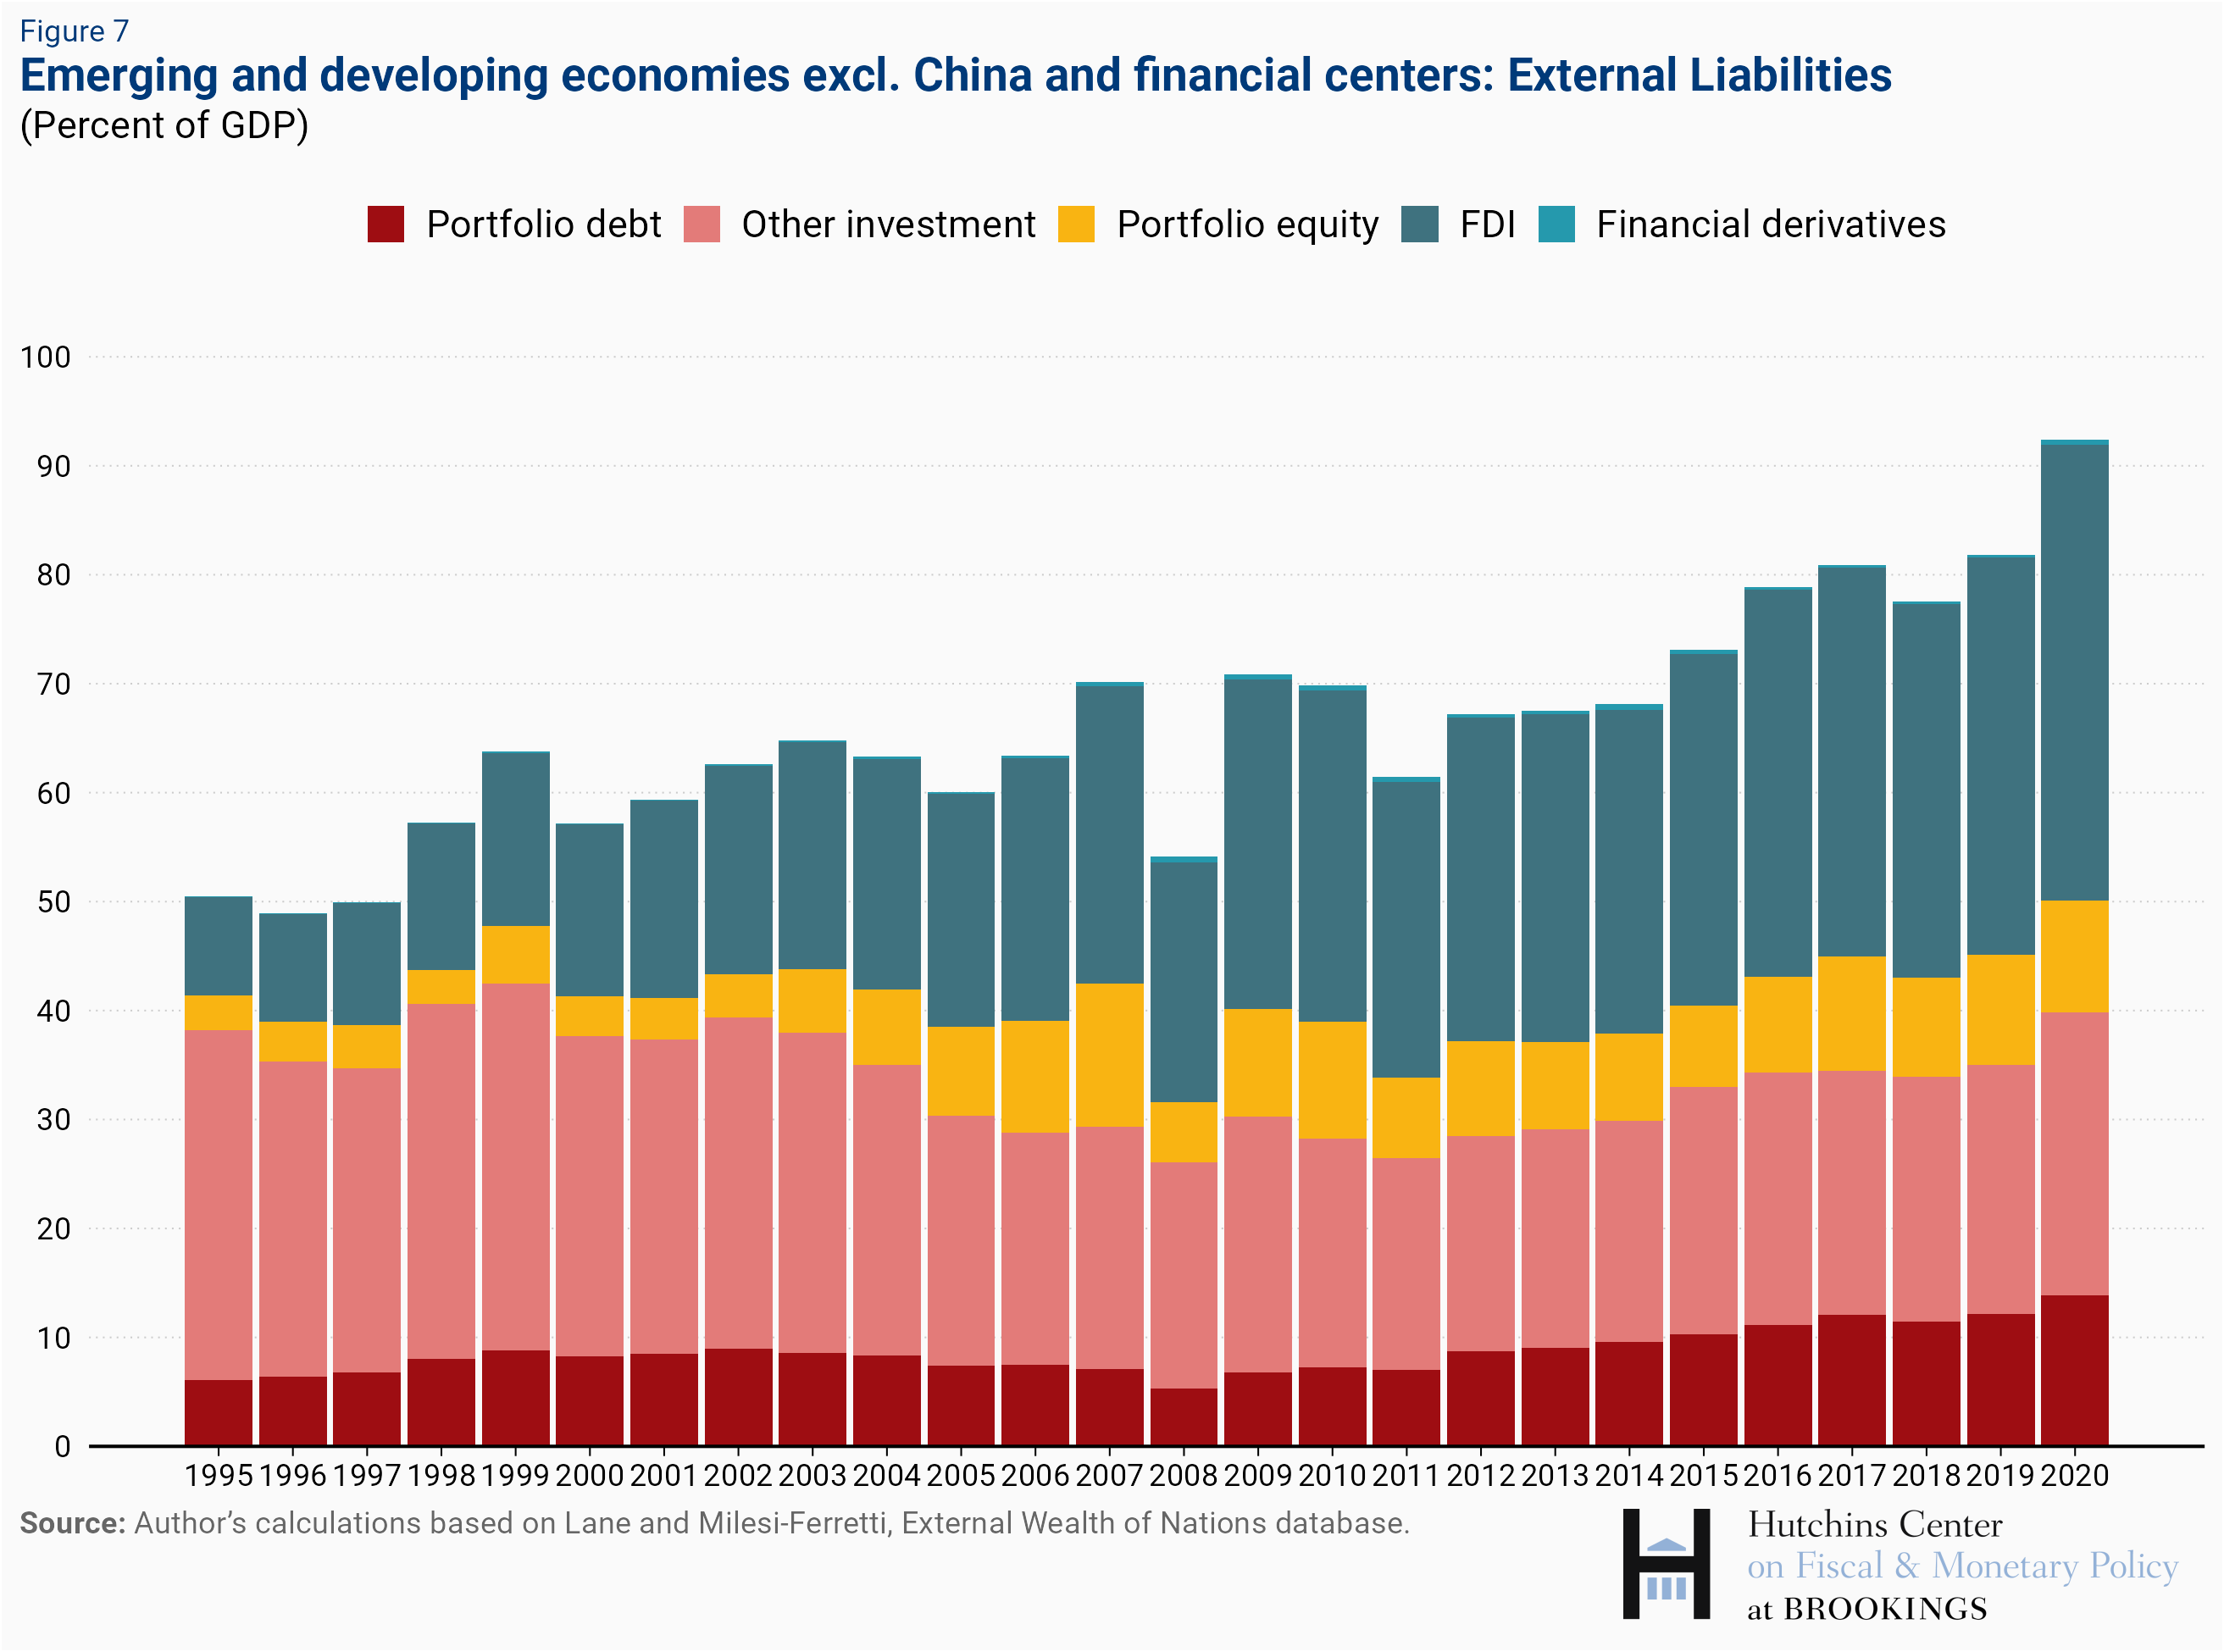
Is this a source of concern? While in the aggregate the net external position of these economies is only mildly negative, these figures are heavily influenced by the large creditor positions of the main oil exporters, and the median value for gross external debt as a share of GDP at end-2020 was higher than in the mid-1990s. Higher foreign exchange reserves and a more favorable currency composition of liabilities are factors mitigating external risks, but clearly the COVID crisis has left a number of emerging and developing economies with a precarious external position.
The Brookings Institution is financed through the support of a diverse array of foundations, corporations, governments, individuals, as well as an endowment. A list of donors can be found in our annual reports published online here. The findings, interpretations, and conclusions in this report are solely those of its author(s) and are not influenced by any donation.
Authors

-
Acknowledgements and disclosures
The author thanks Manuel Alcala Kovalski for his assistance with the figures.


Commentary
The external wealth of nations 1970-2020: December 2021 update
December 22, 2021