
For the past several years, Gian Maria Milesi-Ferretti, now a senior fellow in the Hutchins Center at Brookings, and Philip Lane, now chief economist of the European Central Bank, have been curating a database [Excel download] on external financial assets and liabilities for more than 200 countries that stretches back to 1970—the External Wealth of Nations. The Hutchins Center is now making the entire dataset widely available online and will update it regularly. The January 2026 analysis of these data can be found here.
Changes relative to the January 20, February 6, and February 27 releases address a few inconsistencies in the data. They resulted in data revisions affecting financial derivatives assets and liabilities, total assets and liabilities, and the net position excluding gold for China, 2015-2024 (modest changes relative to the overall position reported in the February 27 update); total assets and net IIP for Israel in 2024 (relative to the February 6 update), as well as the net IIP for Namibia (2021-24) and marginally for Grenada (2024) (relative to the January 20 update).
What does the External Wealth of Nations (EWN) measure?
The EWN provides estimates of each country’s external financial assets and liabilities. These data also yield estimates of each country’s net international investment position (NIIP), the difference between its total external financial assets and its total external liabilities.
What are external financial assets and liabilities?
External financial assets are claims by domestic residents on nonresidents, consisting of:
- foreign direct investment (controlling stakes by domestic firms in overseas’ affiliates);
- portfolio investment (holdings by domestic residents of stocks or bonds issued by nonresident entities);
- other investment (including loans to or deposit in nonresident entities, trade credits, etc);
- financial derivatives;
- foreign exchange reserves (holdings of liquid foreign-currency assets by the domestic central bank).
Financial liabilities are defined analogously (with the exception of foreign exchange reserves—any liability of the central bank vis-à-vis nonresidents is classified in the liability category corresponding to the nature of such liability). For example, if a U.S. firm has a controlling interest in an Irish firm domiciled in Ireland, that is an external asset of the U.S. and an external liability of Ireland. Similarly, if an Irish individual holds stock in a U.S. firm, that’s an external asset of Ireland and an external liability of the U.S. In accordance with the conventions in balance of payments statistics, external assets and liabilities are defined on the basis of residence, not nationality. For instance, an affiliate of a U.S. bank in the United Kingdom is a U.K. resident, while an affiliate of a Canadian bank in the U.S. is a U.S. resident. Therefore, a deposit by a U.S. resident in the former is an external asset (and thus included in the EWN data), while a deposit in the latter is a domestic asset (and thus not included).
What can the data tell us?
The data for the global economy as a whole provide a way to measure trends in international financial integration and global external imbalances. On a country by country basis, the data provide one measure of the financial ties of an economy with the rest of the world. A country’s NIIP tells us whether it is a creditor or debtor to the rest of the world, which can have implications for external debt sustainability.
Does the EWN database measure a country’s wealth?
No. The data measure only financial claims and liabilities vis-à-vis nonresidents, and hence only the net external component of a country’s wealth. In particular, the data do not include wealth held domestically by a country’s residents. In fact, a country’s NIIP and its overall wealth can move in opposite directions. For instance, an increase in a country’s stock prices will raise the value of domestic wealth, as domestic firms are worth more. At the same time, to the extent that some of a country’s stocks are held by nonresidents, this will also raise a country’s financial liabilities vis-à-vis nonresidents, and hence worsen the NIIP.
What are the most salient trends that the data show over the past decade?
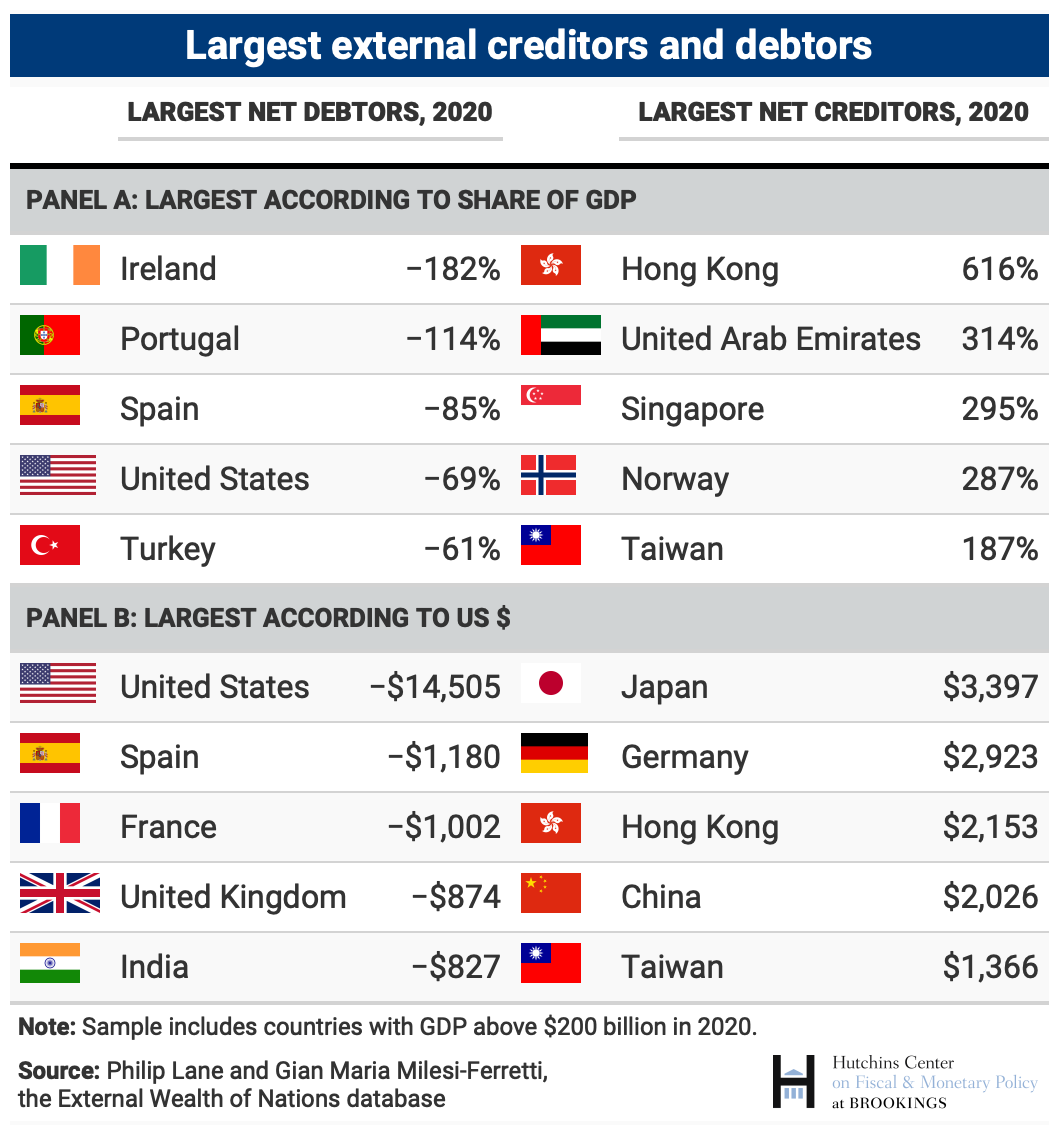
Before the global financial crisis of 2007-8, there was a sharp expansion in cross-border positions which tapered off after 2007 (see Lane and Milesi-Ferretti, 2018). This slowdown primarily reflected weaker capital flows to and from advanced economies, with diminished activity by large banks and a return to fragmentation in euro area bond markets following the 2010-11 eurozone crisis.1 Also at play was a composition effect: The share of global GDP accounted for by emerging and developing economies rose sharply. For those economies external assets and liabilities represent a smaller share of GDP compared to advanced economies, bringing down the aggregate. 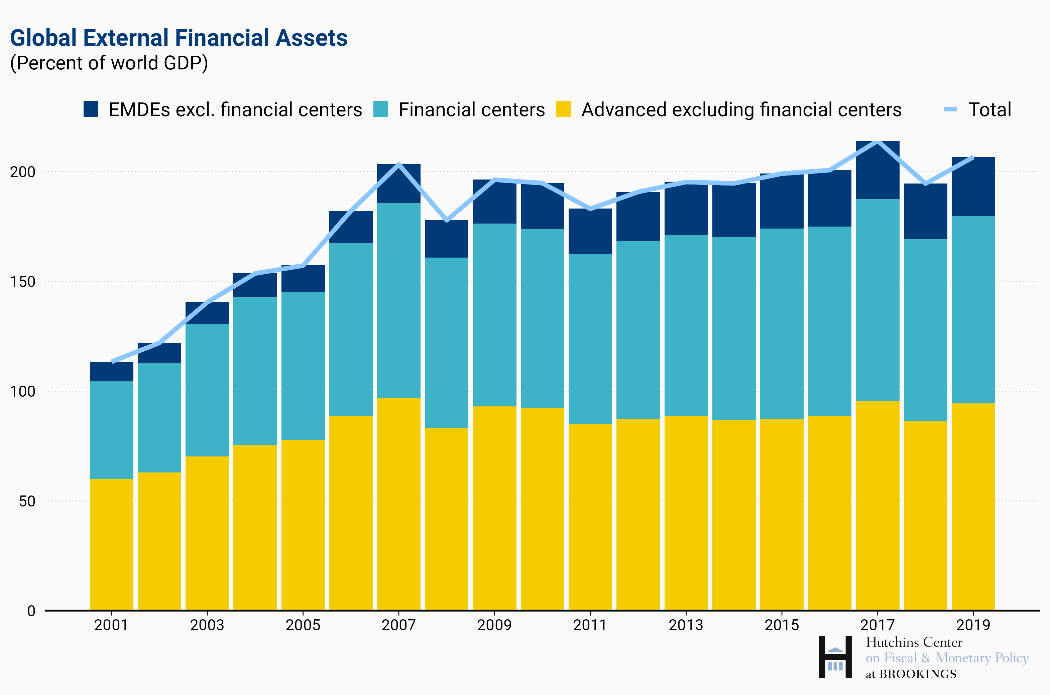 While other forms of cross-border finance shrank after the global financial crisis, global FDI increased sharply, as multinational corporations expanded their network of overseas affiliates. This expansion, in part, reflected greenfield investment (that is, new production facilities as opposed to acquiring existing ones or creating purely financial entities), but an important source of expansion was the proliferation of special-purpose vehicles (pass-through financial entities with no meaningful economic footprint) domiciled in financial centers, designed for regulatory and tax minimization reasons. (For more detail, see Lane and Milesi-Ferretti, 2018, “The External Wealth of Nations Revisited: International Financial Integration in the Aftermath of the Global Financial Crisis,” IMF Economic Review 66, 189-222). The past decade also saw a further widening of global creditor and debtor positions, as described here. In other words, the group of creditor regions (some countries in advanced Europe, advanced Asian economies, large oil exporters, as well as China) accumulated additional net external assets and the group of debtor regions (primarily the U.S. but also some advanced European countries, emerging economies in Europe, Latin America, and emerging Asia) additional net external liabilities.
Who are the world’s largest debtor and creditor nations?
What can the External Wealth of Nations tell me about a particular country?
Consider Canada, a country that has been a net debtor throughout most of the past 50 years, running virtually uninterrupted current account deficits between 1971 and 1998. After running a string of current account surpluses from 1999 onwards, its net external debtor position had been reduced to -9 percent of GDP by the end of 2008, with a modest creditor position in FDI and portfolio equity instruments and a slightly larger net liability position in debt instruments (particularly portfolio debt, also reflecting the attractiveness of Canadian sovereign and corporate bonds for international investors). Since 2009, Canada has run current account deficits again, with a cumulative value of US$567 billion (around 35 percent of 2020 GDP). The financing was primarily through net debt inflows, with modest net outflows in portfolio equity and FDI. Despite its initial debtor position and this additional borrowing, the IIP statistics show that Canada has become a hefty net creditor by 2020, with a net asset position exceeding 60 percent of GDP. How did this come about? Canadian equity investors overseas did very well—world stock prices in U.S. dollars rose by 185 percent between 2008 and 2020, and this boosted the valuation of Canadian portfolio equity and FDI assets abroad. But Canada’s domestic equity markets were much less buoyant, reflecting the less rosy performance of energy and metals: prices rose by 80 percent in U.S. dollars. As a result, Canada’s net creditor position in FDI and equity instruments is now close to 120 percent of GDP (while at unchanged equity valuations it would be around 23 percent of GDP). At the same time, the continued attractiveness of the Canadian bond market has attracted safe haven flows, and its net position in portfolio debt instruments is now around -50 percent of GDP.2
Where can I find your most recent analysis of these data?
The January 2025 analysis can be found here.
Where do the data in the External Wealth of Nations come from?
The primary sources of data are individual countries’ balance of payments (BOP) and international investment position (IIP) statistics, disseminated by the International Monetary Fund. The sole conceptual difference is that our data exclude central bank gold holdings from financial assets (since they are not a claim on another country). The EWN data expand both the time series and the country coverage of IIP statistics to include virtually every economy in the world from 1970 onward, using alternative data and methods to fill in where the IIP data are missing or where IIP estimates may be incomplete or imprecise. With regard to time series coverage, IIP data for India start in 1996, for Brazil in 2001, and for China in 2004. And with regard to country coverage, the EWN database includes economies such as Kuwait, Qatar, the United Arab Emirates, and several Caribbean offshore centers (such as Bermuda, the British Virgin Islands, and the Cayman Islands) that do not publish IIP statistics or publish an incomplete version (excluding the main sovereign wealth fund for Kuwait and excluding most of the offshore sector for Bermuda and the Cayman Islands). These extended statistics rely on a variety of data sources, which includes partner-country bilateral data from the IMF Coordinated Direct Investment Survey and the IMF Coordinated Portfolio Investment Survey (for countries that do not publish estimates of their external assets and liabilities, or publish only an incomplete version); cumulative flows with valuation adjustments; World Bank and IMF statistics on external debt; UNCTAD statistics on foreign direct investment; and a variety of national sources. Useful inputs for historical data are also provided by a book by Stefan Sinn (“Net External Asset Positions of 145 Countries,“ Kieler Studien no. 224, Institut für Weltwirtschaft an der Universität Kiel, Tübingen: J. C. B. Mohr).
If I use this dataset, how should I attribute it?
Please cite this link, as well as Lane, Philip R. and Gian Maria Milesi-Ferretti, 2018, “The External Wealth of Nations Revisited: International Financial Integration in the Aftermath of the Global Financial Crisis,” IMF Economic Review 66, 189-222.
The Brookings Institution is financed through the support of a diverse array of foundations, corporations, governments, individuals, as well as an endowment. A list of donors can be found in our annual reports published online here. The findings, interpretations, and conclusions in this report are solely those of its author(s) and are not influenced by any donation.
Related Content


Author
-
Footnotes
- Cross-border activity by banks was primarily captured in the “other investment” category, which includes loans and deposits.
- Exchange rate changes also matter. Canada’s liabilities are overwhelmingly denominated in domestic currency, while a sizable share of its assets is denominated in foreign currency (primarily U.S. dollars). Hence a depreciation of the Canadian dollar vis-à-vis the U.S. dollar tends to improve Canada’s external position by raising the domestic-currency value of Canadian assets abroad. At the end of 2020, the Canadian dollar was 5 percent lower than at the end of 2008 relative to the U.S. dollar.
The Brookings Institution is committed to quality, independence, and impact.
We are supported by a diverse array of funders. In line with our values and policies, each Brookings publication represents the sole views of its author(s).