Census data shows recent tepid immigrant growth driven largely by Asians and college grads
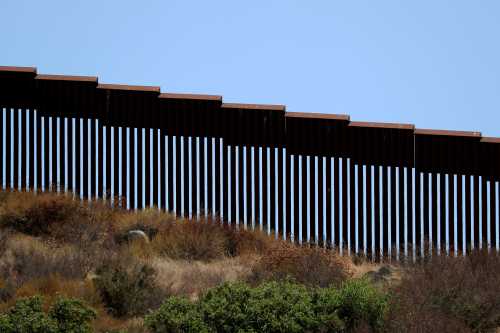
President Trump’s war against immigration is premised on the view that rising numbers of immigrants, especially from Mexico, are stealing jobs from blue-collar workers. It is the basis of his plan to build a 700 to 900 mile wall along the U.S.-Mexican border, and his support for a proposed bill to halve the number of legal immigrants to the U.S. Yet, newly released data from the U.S. Census Bureau’s 2016 American Community Survey (ACS) show that recent foreign-born growth does not at all fit this stereotype. Immigrant growth, thus far this decade, is occurring at a slower pace than the previous two, and is dominated by immigrants from Asia and those with college degrees. Moreover, new Asian and college-educated immigrants are especially prevalent in states that voted for Trump in the 2016 election.
Immigration is not rising rapidly
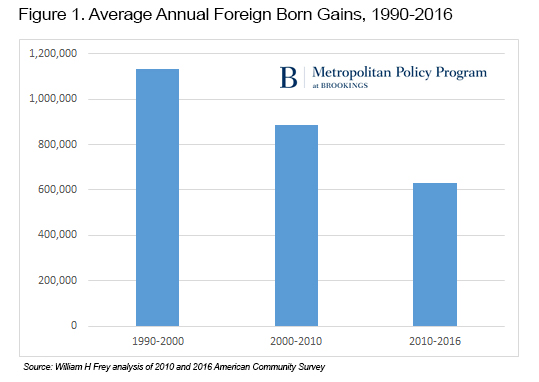
The new ACS data show that there are 43.7 million foreign-born persons in the U.S., a gain of 3.8 million since 2010. Annual gains, though uneven over the 2010-2016 period, were on average lower than those in the 1990-2000 and 2000-2010 decades (See Figure 1). Moreover, the number of foreign-born non- citizens (including both documented and undocumented) have remained relatively flat compared with 2010. This is consistent with Pew Research Center’s calculation of a small net decline of undocumented immigrants over the 2009-2015 period. The foreign-born now constitute 13.5 percent of the U.S. population, unchanged from 2015, and modestly up from 12.9 percent in 2010 (download table 1).
Asians and college graduates dominate recent immigrant growth
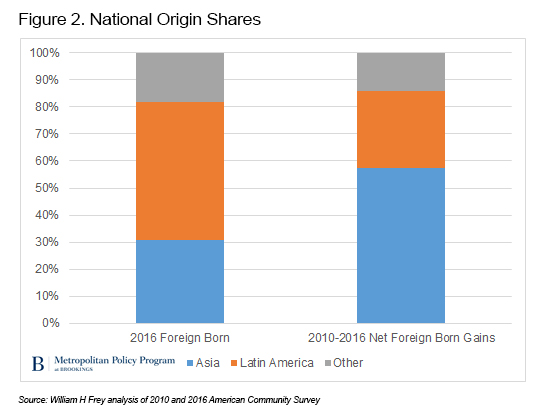
While Latin Americans, especially Mexicans, played a large role in U.S. immigration gains for the decades leading up to 2010, this is not the case now. Past Latin American domination of foreign-born growth has made an imprint on the total foreign-born population, where 51 percent claim Latin American origins (including 26 percent from Mexico), compared with only 31 percent from Asia. However, among net foreign-born gains that the nation experienced over 2010-2016, fully 58 percent come from Asia, compared with 28 percent from Latin America (See Figure 2).
Moreover, while Mexico is still the largest origin nation of the nation’s foreign-born population at 11.5 million, this population sustained a loss of over 135,000 between 2010 and 2016. China, India, and the Philippines, together comprising 53 percent of the Asian origin foreign-born population, gained a net of 1.3 million immigrants over the 2010-2016 period, which accounted for 63 percent of all Asian immigrant growth (download table 2). So far this decade, the greatest immigrant gains come from China, India, the Dominican Republic, El Salvador, Cuba, and the Philippines.
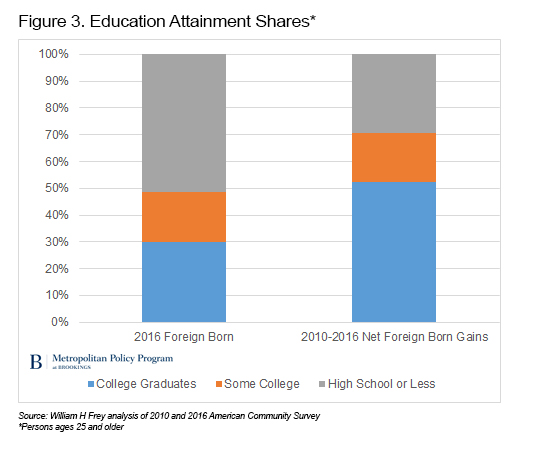
The other noteworthy shift in foreign born demographics is the higher education attainment associated with recent immigrant gains. Again, a comparison between the total foreign-born and 2010-2016 migrant gains is instructive (See Figure 3). Among all 2016 foreign-born adults, ages 25 and older, three in ten hold college degrees and 51 percent have no more than a high school diploma. This nearly reverses for 2010-2016 net migrant gains, for which 52 percent hold college degrees and only 29 percent have not proceeded beyond high school (Comparable numbers for the 2016 U.S. native-born population are 32 percent and 37 percent, respectively).
The newest immigrant gains are even more selective with respect to advanced degrees, which are held by 26 percent of this group (download table 3). This contrasts with 13 percent advanced degree holders among all foreign-born adults and just 12 percent for the U.S. native-born. The trend toward more highly educated immigration, already spotted among 2011-2015 immigrants from abroad, existed, but at much more modest levels in prior decades. It is associated to some degree with the greater in-flow of Asian-origin immigrants, many of whom arrived as students, or as part of a temporary work program such as the H-1B visa. Clearly, the profile of new foreign-born gains–more highly educated and dominated by Asian-origin immigrants–differs from those of earlier decades and negates the stereotype that Trump has promoted.
Differences across states
The new immigration patterns have impacted most states as well but in ways that counter Trump’s areas of support.
The map below classifies states according to high, medium, and low foreign-born concentrations based on their 2016 foreign born percentages. Fourteen “high concentration” states, where the foreign-born percentage equals or exceeds 13.5 (the nationwide value), include large states such as California, Texas, Florida, and New York, and lie mostly on or near the coasts. Twenty-one states (including Washington D.C.), classified as “moderate concentration” states, are located largely in the nation’s interior, including the industrial states of Pennsylvania and Michigan. The 16 “low concentration” states, with foreign-born percentages under 5 percent, are strongly anchored in Appalachia and the Southeast.
This classification scheme is useful not only because it points to states where immigration has and has not made an impact, but also because of its political significance. CNN’s senior political analyst Ronald Brownstein has made the case that the aversion to immigration, and associated support for Trump, is greatest in states where immigrant presence is small, perhaps due to the fear of the unknown. It is, in fact, the case that 14 of the 16 low concentration states (Vermont and Maine excepted) voted for Trump in 2016; and 11 of the 14 high concentration states (Florida, Texas and Arizona excepted) voted for Hillary Clinton. States in the moderate concentration category favored Trump, 13 to 8 (download table 4).
Perhaps even more noteworthy is the fact that Trump-supporting, low concentration states least match Trump’s migration stereotype. This is especially the case with the new Asian immigration surge. Figure 4 compares, for states in each concentration category, the Asian share of their total foreign-born population with the Asian share of their 2010-2016 net migration gain.

While immigrants of Asian origin make up a greater share of new immigrant gains than of all immigrants in each type of state, the difference is largest–82 percent versus 34 percent–in the low concentration category of states. This is the case for 11 individual low concentration states, such as South Carolina where Asians comprised two-thirds of its new immigrant gain, but only 24 percent of its total foreign-born population. Yet, this is not only the case for states in the low concentration category. The majority of individual states in all categories showed that a plurality of their 2010-2016 migrant gains were of Asian origin (download table 4).
A similar comparison can be made with respect to the higher education, among adults, of new foreign-born gains, shown in Figure 5. Here, the comparison for states in each concentration group contrasts the college graduate share of recent immigrants with that of the native-born population. Once again, the biggest difference is shown for low foreign-born concentration states: college graduates comprise 56 percent of 2010-2016 foreign-born gains, while they comprise just 26 percent of the native-born population.

Comparisons for individual states are also noteworthy in light of recent election results. The industrial states of Ohio and Michigan, each won by Trump, show some of the highest “native-born, recent immigrant” disparities in the share of college graduates—28 percent versus 62 percent for Ohio, and 27 percent versus 66 percent for Michigan. Other Trump states with large disparities are the low immigration states of West Virginia, Kentucky, and Tennessee. Altogether, 36 states, including most that voted for Trump, showed “native-born, recent immigrant” college graduate disparities of greater than 10 percent (download table 4). Notable exceptions are located in the Great Plains (North and South Dakota, Kansas, Nebraska, and Oklahoma), as well as Alaska, Nevada, Minnesota, and South Carolina.
Clearly, the Trump stereotype of low-skilled, rapidly growing immigrant waves from Mexico does not characterize recent foreign-born gains to the U.S. The new census ACS numbers showing large Asian and college graduate immigrant growth is evident in the majority of states, especially low immigrant states. Many of those states, which backed the president in 2016, contain communities that are aging, losing domestic migrants, and are already benefitting from the infusion of new immigrants.
These new migration growth patterns can be attributed, in part, to shifting economic pulls of the U.S., new attractions for students, and industry demands for both permanent and temporary workers. Most certainly, there is room for revisiting the nation’s immigration policies to attract needed low- and high-skilled workers and maintain long-standing family and national origin networks, while safeguarding opportunities for all Americans. But those policies and the politics undergirding them should be informed by the changing nature of today’s immigration and should not be rooted in a fictional picture of the past.
Related Content
Author

The Brookings Institution is committed to quality, independence, and impact.
We are supported by a diverse array of funders. In line with our values and policies, each Brookings publication represents the sole views of its author(s).


Commentary
Recent foreign-born growth counters Trump’s immigration stereotypes
October 2, 2017