Back in early 2023—when consensus was that inflation was out of control and the Fed seriously behind the curve—we wrote a paper suggesting that supply chain disruptions from the COVID-19 pandemic were the principal inflation driver and were likely—with a lag—to drive inflation down substantially. That was an out-of-consensus view at the time and argued for a dovish Fed, since inflation would subside mostly on its own. This is largely what happened, and it is now increasingly consensus that the bulk of the COVID inflation shock was about supply, with demand-side factors playing a secondary role.
We are writing a series of blog posts on the COVID-19 inflation shock, emphasizing that the bulk of this shock was due to supply, not demand. Our first post discussed the massive size of supply chain disruptions during the COVID-19 pandemic. They rivaled in magnitude what Japan saw after the Fukushima nuclear disaster in 2011, but post-COVID supply disruptions in the U.S. were felt over a far longer period. This post—our second—shows that supply chain disruptions feed into inflation with long lags, so that supply chain normalization may drive disinflation even now, long after delivery times normalized. Our third post—publishing in a couple of weeks—will update estimates from our 2023 paper and show that much of COVID inflation was due to supply chain effects. That post will also quantify how much disinflation from supply chain normalization is still reasonably in the pipeline.
The twists and turns in post-COVID disinflation
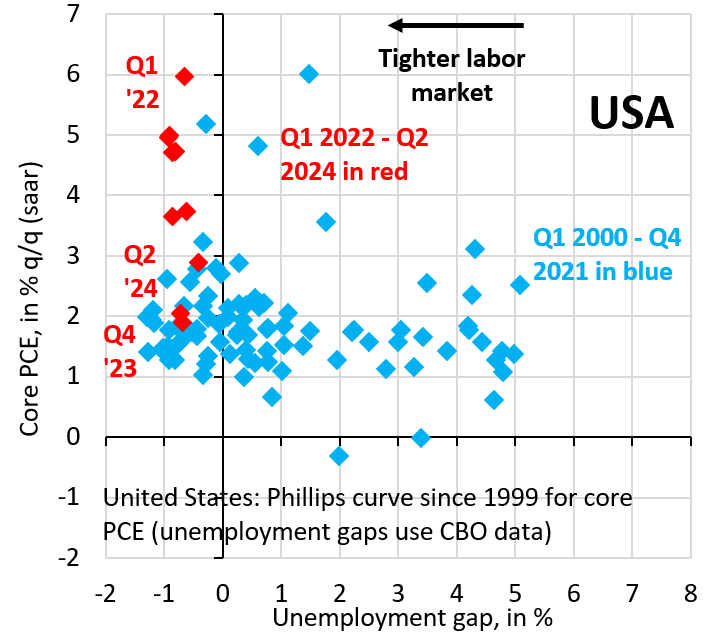
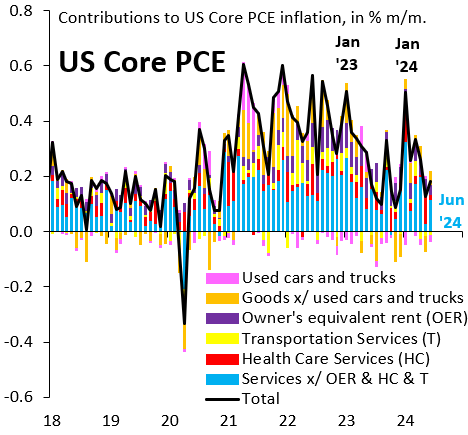
A simple Phillips curve that lines up quarterly core PCE (personal consumption expenditures) inflation against the unemployment gap (a measure of labor market slack) suggests that much of the COVID inflation shock was supply-driven and not due to overheating. After all, inflation rose and then fell with the labor market being quite tight throughout (Figure 1). That said, disinflation has been anything but linear. Start-of-year price resets made inflation look worse than it really was at the beginning of both 2023 and 2024. This residual seasonality hid the fact that underlying inflation had been benign for quite some time, as last week’s latest reading for core PCE inflation showed (Figure 2).
Figure 1. US Phillips curve since 1999 for core PCE
Figure 2. Contributions to US core PCE inflation, in %m/m
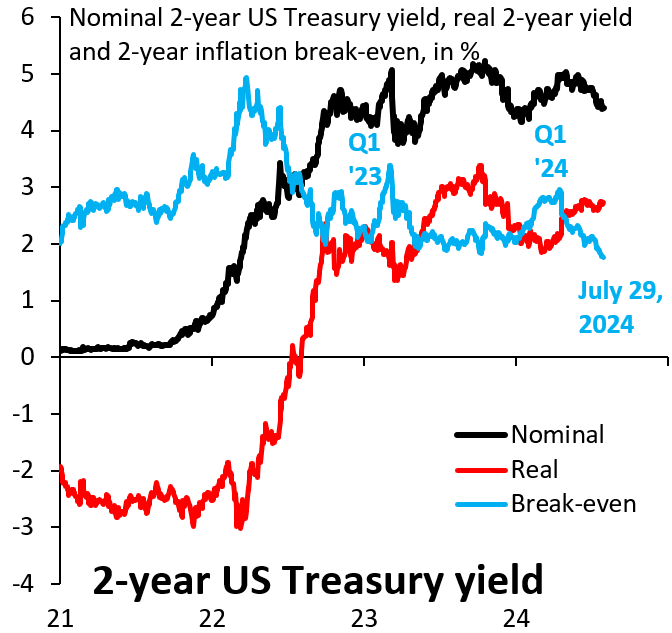
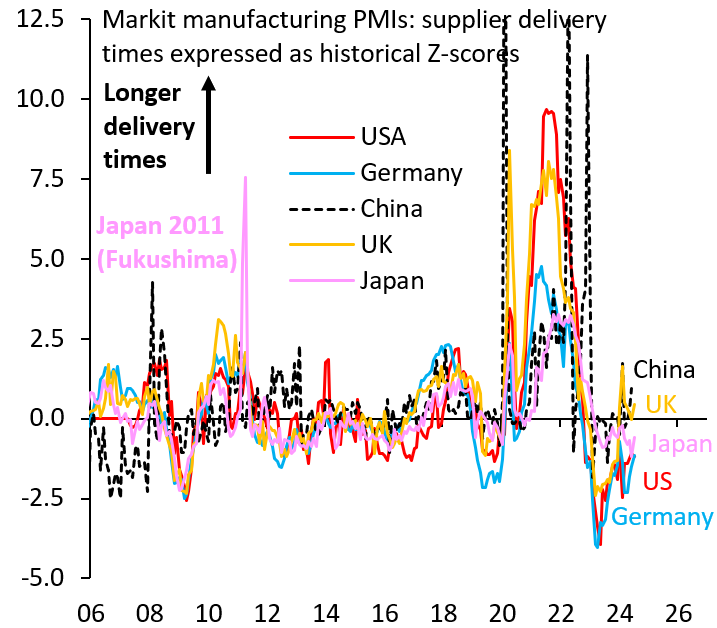
The twists and turns in inflation normalization have been of critical importance to markets and policymakers. The rise in inflation in early 2023 and 2024 drove break-even inflation higher (Figure 3) and caused policymakers at the Federal Reserve to worry they were once again falling behind the curve. The underlying issue, besides recognizing the importance of residual seasonality post-COVID, has been how much weight to put on supply chain normalization as a disinflation driver. As our initial post in this series showed, the basic mistake inflation hawks make—again and again—is to underestimate just how big COVID supply disruptions were. Delivery times in the S&P Global Purchasing Managers’ Index were at or above levels Japan experienced after Fukushima in 2011 (Figure 4), only that COVID disruptions lasted much longer (stretched US. delivery times may also reflect strong demand to some extent). As a result, disinflation from supply chain normalization is a lot more powerful and operates with longer lags than most appreciate.
Figure 3. Nominal 2-year US Treasury yield, real 2-year yield, and 2-year inflation break-even, in %
Figure 4. Markit manufacturing PMIs: Supplier delivery times expressed as historical Z-scores
Lagged effects of supply chain normalization persist
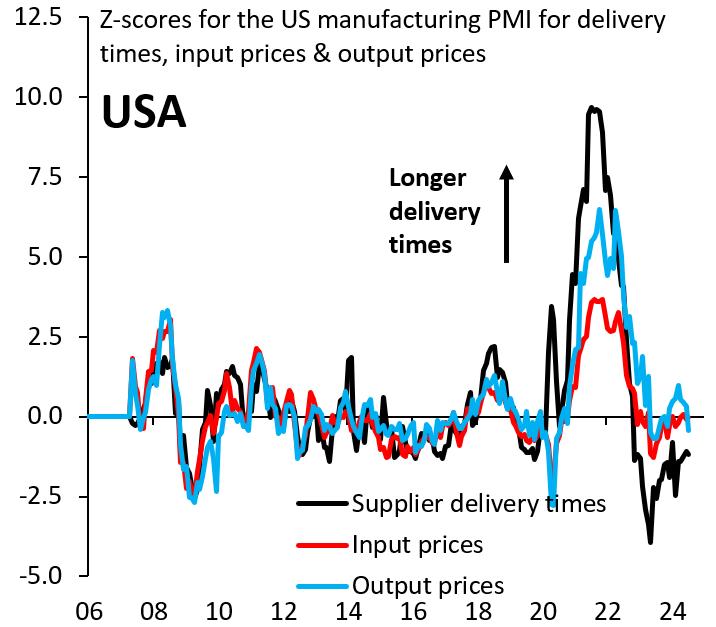
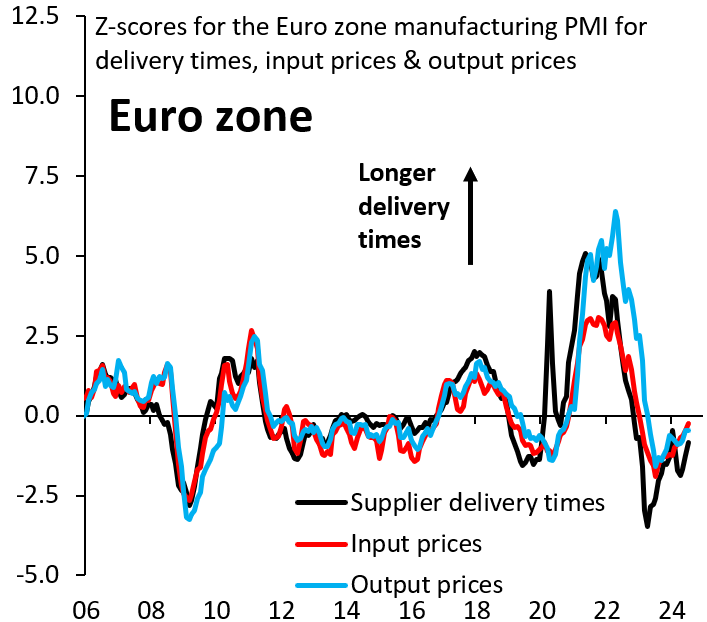
A key issue in interpreting the ongoing flow of inflation data is thus appreciation for the size of COVID supply disruptions and the lags with which supply chain normalization drives disinflation. S&P Global—as part of their purchasing manager indices (PMIs) that span 45 economies—publish monthly balance of opinion surveys on supplier delivery times, input prices (what firms pay suppliers), and output prices (what firms charge customers). (For background on these data, see S&P Global’s explainer.) We turn these data into Z-scores by subtracting pre-COVID means and scaling by pre-COVID standard deviations. We do this for better comparability across different survey measures and countries. Figure 5 shows these three series for the U.S., while Figure 6 shows the same series for the eurozone. Of particular interest to us is the behavior of output versus input prices as delivery times became stretched during the COVID-19 pandemic. In both cases, output prices rose more than input prices, a sign firms raised markups, something they likely did to preserve inventory after severe shortages in certain goods during the early days of the pandemic.
Figure 5. Z-scores for the US manufacturing PMI for delivery times, input prices, and output prices
Figure 6. Z-scores for the eurozone manufacturing PMI for delivery times, input prices, and output prices
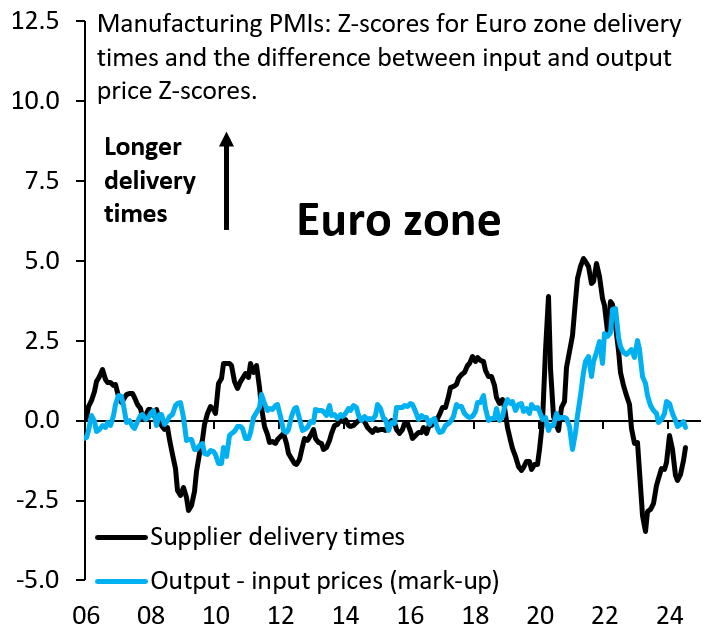
We calculate the difference between our output and input price Z-scores as a proxy for firm margins. Figures 7 and 8 line this proxy up against delivery times for the U.S. and eurozone, respectively. In the run-up to COVID, margins were roughly stable, with output and input prices moving in parallel. This changed as delivery times lengthened during the pandemic. Margins rose with a lag of between six months and one year relative to delivery times. More importantly, unlike delivery times where the pandemic’s impact has faded (our Z-scores have been negative since late 2022), margins in the U.S. are only just starting to normalize (those Z-scores only turned negative in July 2024). This shows how substantial lagged inflation effects from supply chain normalization can be, which means they may be a continued force for disinflation going forward. We will quantify this in our final blog post in two weeks.
Figure 7. Manufacturing PMIs: Z-scores for US delivery times and the difference between input and output price Z-scores
Figure 8. Manufacturing PMIs: Z-scores for eurozone delivery times and the difference between input and output price Z-scores
-
Acknowledgements and disclosures
Peter Orszag is the chief executive officer of Lazard, which provides financial support for Brookings.
The Brookings Institution is financed through the support of a diverse array of foundations, corporations, governments, individuals, as well as an endowment. A list of donors can be found in our annual reports published online here. The findings, interpretations, and conclusions in this commentary are solely those of its authors and are not influenced by any donation.
The Brookings Institution is committed to quality, independence, and impact.
We are supported by a diverse array of funders. In line with our values and policies, each Brookings publication represents the sole views of its author(s).






Commentary
The lagged effects of COVID-19 supply chain disruptions on inflation
August 1, 2024