Newly released census statistics for 2016 confirm that diversity in the United States continues to rise. For the first time, the population under age 10 has become minority white (white non-Hispanic) as the Hispanic, Asian, black, and other racial minority populations continue to rise up the age structure (download Table 1). The new numbers also show that Nevada has joined the ranks of states with minority white populations, along with Hawaii, California, New Mexico, and Texas, as non-white racial groups continue to disperse (download Table 2). Yet one part of the nation continues to stand out for its slow embrace of the diversity surge: the 14 percent of the population that lies outside the nation’s metropolitan areas.
This is noteworthy in light of the huge attention given to nonmetropolitan America in the aftermath of the 2016 election because of its strong support of President Trump. Not only has the nonmetropolitan population remained much whiter than the rest of the nation, it is also getting older faster and shrinking in size. Despite its unmistakable impact on last year’s election, the demography of nonmetropolitan America—distinct from the rest of the country—may limit its long-term political clout.
Nonmetropolitan demographic distinctions: Race, age, and population loss
The sharp racial disparity between the nation’s nonmetropolitan and metropolitan populations can be seen in Figure 1. Since 2000, the white percentage of the nation’s metropolitan population declined from 67 percent to 58 percent, commensurate with the nation’s diversity surge. During the same period, the nonmetropolitan population’s white percentage remained much higher—declining only from 82 percent to 78 percent.

This lack of diversity is fairly pervasive: 1,429 of the 1,974 nonmetropolitan counties are at least 70 percent white. On a state level, of the 47 with nonmetropolitan populations, this same racial breakdown holds true for nonmetropolitan sections of 34 states (download Table 3). The nonmetropolitan populations with the highest proportion of whites are located in broad swaths of the country, including Appalachia, New England, the Midwest, and the upper Rocky Mountain west. Metropolitan versus nonmetropolitan racial disparities are especially wide in states with large urban areas, such as California, New York, and Illinois. Still, there are exceptions. These include southern states from Texas to North Carolina with sizable rural black or Hispanic populations, and others like Hawaii, New Mexico, Arizona, and Alaska with large Native American, Asian, or Hispanic populations.
Nonmetropolitan populations are also older than their metropolitan counterparts. As Figure 2 indicates, the share of the population aged 55 and above—a category that includes most baby boomers and their elders—was already greater in nonmetropolitan areas in 2000. This gap widened in 2016 as one-third of nonmetropolitan residents now belong to this older age category, compared with 27 percent in metropolitan areas. Moreover, nonmetropolitan populations in all states have higher shares of these seniors than their metropolitan area counterparts (download Table 3).

A third noteworthy attribute of the nation’s nonmetropolitan population is its negative population growth. Between 2010 and 2016, it sustained a 0.4 percent decline and a net out-migration of 680,000 people. This contrasts with a nearly 6 percent growth rate and net in-migration for metropolitan areas. Fully two-thirds of all nonmetropolitan counties lost population and nearly three-quarters experienced net out-migration during this period. And in all states except two (Hawaii and Montana), nonmetropolitan areas either declined more or grew less than their metropolitan counterparts (download Table 3).
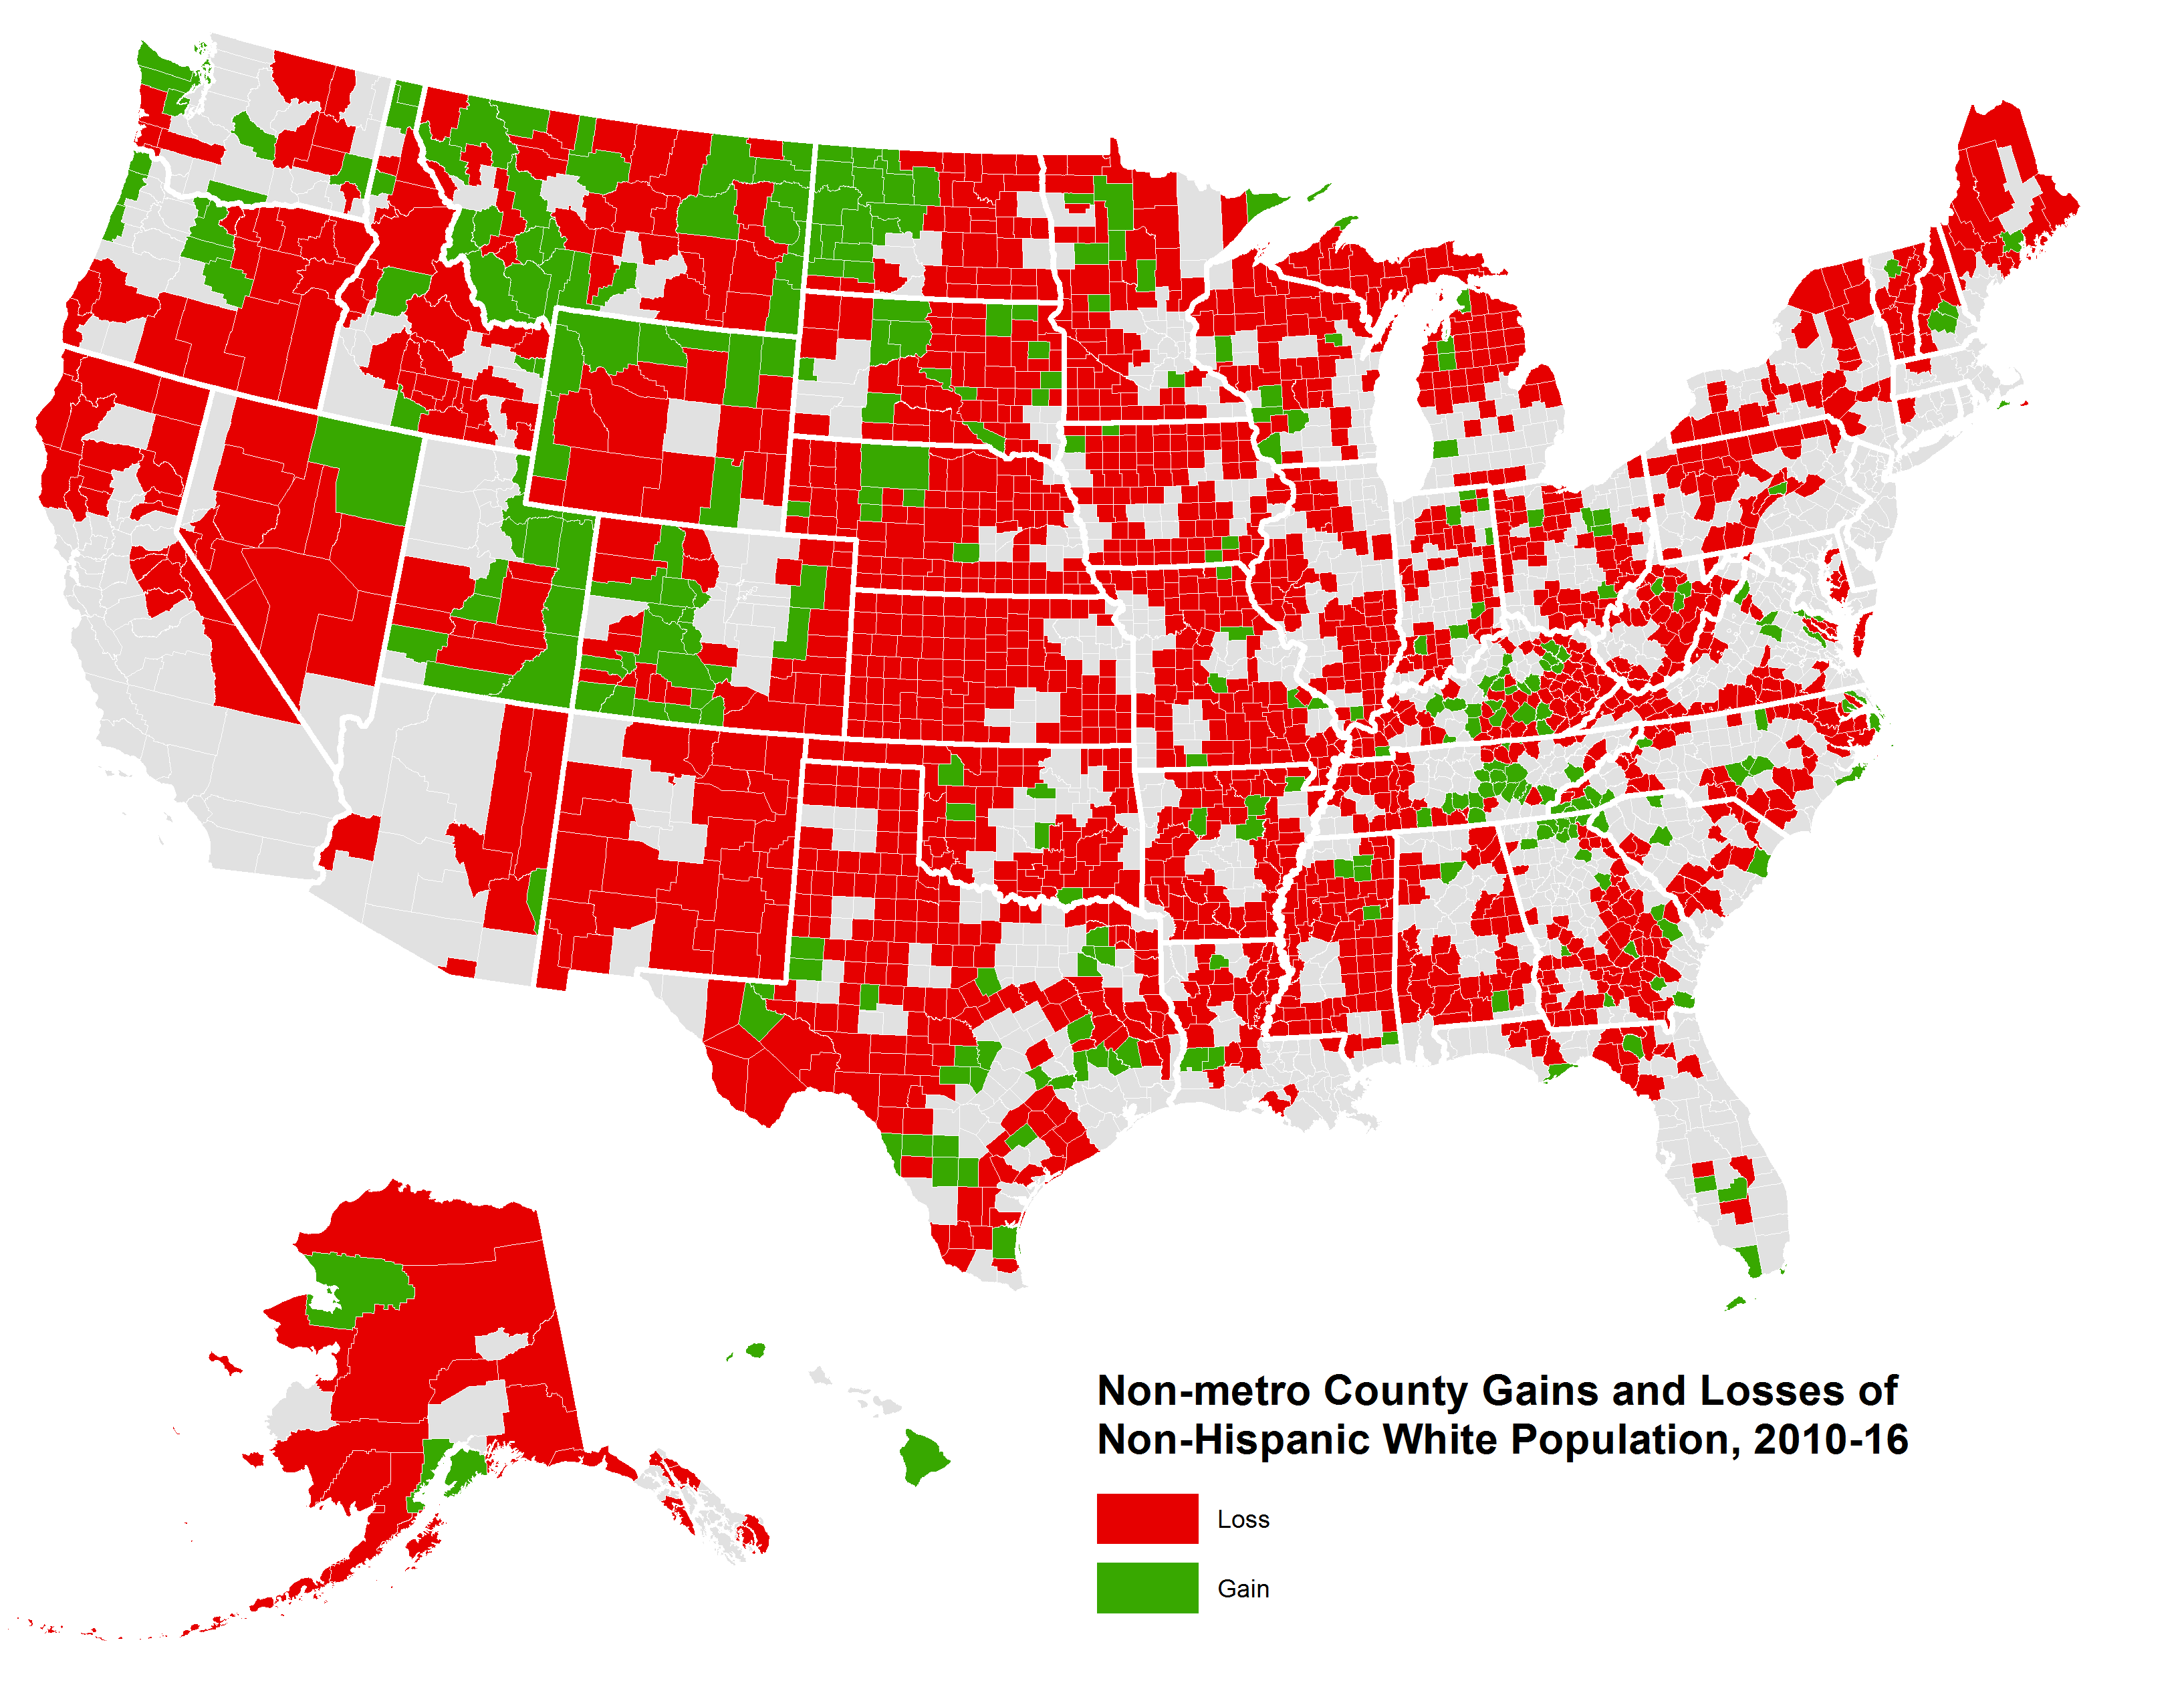
These trends are amplified among the white population. Both out-migration and the aging of white nonmetropolitan residents contributed to an absolute loss of white persons under age 55 (see Figure 3). In fact, as the map below indicates, 84 percent of the nation’s nonmetropolitan counties lost white residents between 2010 and 2016.

White population decline, especially among younger residents, has much to do with the aging of nonmetropolitan America’s population. While many metropolitan areas also exhibited losses of younger whites, nonmetropolitan areas are less likely to benefit from youthful minority gains to counter those losses.
Electoral impacts of nonmetropolitan populations
These small nonmetropolitan populations clearly had an impact on the 2016 presidential election. Nonmetropolitan residents voted for Donald Trump over Hillary Clinton in all but four states: Hawaii, Massachusetts, New Hampshire, and Vermont (download Table 3).
However, nonmetropolitan populations made the biggest difference in Iowa, Michigan, Pennsylvania, Wisconsin, Florida, North Carolina, and Georgia. The strong Trump vote from small portions of the population in these states overcame modest Clinton advantages in large and medium-sized metropolitan areas. In Pennsylvania, nonmetropolitan residents comprised just 12 percent of the population and 10 percent of voters, but Trump’s nonmetropolitan margin of 287,000 votes overtook Clinton’s metropolitan advantage of 243,000 votes.
White (white non-Hispanic) support for Trump was especially noteworthy in nonmetropolitan America. As shown in Figure 4, Trump did well among whites in nonmetropolitan counties, scoring a 58 percent vote margin in counties with nearly all- white populations. His margins exceeded 30 percent in the vast majority of counties—those where white residents comprise more than three-fifths of the population.

Despite constituting a small and declining portion of the population both nationally and in most states, nonmetropolitan voters demonstrated substantial political influence during the latest election cycle. Can this sliver of the population continue to exert such clout?
It will certainly be more difficult. To be sure, there is wide variation among small nonmetropolitan areas—ranging from those with once-thriving farming and manufacturing sectors to those that are investing in newer industries. It is also possible that the population losses seen in many rural areas and small towns in the post-recession period may be less severe as the economy improves. But the new census statistics make plain that this segment of the nation’s population remains distinct on key demographic dimensions in sharp contrast to a much larger, growing and more diverse urban America.
Related Books


Related Content


Author

The Brookings Institution is committed to quality, independence, and impact.
We are supported by a diverse array of funders. In line with our values and policies, each Brookings publication represents the sole views of its author(s).


Commentary
Census shows nonmetropolitan America is whiter, getting older, and losing population
Will it retain political clout?
June 27, 2017