In 2015 U.S. exports declined for the first time since the Great Recession. While national statistics clearly show a short-term weakening, updated data released by the Metropolitan Policy Program on trends in the nation’s 100 largest U.S. metropolitan areas reveals a much more variegated export economy in 2015.
U.S. exports declined for the first time since the Great Recession
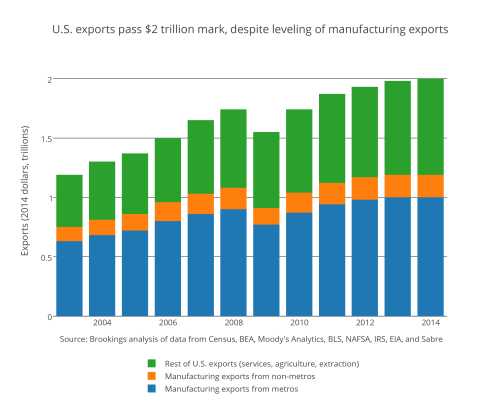
U.S. exports decreased 1 percent (from $1.964 trillion to $1.946 trillion) in 2015 due to of unfavorable exchange rates, slowing growth in typically strong export sectors, and weak international demand. Three sectors that account for a quarter of all exports—transportation equipment, machinery manufacturing, and financial services—posted negative growth rates of -0.3, -11, and -5.4 percent, respectively. While these sectors suffered important setbacks, exports of oil and gas extraction, educational and medical services, and management and legal services expanded by 32, 20, and 8 percent, respectively.
U.S. exports growth, by sector, 2015
 Source: Brookings analysis of data from Census, BEA, Moody’s Analytics, BLS, NAFSA, IRS, EIA, and Sabre
Export of services continue to outperform exports of goods
Services exports, which account for 38 percent of all exports, increased 1.5 percent in 2015 from $721 billion to $731 billion. Six of the 10 major service industries registered export gains in 2015, but this was not enough to overcome declines in goods exports. By comparison, only three of the 25 major goods industries experienced positive export growth. This annual trend reflects the long-term shift in the national export profile. Services exports, in which the U.S. enjoys a dominant position compared to the rest of the world, have doubled in value since 2003 while exports of goods only increased by 50 percent.
In the 100 largest metro areas, which account for 69 percent of national exports, real exports actually increased in 2015 by $158 million to $1.343 trillion. The industries known to be historically strong performers that experienced export reductions from 2014 to 2015 included machinery manufacturing ($-7.2 billion in the top 100 metros), financial services ($-5.3 billion), royalties ($-3.8 billion), and computer and electronics ($-1.6 billion). The strongest sectors in large metros this past year were travel and tourism (gaining $9.4 billion), education and medical services ($5.0 billion), management and legal ($3.5 billion), oil and gas extraction ($3.0 billion), and the tech sector ($1.9 billion). Large metros specializations in these growing service sectors helped contribute to their slightly better performance than the nation as a whole.
Export growth concentrated in the South and West
Export growth varied across the metropolitan landscape in 2015. Mirroring the national decline, a majority (57) of the nation’s 100 largest metro areas experienced annual decreases in real exports. Losses were greatest in the Midwest and Northeast where (despite gains in education and medical services, tourism, and general business services) manufacturing experienced a $22 billion decline. The South shared many similar characteristics with the Northeast and Midwest; however, it benefited from strong growth in commodities, resulting in a net increase of $5.8 billion year-on-year. The West had the most robust export growth, registering $6.1 billion in gains across a diversified export base. Along with commodities, tourism, and general services, the West also experienced gains in the tech sector and heavy engineering. Of the 100 largest metro areas, 43 increased real exports in 2015, led by New Orleans (9.0 percent), Bakersfield, Calif. (7.2 percent), Wichita (6.8 percent), and Baton Rouge (5.4 percent). Among these 43 metro areas, only four were located outside the South and West, and many were reliant on commodities exports. How exports in these commodity-intensive metros respond to declines in global commodity prices in 2016 will be critical to track.

Over the past decade large metro areas have become more reliant on exports to drive growth. The export intensity of the top 100 metro areas—measured as the export share of GDP—has steadily increased from 7.5 percent in 2003 to 11.2 percent in 2014. But that trend ended in 2015, when this figure declined to 10.4 percent, as U.S. metros increasingly relied on a more robust domestic market to drive economic expansion. This trend was pervasive: none of the largest 100 metro areas became more export-intensive. Of course, many metros are still incredibly reliant on exports to fuel growth and create jobs. In 2015, the most export-intensive metro areas continued to be large commodities and manufacturing centers, including Baton Rouge (24.3 percent of GDP), Wichita (19.9 percent), New Orleans (18.7 percent), Seattle (17.9 percent), and Detroit (17.4 percent). And exports are still an important employment driver, supporting 8.4 million jobs in the largest 100 metro areas.
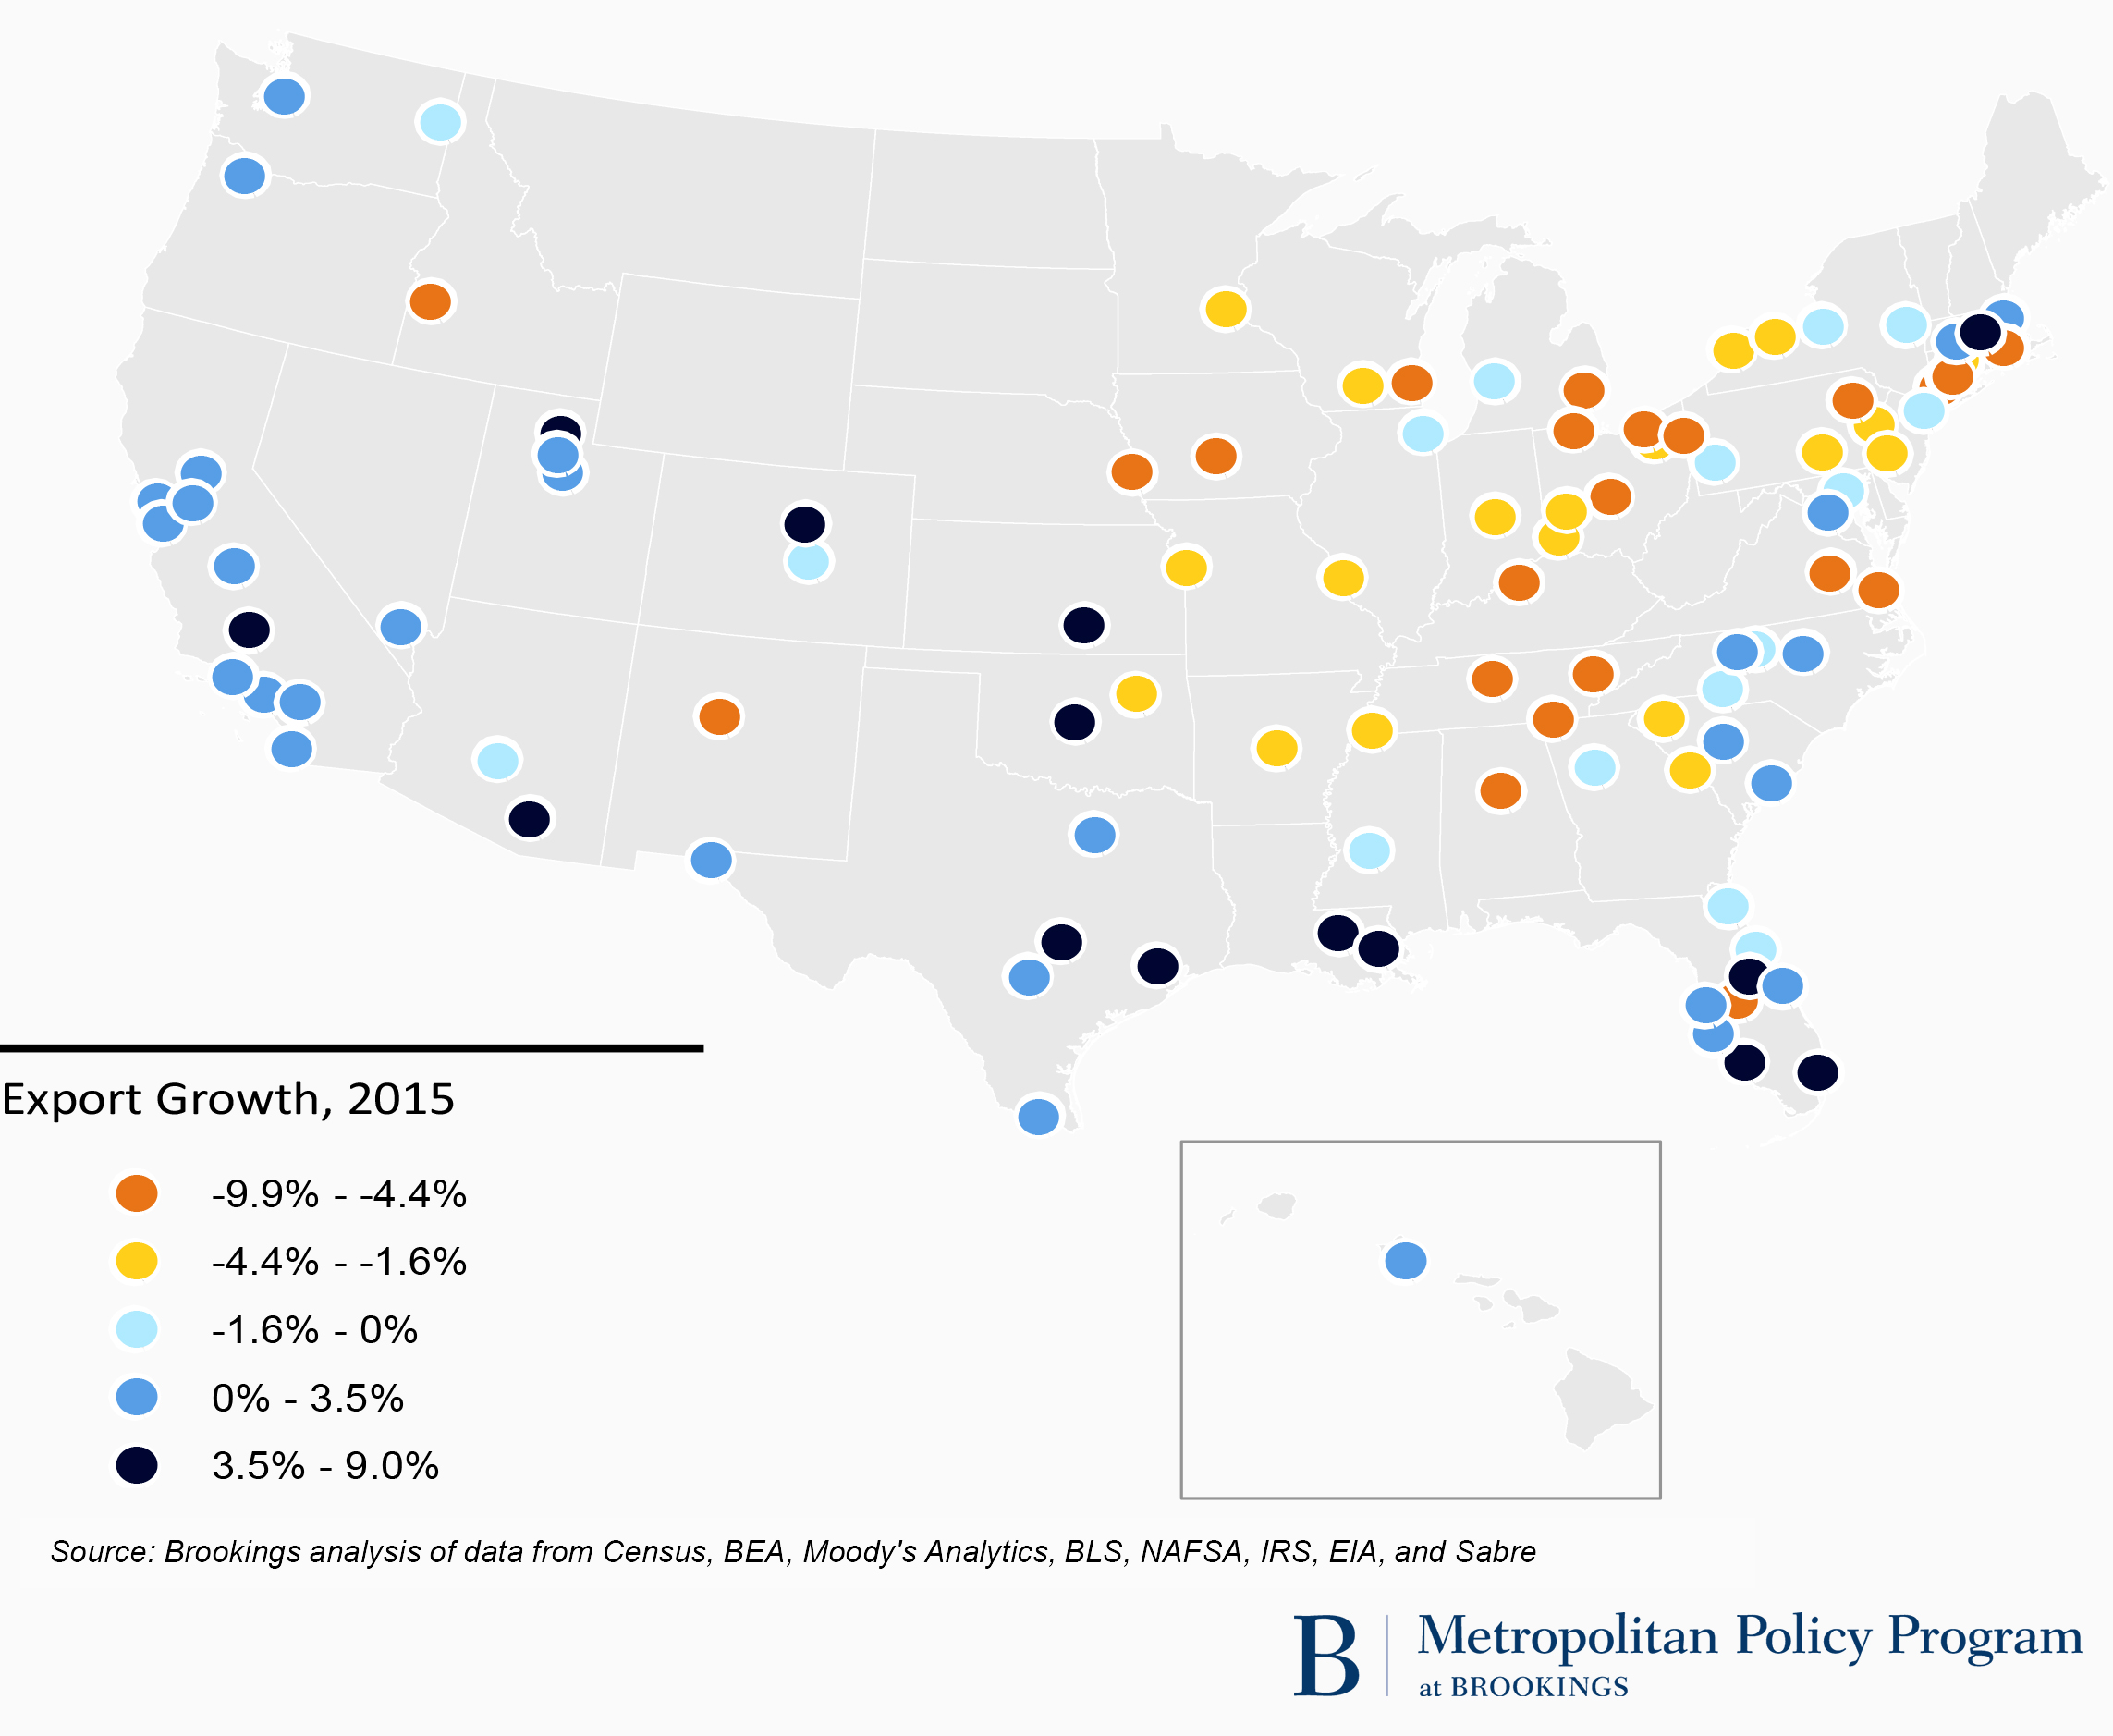
No large metro area became more export-intensive in 2015
Softer global growth and a stronger domestic market coupled with a strong dollar contributed to relatively stagnant export growth in 2015, bucking an upward trend line since the Great Recession. Exports powered much of the post-recession economic recovery in metropolitan America. And, even amid the national export decline, they are still expanding among the country’s largest metro economies as a whole, and quite robustly in the South and West. As leaders across aim to position their metro areas for success in the global economy, these data can help them understand how global currents are influencing their local economies.
Related Content

Related Books

Authors


The Brookings Institution is committed to quality, independence, and impact.
We are supported by a diverse array of funders. In line with our values and policies, each Brookings publication represents the sole views of its author(s).


Commentary
Export Monitor 2016: Large metro areas expand exports amid national decline
September 8, 2016