“Big data” is particularly useful for demonstrating variation across large groups. Using administrative tax data, for example, Stanford economist Raj Chetty and his colleagues have shown big differences in upward mobility rates by geography, by the economic background of students at different colleges, by the earnings of students taught by different teachers, and so on.
The basic message here is that when it comes to understanding how to promote more opportunity, it’s dangerous to make generalizations. For any given national trend or picture, there will be places, people, or institutions that do much worse than the average—and plenty that do a lot better.
A few weeks ago, Raj Chetty stopped by Brookings to present on his most recent research. After his presentation, he joined me and Adrianna Pita on the Intersections podcast to discuss how big data helps us understand diversity within populations—or as academics would say: helps us demonstrate heterogeneity.
You can listen to the podcast here. If you missed Chetty’s presentation, you can watch video from the event.
Chetty’s not the only one working with large datasets, of course. Stanford’s Sean Reardon has assembled huge datasets of test score results, at different points in time, for schoolchildren across the nation. Armed with 300 million test scores across more than 11,000 school districts, Reardon looks, for example, at results in Grade 3 and Grade 8. As you would expect, the school districts with lower scores at Grade 3 are more likely to be lower-income areas, and also to have lower scores at Grade 8.
More interesting in terms of policy, however, are the departures from this story. The chart below shows where the 100 largest school districts place in terms of achievement in Grade 3 and achievement growth between Grades 3 and 8. (The size of each bubble corresponds to the district’s population). Districts in the upper-right quadrant, like Plano Independent School District, have high initial achievement as well as high growth; districts in the upper-left, like Chicago, have low initial achievement but high growth; and so on.
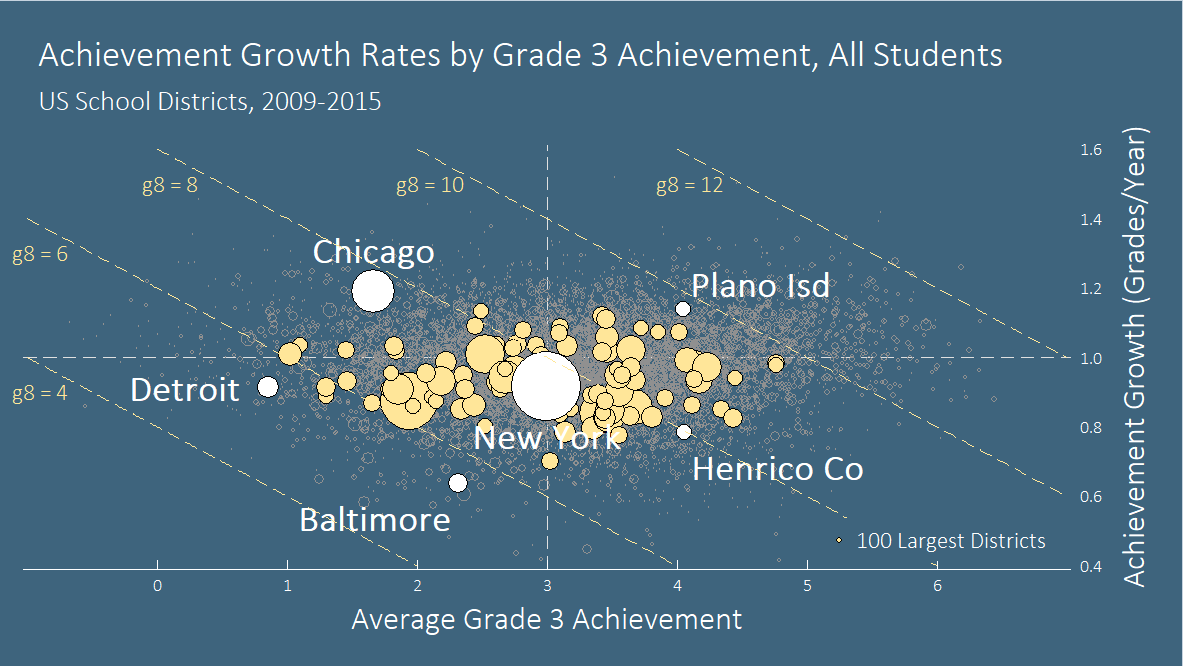
Examining the data by district allows us to see that while third-graders in Baltimore and Chicago start with similar achievement levels, by eighth grade, the Chicago students have jumped ahead. Chicago eighth-graders score at about the same level as those in New York and Henrico County, despite starting from a lower base. (Districts that fall on the same diagonal line have the same average eighth-grade achievement level).
“The socioeconomic profile of a district is a powerful predictor of the average test score performance of students in that district,” says Reardon. “Nonetheless, poverty is not destiny: There are districts with similarly low-income student populations where academic performance is higher than others. We can – and should – learn from such places to guide community and school improvement efforts in other communities.”
The work of big-data scholars like Reardon and Chetty helps to illuminate the scale of the challenge of improving upward mobility for low-income kids. But the heterogeneity also gives hope, too. We can identify institutions or cities that are bucking the trend in a positive direction: and see what we can learn from them. Big data then becomes a tool not only for describing the world, but changing it.
Related Content

2018

Authors


Commentary
Hope in heterogeneity: Big data, opportunity and policy
February 1, 2018