Editor’s Note: This post is part of a discussion on the net benefits of low and no-carbon electricity technologies. Discussants include Charles Frank, a nonresident senior fellow in Global Economy and Development at Brookings and Amory Lovins, cofounder and chief scientist of the Rocky Mountain Institute.
In my previous blog, I dealt with the assumptions used for capacity factors and capital costs. In this article, I deal with the issues that Mr. Lovins has raised regarding nuclear costs and avoided costs.
Nuclear Costs. Mr. Lovins asserts that my paper uses “below-market nuclear capital costs.” He cites no cost references. Mr. Lovins mistakenly assumed I used $9.22/MWH for the operating cost of a nuclear plant. Actually, combined energy and capacity costs in my paper are $21.07/MWH. In addition to $9.22/MWH, I added a fixed O&M cost of $93,280 per year ($11.85/MWH).
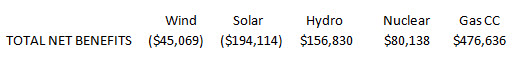
Mr. Lovins asserts that Nuclear Energy Institute (NEI) data on nuclear operating costs are better than the EIA nuclear data that I used. Taking account of ongoing capital investments in upgrades, NEI estimates a total running cost of a nuclear plant of $44.17/MWH versus $21.07/MWH from the EIA data. Mr. Lovins makes a good case for the NEI data, which reduce the net benefits of a nuclear plant from $261,262 to $80,138, still above the net benefits of both wind and solar.
Avoided Capacity Costs. Mr. Lovins argues that I should not use avoided capacity costs as part of my calculations because in the U.S. there is excess capacity. However, it is instructive to calculate benefits in both excess capacity and constrained capacity situations.
If there is excess capacity, then an increase in any capacity can be justified only if lower energy cost and reduced CO2 emissions can cover the capacity cost. However, if we strip out avoided capacity cost from the net benefits calculations, the result is as follows:
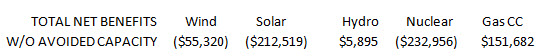
Wind, solar and nuclear plant investments have negative net benefits – and cannot be justified on the basis of avoided emissions or avoided energy costs alone. An increase in the price of carbon dioxide emissions from $50 to $71 per ton makes wind net benefits greater than zero and to $190 per ton makes solar net benefits greater than zero. At carbon prices of $71 and $190 per ton, however, the net benefits of gas CC increase to about $250,000 and $835,000, respectively.
Avoided Cost Methodology. Mr. Lovins criticizes me for not using the more traditional means of determining the capacity value of a new plant — an hour-by-hour (or part of an hour) simulation of a specific grid system. My approach is more analytical and not system specific.
When a new wind or solar plant is introduced into a capacity-constrained grid system to meet an increase in MWH demand, the reliability of the system will decline. The loss of load probability will increase, because the variance in output of a new solar or wind plant is normally greater than the variance in output of existing thermal plants.
For example, suppose a 100 MW coal-fired plant with an average capacity factor of 90 percent can operate at a capacity factor of 85 percent or more 99 percent of the time; and 300 MW of wind have an average capacity factor of 30 percent and are capable of operating at a capacity factor of 17 percent or more 99 percent of the time. Under these circumstances, 500 MW of wind could be relied upon to generate 85 MWH (500 x 17 percent) 99 percent of the time and 100 MW of coal could also be relied to generate 85 MWH (100 x 85 percent) 99 percent of the time. Thus, the avoided capacity cost per MW of wind is one fifth of the capacity cost per MW of coal. Avoided capacity cost is estimated by using the ratio of the “adjusted capacity factors” (85 percent and 17 percent or five to one) rather than the ratio of average capacity factors (90 percent and 30 percent or three to one).
Professors Rioichi Komiyama and Mitsutune Yamaguchi of the University of Tokyo have kindly shared with me estimated output levels at ten-minute intervals for wind and solar plants in Japan based on meteorological data for 2007. The average capacity factor for Japan solar during August peak hours from 11am to 3pm was 55.8 percent. Using the Beta probability distribution, the adjusted capacity factor for August on-peak hours was 19.6 percent, meaning Japanese solar plants together could generate a capacity factor of 19.6 percent or more 99 percent of the time during peak hours. For wind on-peak the average was 33.1 percent and the adjusted on-peak capacity factor was 19.5 percent. For solar and wind during off-peak hours the average capacity factors were 9.9 and 19.0 percent, respectively, but the adjusted capacity factors were virtually zero (less than one-thousandth of one percent).
Using the Japanese ratios between capacity factors and adjusted capacity factors, and between peak and off-peak capacity factors, on US data, we obtained the following results:
These results are a combination of (a) a small decrease in the benefits of reduced CO2 emissions due to lower off-peak capacity factors for replacing high carbon intensity coal production, largely offset by (b) a small increase in avoided energy costs due to higher on-peak capacity factors for replacing energy-inefficient peaking plants, and (c) a large reduction in the net benefits of avoided capacity costs (about $80,000 for wind and $35,000 for solar) due to the higher variability of solar and wind production over ten-minute intervals compared to the annual intervals I used in the working paper.
Conclusion. The use of NEI rather than EIA data does have a significant effect on the net benefits of nuclear, which, however, remain well above those of wind and solar. Adjusted capacity factors derived from output data based on ten-minute intervals, rather than annual intervals, significantly reduce avoided capacity costs and net benefits of wind and solar.
The Brookings Institution is committed to quality, independence, and impact.
We are supported by a diverse array of funders. In line with our values and policies, each Brookings publication represents the sole views of its author(s).


Commentary
Alternative Energies Debate—More Data Improvement, Same Results: Nuclear Costs And Avoided Costs
September 8, 2014