Despite the government shutdown, job creation was much stronger than expected in October, recording a 204,000 jump versus consensus expectations of 120,000. While furloughed government workers were included in the employment count, analysts were focused on the private employment number which was forecast to be weak (125,000) partly as a result of furloughed government contractors who would not be included in the payroll count. Furthermore, people were concerned that the dysfunction in Washington would squelch hiring plans.
In contrast to these fears private employment jumped 212,000 and upward revisions to August and September added an additional 60,000 jobs. All of this suggests a much more resilient economy than many had expected and likely puts Fed tapering back on the table. Fortunately for the Fed there is lots of time and data releases to chew on between now and the December 17-18 FOMC meeting, including the November employment report. If this data confirms the strength exhibited by today’s employment report, the markets may get the lump of coal they fear. Whether the fear of tapering amidst a stronger economy is justified will be left for a future discussion.
Over the last three months, private employment has grown a very respectable 190,000 (Figure 1), reversing what looked to be a summer slowdown in employment. The strength in employment was evident across the board, with every sector of the economy increasing hiring except the federal government which continues to shed jobs. Construction payrolls notched another double digit gain after weakness in the spring and early summer (Figure 2). After being a drag on the economy, the rebound in real-estate could have far reaching affects. One potential red flag is the recent weakness in temporary help hiring (Figure 3). Temps tend to be a leading indicator of future employment. The temp slowdown may have been driven by fears and then the realization of the government shutdown, or is a potential harbinger of future softness.
Figure 1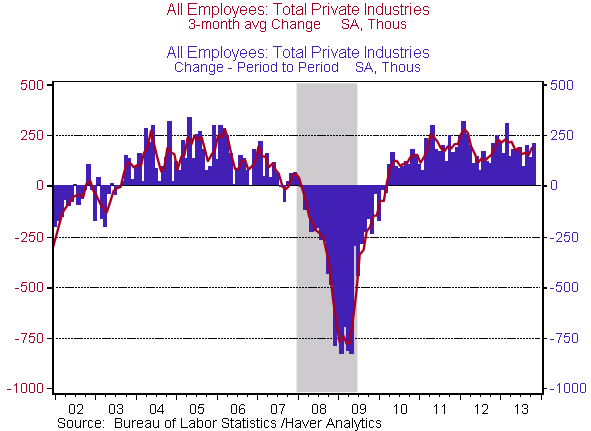
Figure 2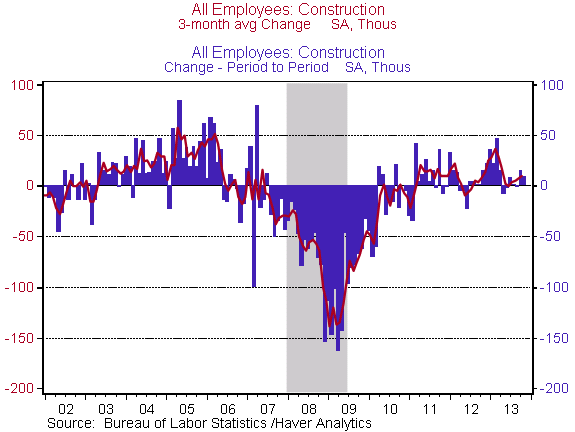
Figure 3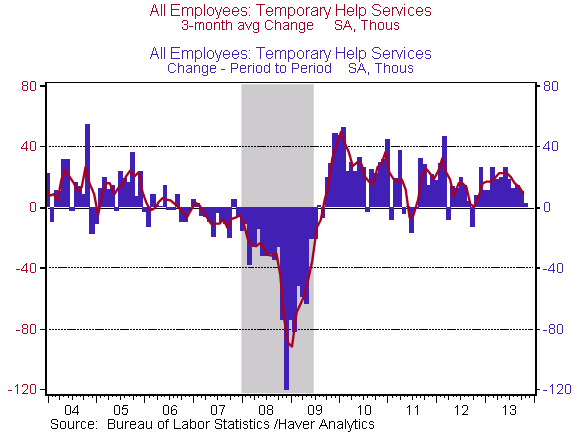
The unemployment rate, which comes from a survey of households rather than businesses and included furloughed government workers as unemployed increased the expected 0.1% to 7.3% (Figure 4). The household survey of employment, which tends to be much more volatile than the payroll survey, showed employment plunged by 735,000. Though likely the result of the furlough and the unemployment rate would’ve risen further had it not been for a 720,000 drop in the labor force. If household employment follows the trend of the payroll report, the unemployment rate should continue its descent in coming months.
Figure 4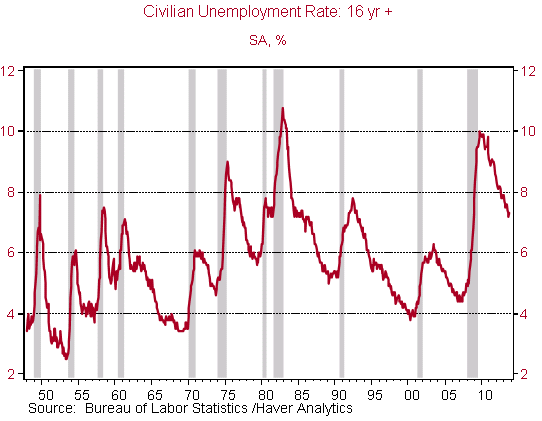
One of the most striking features of the current recovery has been the decline in the Labor Force Participation rate, which tumbled 0.4 percentage points in October (Figure 5). Some of this drop is likely the result of the furlough and should be reversed in November. However, much of the steady decline over the last five years has been the result of discouraged workers who lost their jobs and have been unable to find a new ones. This is most evident in the continued elevated rate of long-term unemployed (Figure 6). While the short-term unemployment rate has declined to normal levels, the long-term unemployment rate remains above the peak levels of the last 65 years.
Figure 5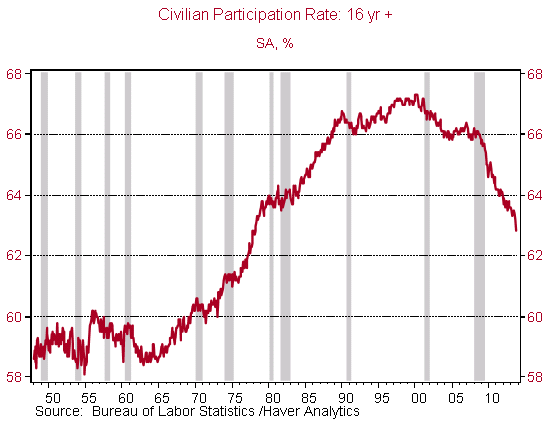
Figure 6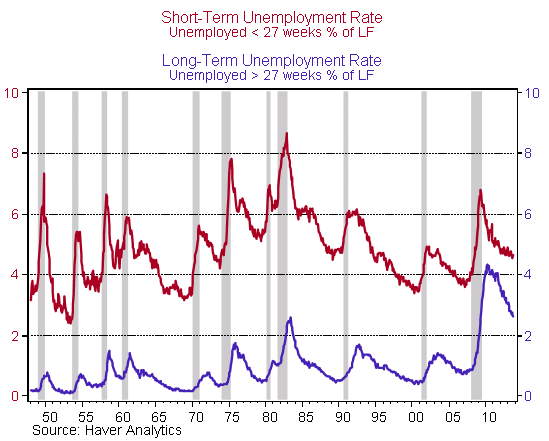
However, there is a structural explanation for some of the decline in the Labor Force Participation Rate – demographics. As people age beyond 55 they tend to drop out of the labor force (Figure 7).[1] As the baby boomers are approaching traditional retirement age it is not surprising that the official labor force participation rate for people aged 16 and above is falling. I estimate that demographics has accounted for roughly one-third of the decline in the official participation rate. Figure 8 graphs the official participation rate and the post-collegiate through traditional retirement age rate. By taking that 25-64 snapshot, I adjust for the recent decline in college-age labor force participation which may have been the result of increased acknowledgement of the higher returns of a college education. More importantly, I correct for the movement of the baby boomers into lower participation rate ages. By indexing the participation rates to 2008, it is clear that the demographically adjusted participation rate has declined less than the official participation rate. In my opinion it is less likely that those baby boomers who have reached retirement age will return to the labor force. This implies that some of the increase in the labor force that policy makers expect to keep the unemployment rate elevated may not materialize. In other words the Fed’s 6.5% unemployment rate guidance level may come sooner than they expect.
Figure 7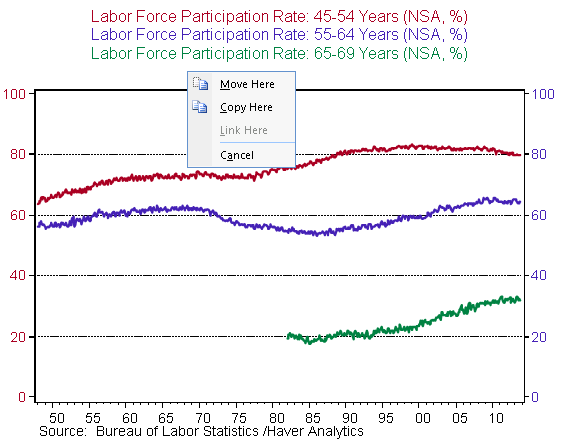
Figure 8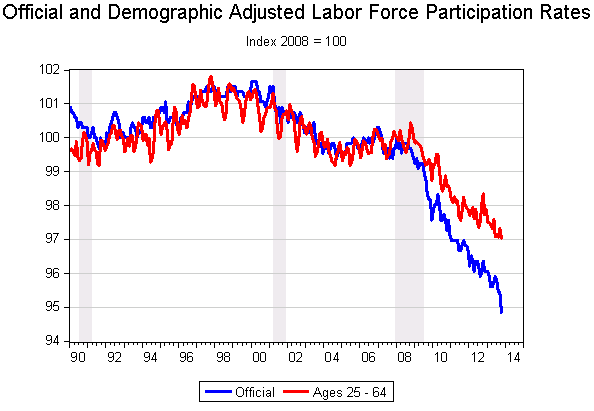
[1] It is notable that the participation rate ages 55+ has been rising, likely the result of better health care and increased life expectancy.


Commentary
Resilient Job Market Puts Fed Tapering Back on Table
November 8, 2013