American schools found themselves immersed in politics this year. A wave of anti-gun violence demonstrations swept the nation following the shooting at Marjory Stoneman Douglas High School, controversial federal policies aroused fear and concern for undocumented students, and teacher rallies and strikes flared up across the country. This occurred amid broader unrest and polarization, with many Americans expressing concern about the state of our politics and the cohesiveness of our society.
In this environment, are U.S. schools equipping students with the tools to become engaged, informed, and empathetic citizens? Are they equipping some students—or groups of students—better than others?
The 2018 Brown Center Report on American Education endeavors to answer these questions, and others, with three separate analyses of issues related to civics education. Chapter 1 analyzes trends in students’ civics scores (as well as math and reading) on the National Assessment of Education Progress (NAEP); Chapter 2 examines state policy related to civics education; and Chapter 3 provides a look at the nation’s social studies teachers. Read on for highlights of the report.
Trends in NAEP math, reading, and civics scores
The first chapter explores trends in student performance on NAEP assessments from the late 1990s through the most recent year in which results are available: 2014 in civics, 2017 for math and reading. Math scores climbed sharply in No Child Left Behind’s (NCLB’s) early years, but scores have largely plateaued since then. Scores follow this pattern in fourth-grade reading, but eighth-grade reading scores show slight gains recently after remaining flat initially.
Despite social studies not featuring prominently in NCLB testing requirements, scores on NAEP civics assessments have remained steady or climbed slightly. However, analysis shows that there are wide and persistent gaps by race, ethnicity, and income in civics. As of 2014, the white-black gap was 0.83 standard deviations (SD), the income gap (based on free and reduced-price lunch eligibility) was 0.82 SD, and the white-Hispanic gap was 0.71 SD. These gaps equate to multiple years of academic learning.
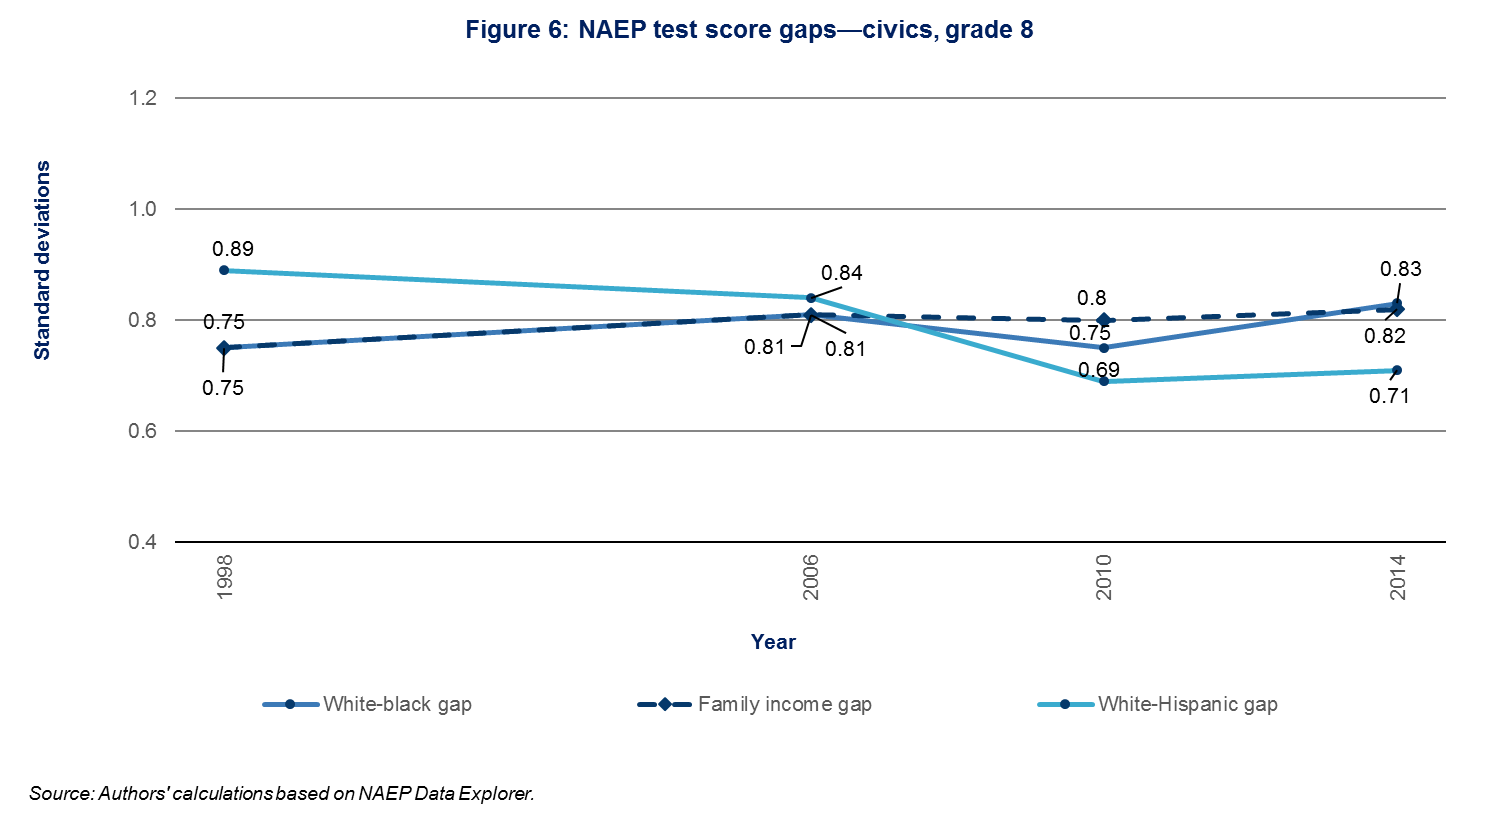
“The size of these gaps is disconcerting,” the authors write. “Civic participation affords political power, and broad participation is essential for a healthy, inclusive democracy.” Recent U.S. education policy has focused narrowly on student performance in core academic subjects, specifically math and reading. However, the Every Student Succeeds Act, which replaced NCLB in 2015, has the potential to change that, granting greater flexibility to states in designing their accountability systems.
A 50-state inventory of state civics requirements
In the second chapter, the authors analyze the extent to which states have incorporated recommended practices into requirements for civics education, compiling an inventory that spans all 50 states and Washington, D.C. After review, 42 states plus Washington, D.C., require at least one course related to civics education as a high school graduation requirement; most states require two or three. However, only about half have incorporated participatory elements of learning or community engagement, such as mock trials, into their standards. While discussion and knowledge-building components of civics education appear frequently across states, participatory elements and community engagement appear less common.
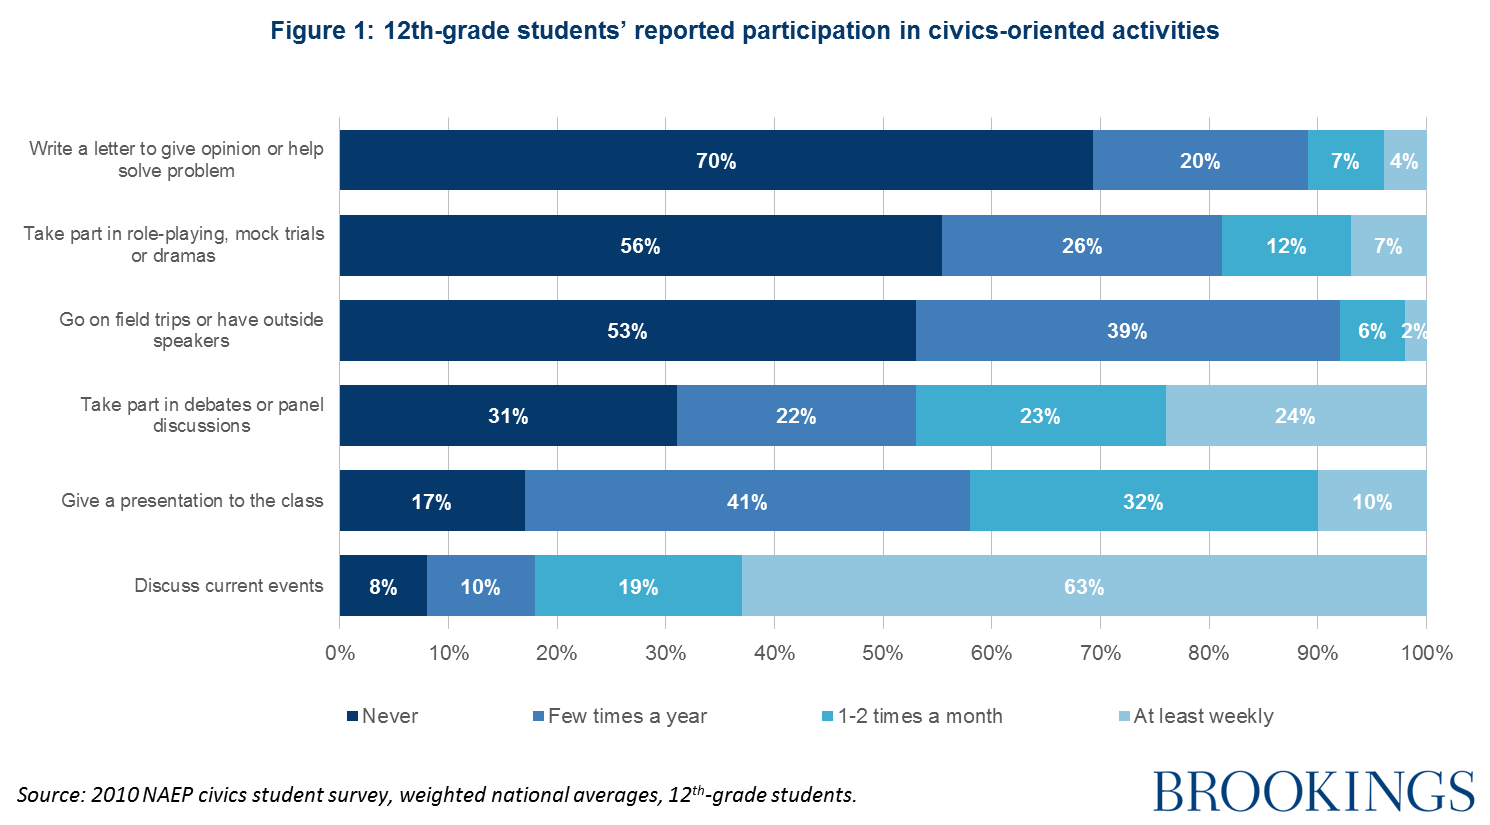
In addition, the authors look at survey data to investigate whether student experiences reflect these practices. About 63 percent of 12th-grade students report discussing current events on at least a weekly basis. But only 24 percent report taking part in debates or panel discussions on a weekly basis, while 31 percent report never participating in this type of activity. This is a concern, the authors write, “given the sentiment among civics education experts that a high-quality civics education is incomplete without teaching students what civic participation looks like in practice and how citizens can engage in their communities.”
Understanding the social studies teacher workforce
The final chapter of the 2018 Brown Center Report focuses on the state of America’s social studies teachers. By presenting statistics on the demographics, qualifications, responsibilities, compensation, and satisfaction of high-school social studies teachers, the authors reveal how these educators differ from other subject-specialized teachers.
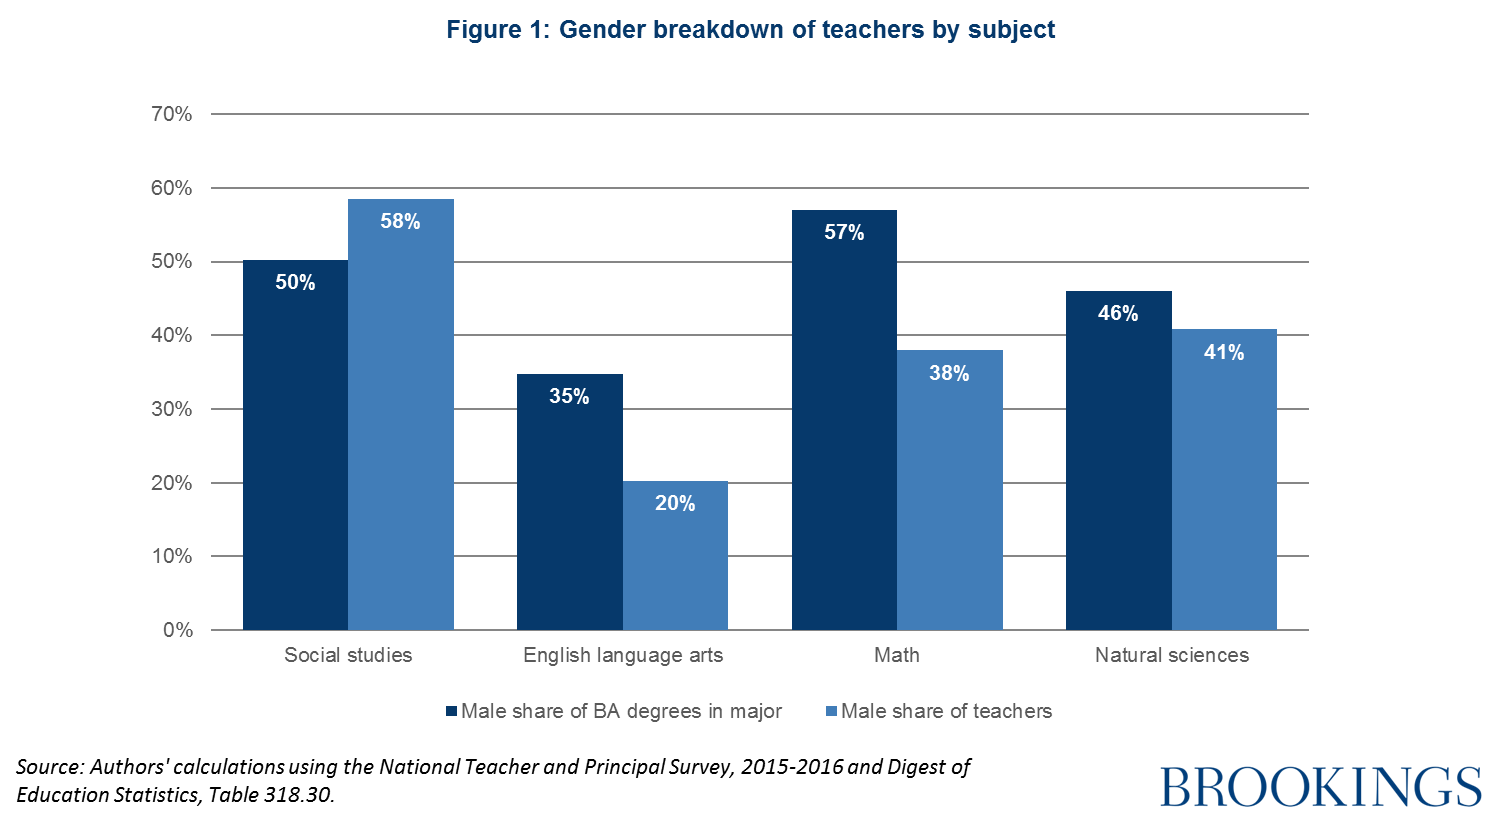
Synthesizing existing research with original analysis of nationally representative survey data, the authors make several discoveries about the nature of American social studies teachers. Well over half—58 percent—of social studies teachers are male, compared to 41 percent of natural science teachers, 38 percent of math teachers, and 20 percent of English language arts (ELA) teachers. They also take on responsibilities outside of the classroom more often, including coaching. In fact, 35 percent report having coaching responsibilities, versus 23 percent of natural science teachers, 21 percent of math teachers, and 15 percent of ELA teachers. “These patterns suggest schools may often be looking for candidates that can fill multiple roles beyond the classroom when hiring social studies teachers, which seems less the case for vacancies in other subjects.”
Despite several differences, social studies teachers are similar to other teachers on a number of dimensions, including teachers’ age and experience levels, course load, working hours, and satisfaction with their school. Therefore, it is important not to overstate these disparities to truly understand America’s social studies educators. The authors conclude, “By understanding the teaching force we have in social studies and comparing it with the teaching force we might need, we can better answer questions about which policies and practices would strengthen the social studies teacher workforce.”
The full report
These chapters provide a portrait of how complex and varied civics education is in the United States, using student performance, state policies, teacher characteristics, and survey results as windows into students’ experiences. Overall, the 2018 Brown Center Report argues that education policy and practice in the United States should place greater emphasis on schools’ role in supporting and strengthening American democracy.


Commentary
A portrait of civics education in the United States: The 2018 Brown Center Report
June 27, 2018