
The following is the first chapter of the 2018 Brown Center Report on American Education.
The National Assessment of Educational Progress (NAEP) regularly gauges the academic achievement of nationally representative samples of students. Commonly referred to as the “Nation’s Report Card,” it has become the most prominent appraisal of the knowledge and skills of American students.
The so-called “Main NAEP” has assessed performance in mathematics and reading every two years in recent decades, with enough continuity in tested content to allow for comparisons over time in fourth-grade and eighth-grade math and reading performance.1 Tests in other subjects are administered less frequently and consistently. The civics assessment, which is particularly relevant to this report, allows for comparisons of the performance of eighth-grade students in 1998, 2006, 2010, and 2014, as well as fourth-grade students in 1998, 2006, and 2010.2
In this section, we explore trends in math, reading, and civics performance from the late 1990s through the most recent year in which results are available (2017 in math and reading, 2014 in civics). We show trends in nationwide performance and in test score gaps by race (white-black), ethnicity (white-Hispanic), and family income (based on eligibility for free or reduced-price lunch [FRL]). In doing so, we examine test score trajectories from the beginning to the end of the No Child Left Behind era (NCLB). The 2017 results, in particular, reflect a boundary in the timeline of education policy, demarcating the end of NCLB and the beginning of the Every Student Succeeds Act (ESSA).
The overall trend in eighth-grade civics has been slow and modest improvements, with perhaps a slight uptick in scores in recent years. Gaps in civics scores remain alarmingly wide.
We show that math and reading scores for grades 4 and 8 have increased over the last two decades, although the largest increases—with the exception of eighth-grade reading—occurred in the early years of NCLB. White-black and white-Hispanic math and reading gaps have declined over this period, while gaps by FRL eligibility have remained steady. Meanwhile, the overall trend in eighth-grade civics largely mirrors the trend in eighth-grade reading: slow and modest improvements, with perhaps a slight uptick in scores in recent years. Gaps in civics scores remain alarmingly wide.
NAEP math and reading trends
Figure 1 shows NAEP math scores for grades 4 and 8 from 1996 through 2017. To facilitate comparisons across years and subjects, we report scores in terms of score differences—in standard deviations (SD)—relative to the first year presented. All of these trend lines begin with a baseline score of 0.00 and then change according to how average scores on that assessment changed relative to the baseline year.3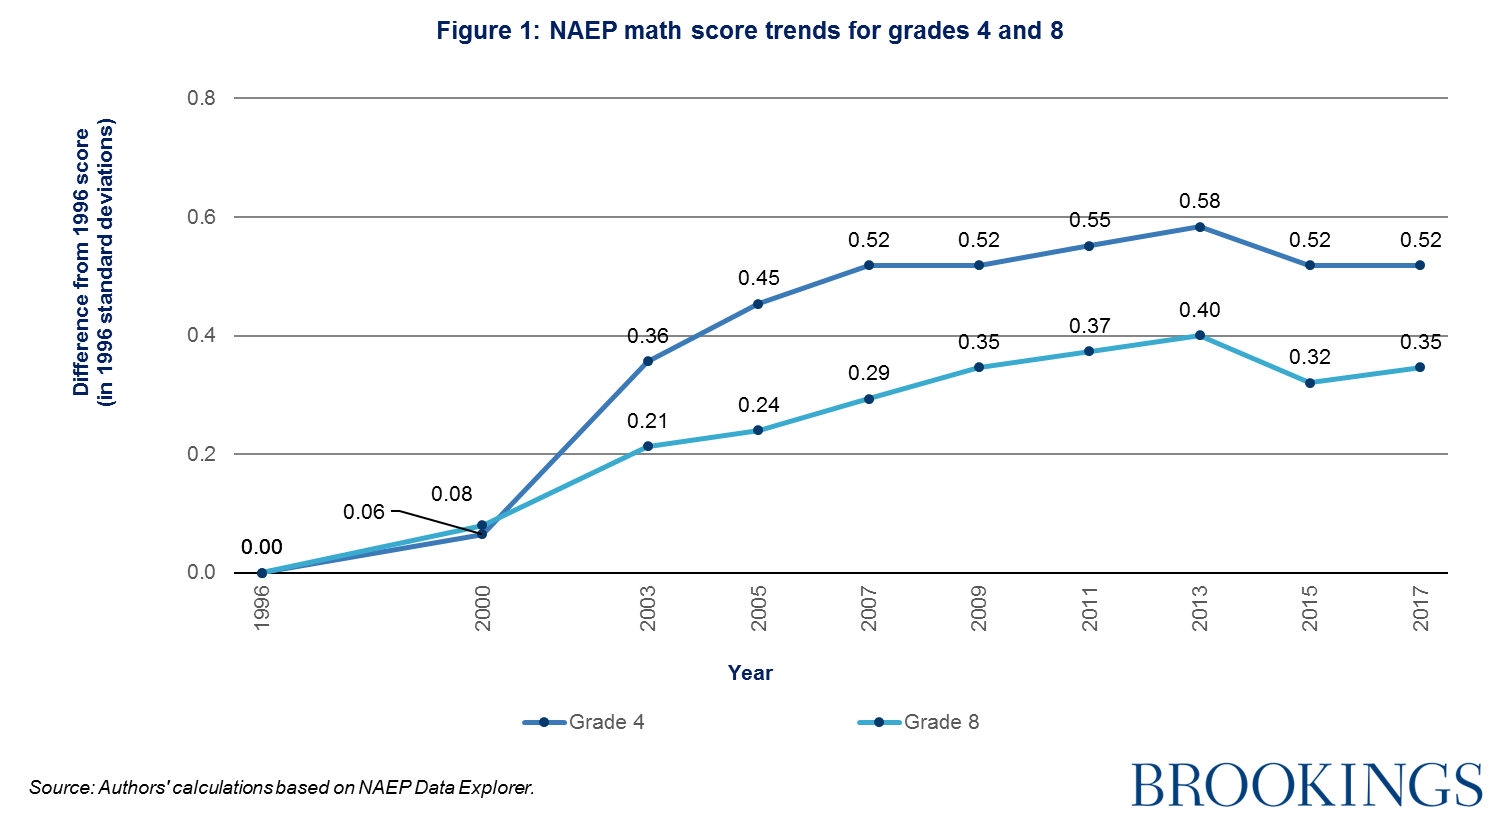
NAEP math scores improved substantially from 1996 to 2017. These increases amount to 0.52 SD in fourth grade and 0.35 SD in eighth grade. For context, an increase of one-half of a standard deviation roughly equates to a jump from the 50th to the 69th percentile in a normal distribution of scores, while an increase of one-quarter of a standard deviation equates to a jump from the 50th to the 60th percentile.4
However, the growth in scores over this period has not been linear. Math scores increased rapidly in the early years of NCLB, which was signed into law in 2002, and have stayed relatively stable since then. In fact, for both fourth grade and eighth grade, the average scores from 2017 were identical to the average scores from 2009. This period includes a rare drop in math scores from 2013 to 2015.
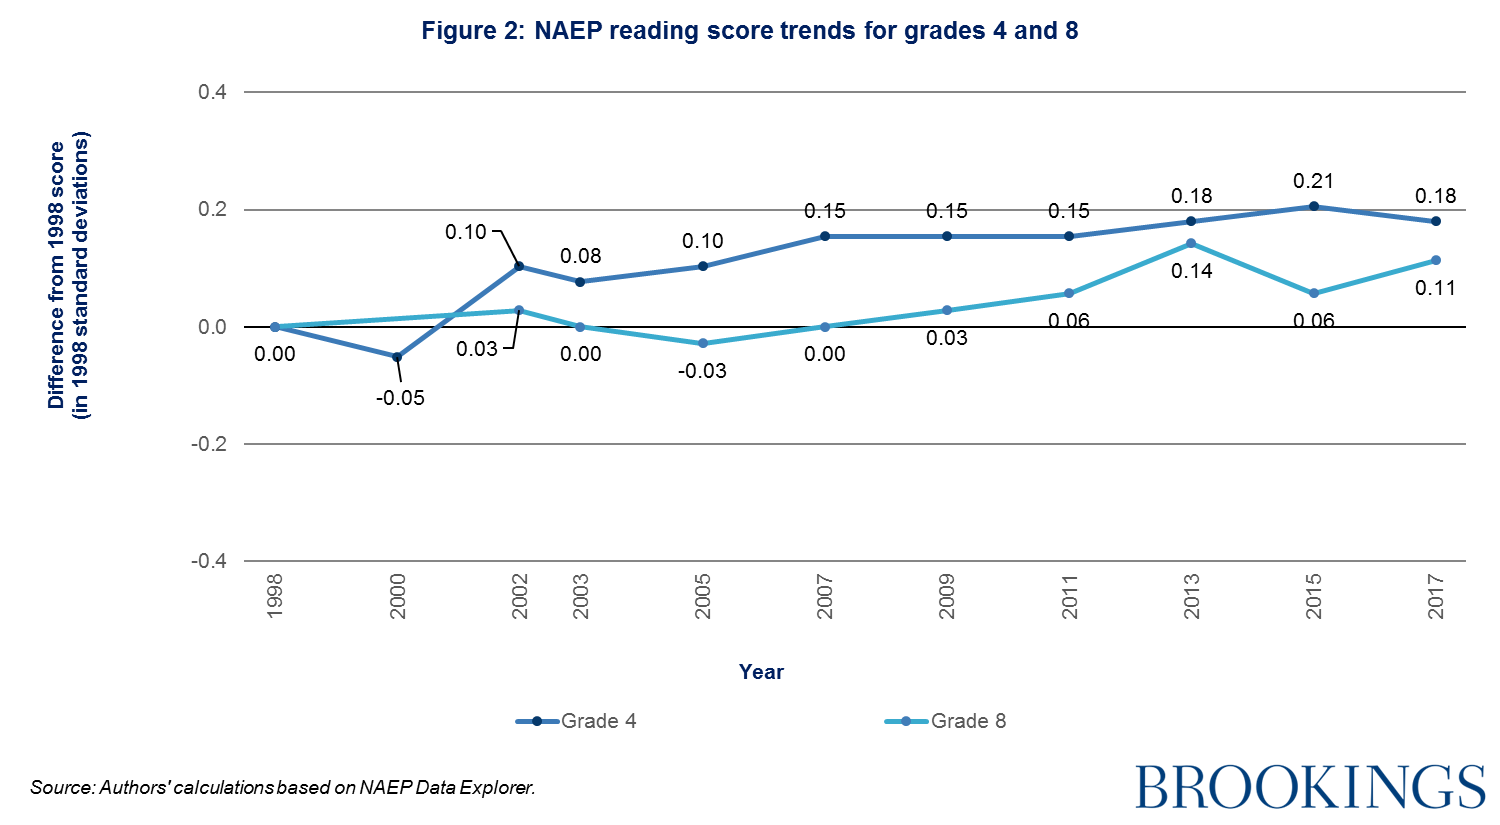
Figure 2 shows reading trends from 1998 through 2017. Overall, gains in fourth- and eighth-grade reading scores were more modest than the gains in math scores.5 From 1998 to 2017, scores improved by 0.18 SD in fourth grade and 0.11 SD in eighth grade. This comes after a slight drop in fourth-grade scores and a slight jump in eighth-grade scores since the prior assessment in 2015. While the fourth-grade scores follow a similar pattern to the math scores—most of the improvement occurring shortly after NCLB implementation—the eighth-grade reading trend deviates from this pattern. Eighth-grade reading scores were flat throughout the early years of NCLB, but show slight gains more recently.
Why have math and reading scores trended in this way? That is a difficult question with many plausible answers. Trends in NAEP scores reflect the effects of a wide variety of factors, some school-based and others not. Although NCLB was arguably the most consequential education policy of this period, it certainly was not the only factor shaping these scores.
Still, some informed speculation is possible using existing education research. Consider the following:
- The sharp rise in math scores shortly after NCLB implementation, followed by a flattening of the trend line, is consistent with what Mark Schneider calls “the accountability plateau.”6 Schneider argues that NCLB’s accountability provisions provided a shock to the U.S. education system that abruptly and profoundly changed school behaviors. This might have included a sharpened focus on math and reading—the subjects emphasized in NCLB’s testing requirements. Once schools settled into their new reality, that initial shock was not enough to continue to propel performance upwards.
- The different trends across subjects—with more modest changes in reading than math—are consistent with findings from many empirical studies showing that interventions in schools tend to have stronger effects on math scores than reading scores.7 This could be explained by math learning occurring primarily in school (and, specifically, math class), while children develop reading skills through a broader combination of in-school and out-of-school experiences. If NCLB affected schools’ performance, we might expect to see its effects more clearly through math score trends than reading score trends.
- The patterns in NAEP scores are also broadly consistent with patterns in school funding. A recent study examined the effects of the Great Recession of the late 2000s on student performance, finding that a 10 percent reduction in school spending caused a drop in test scores of about 0.08 SDs.8 Another study assessed school finance reforms during the “adequacy” era of the 1990s and 2000s. It found that the relative performance of low-income districts on the NAEP had climbed by about 0.1 SDs a decade after a reform.9
Of course, to reiterate, every NAEP score and trend reflects a combination of factors far too numerous and complicated to fully explain here.
Math and reading gaps by race, ethnicity, and family income
An explicit focus of NCLB, reflected even in the name of the legislation, was to improve opportunities for historically disadvantaged groups of students. NCLB required that states disaggregate math and reading scores for specified subgroups and then sanctioned schools for failing to make “adequate yearly progress” within those subgroups. Here, we examine trends in math and reading test score gaps by race (white-black), ethnicity (white-Hispanic), and family income as measured by eligibility for FRL.
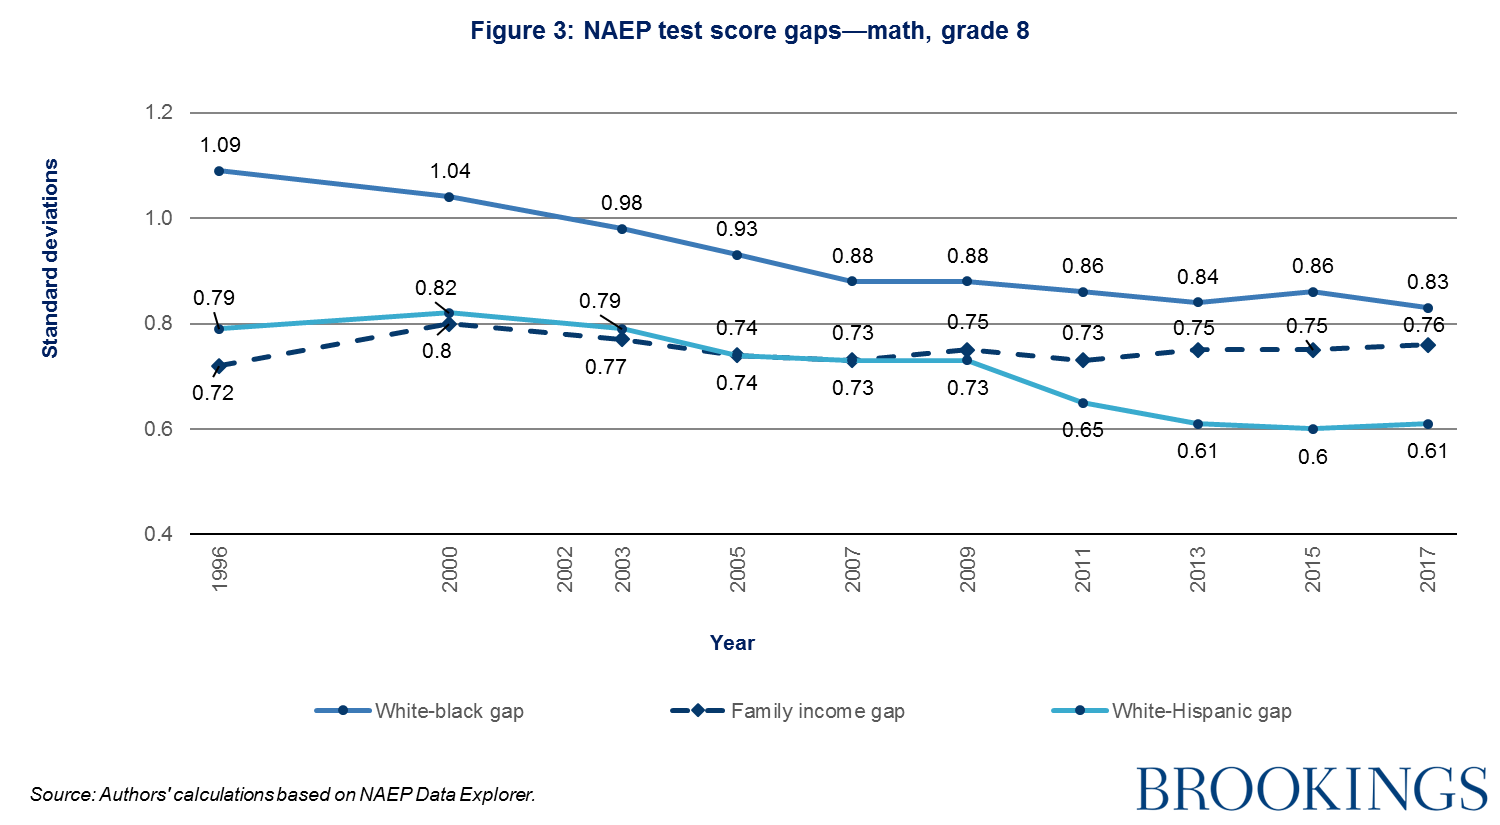
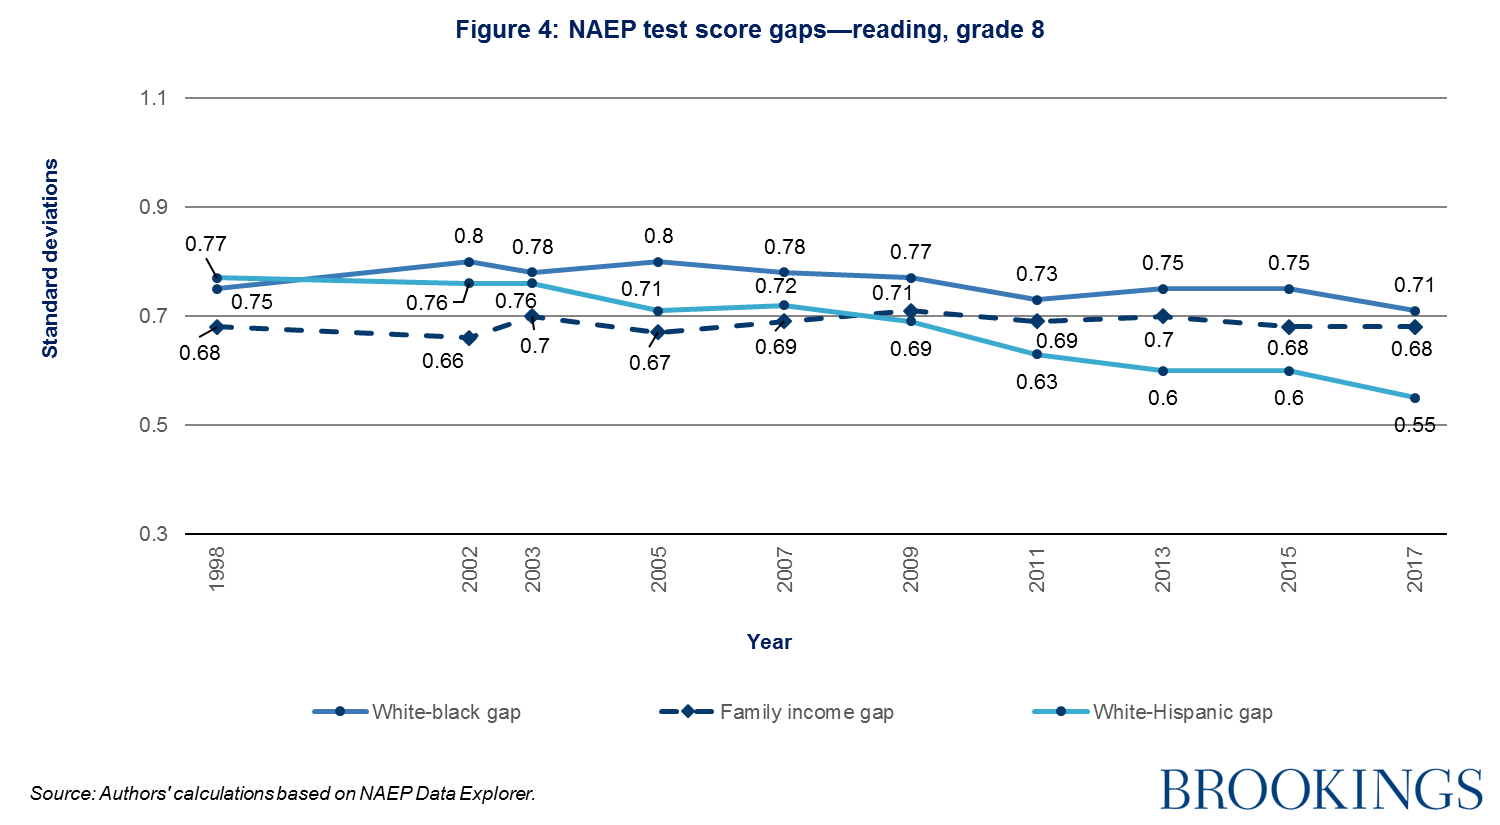
Figures 3 and 4 show trends in eighth-grade NAEP gaps from 1996 through 2017. We focus on eighth grade to simplify the presentation, but gaps (and gap trends) for grades 4 and 8 are generally similar. Figures showing fourth-grade gaps appear in Appendix 1.A for reference. We again report numbers in standard deviations, although in this case each number represents the size of the gap between the two groups on that particular test. A downward-sloping gap indicates that a gap is shrinking over time.
Trend lines differ across race, ethnicity, and income gaps, so we consider them individually.
Gaps by race and ethnicity
The white-black gap in eighth-grade math has narrowed since 1996, but remains wide. (See the solid, dark blue line in Figure 3.) The gap was larger than a full standard deviation as recently as 2000, but a steady narrowing during the first half of the NCLB era cut into that difference. It currently stands at 0.83 SD, with little movement over the last decade. For perspective, the median (50th percentile) math scale score for black students in 2017 was 260. This falls between the 10th percentile (246) and 25th percentile (269) in the distribution of white students’ scores.
The white-black gap in eighth-grade reading has stayed more consistent over the last two decades, with each measurement between 0.7 and 0.8 SD. (See the solid, dark blue line in Figure 4.) It currently stands at 0.71 SD. Here, too, the median score for black students falls between the 10th and 25th percentile of white students’ scores.
The white-black gap in eighth-grade math has narrowed since 1996, but remains wide; the white-black gap in eighth-grade reading has stayed more consistent over the last two decades.
White-Hispanic gaps have narrowed since the late 1990s. The math gap dropped from 0.79 SD in 1996 to 0.61 SD in 2017, while the reading gap dropped from 0.77 SD in 1998 to 0.55 SD in 2017. The timing of the movement in white-Hispanic gaps differs from the timing of the movement in white-black gaps, with white-Hispanic gaps tightening more recently. The reasons for that are unclear, but it bears mentioning that changes in the composition of a student subgroup over time can affect that subgroup’s trends. The U.S. Hispanic population has changed in recent years—changes that include a drop in the share of the population born outside the U.S.10
Even with the recent narrowing of white-Hispanic NAEP gaps, these gaps remain large. The median math score for Hispanic eighth graders falls at the 25th percentile in the distribution of white students’ scores, while the median reading score falls just above the 25th percentile.
Gaps by family income
Next, we examine gaps by family income, comparing the scores of students identified as eligible for FRL and students not identified as eligible. We present these results with a caveat. During this period, Congress expanded eligibility for the federal school lunch program in two notable ways: granting eligibility to “directly certify” students who qualify for other types of public support, like the Supplemental Nutrition Assistance Program, and allowing schools with at least 40 percent of students directly certified to make all of their students eligible (including those whose family incomes exceed the threshold).11 We proceed with FRL-based trends because we believe they remain informative and familiar, but the legislative change could mean that the population of FRL-eligible students has changed over the last decade. For reference, Appendix 1.B shows trends in eighth-grade math and reading gaps over this period based on parental education.12
Income-based gaps in both subjects remained steady for eighth-grade students from the mid-1990s through 2017. These gaps, like the white-black and white-Hispanic gaps, equate to multiple years of academic learning.
Looking at Figures 3 and 4, we see that income-based gaps in both subjects remained steady for eighth-grade students from the mid-1990s through 2017. The gaps between FRL-eligible and FRL-ineligible students currently stand at 0.76 SD in math and 0.68 SD in reading. These gaps, like the white-black and white-Hispanic gaps, equate to multiple years of academic learning. The median scale scores for FRL-eligible eighth graders fall between the 10th percentile and 25th percentile in the distributions of scores for FRL-ineligible students.
In recent years, researchers have studied achievement gaps by family income more closely. Sean Reardon has shown the strikingly different trends in white-black and wealthy-poor gaps (e.g., with wealthy-poor defined as the 90th versus 10th percentile in family income).13 He compares test score gaps for cohorts of U.S. students born from the 1940s through early 2000s. Early in that period, white-black gaps in math and reading were considerably larger than wealthy-poor gaps in math and reading. More recently, the reverse is true, with wealthy-poor gaps much larger than black-white gaps (and well above a full standard deviation).
The NAEP data tell a different story than Reardon’s data—but a reconcilable one. These analyses differ in notable ways. For example, our presentation of eighth-grade math and reading results from the late 1990s through 2017 considers a narrower time period, age group, and type of assessment. Critically important, too, is how the wealthier and poorer groups are defined. By comparing students in the 90th and 10th percentiles of the income distribution, Reardon provides a truer comparison of rich and poor. NAEP score trends based on free or reduced-price lunch eligibility—set at family income of 130 percent and 185 percent of the poverty threshold, respectively—compare roughly the top and bottom halves of student population by family income. While this comparison is more inclusive of middle-class students, it can mask variation within groups of FRL-eligible and FRL-ineligible students. Students from deeply impoverished households may have little in common with students who narrowly qualify for FRL, while students who narrowly miss the FRL cutoff may have little in common with students from truly wealthy households.
Stepping back, this look at subgroup NAEP scores over the past two decades leaves plenty of reason for concern. Test score gaps by race, ethnicity, and family income remain distressingly wide, and although racial and ethnic gaps show signs of slow improvement, little in the recent trends suggests the gaps will close in the near future.
NAEP civics trends
NCLB gave special status to math and reading assessments. It required schools to measure math and reading performance in grades 3 through 8 and once in high school, with sanctions for schools that failed to make adequate yearly progress toward 100-percent proficiency by the 2013-14 academic year. This created strong incentives for schools to emphasize math and reading. That is not necessarily a problem. After all, the logic of test-based accountability is to give schools the incentives and flexibility to produce outcomes deemed important by policymakers.14
Weekly instructional time in history and social studies for grades 1 through 6 dropped from 3.0 hours in 1999-2000 to 2.6 hours in 2003-04.
More attention to math and reading, however, could mean less attention to pursuing other important goals. Prior research has, in fact, found schools responding to accountability pressure by cutting instructional time in less-emphasized subjects, including social studies. One study, using data from the national Schools and Staffing Survey, found that the weekly instructional time in history and social studies for grades 1 through 6 dropped from 3.0 hours in 1999-2000 to 2.6 hours in 2003-04.15 It noted that students in states with history assessments spent more time learning history (2.9 hours per week) than students in states without these assessments (2.5 hours per week). This is consistent with results from another study that attributed increases in the instructional time allocated to English language arts and math to NCLB.16
Whether it was a blessing or a curse for subjects like social studies to escape the direct focus of NCLB depends on one’s perspective. On one hand, this might have liberated educators from pressures to focus their instruction on state test preparation. As Daniel Koretz details in “The Testing Charade,” schools’ responses to accountability pressures often seem better aligned with maximizing test scores than with producing genuine, meaningful learning.17 On the other hand, topics like civics education could get crowded out if schools narrowed their focus—and targeted their resources—toward math and reading.
Below, we examine trends in NAEP civics scores over the NCLB era. NAEP has assessed civics less frequently and consistently than math and reading, but the results still provide useful information about trends in nationwide performance and gaps by race, ethnicity, and family income. Of course, these performance trends are likely not entirely attributable to schools, since students’ understanding of civics arises from learning that occurs both inside and outside of school.
Trends in nationwide performance
Figure 5 shows trends in fourth-grade and eighth-grade NAEP civics results from 1998 through the most recent assessment (2010 for fourth grade, 2014 for eighth grade). Scores are reported as they were in Figures 1 and 2. In this case, each score is reported as a difference from the 1998 mean for that grade, given in 1998 standard deviations.
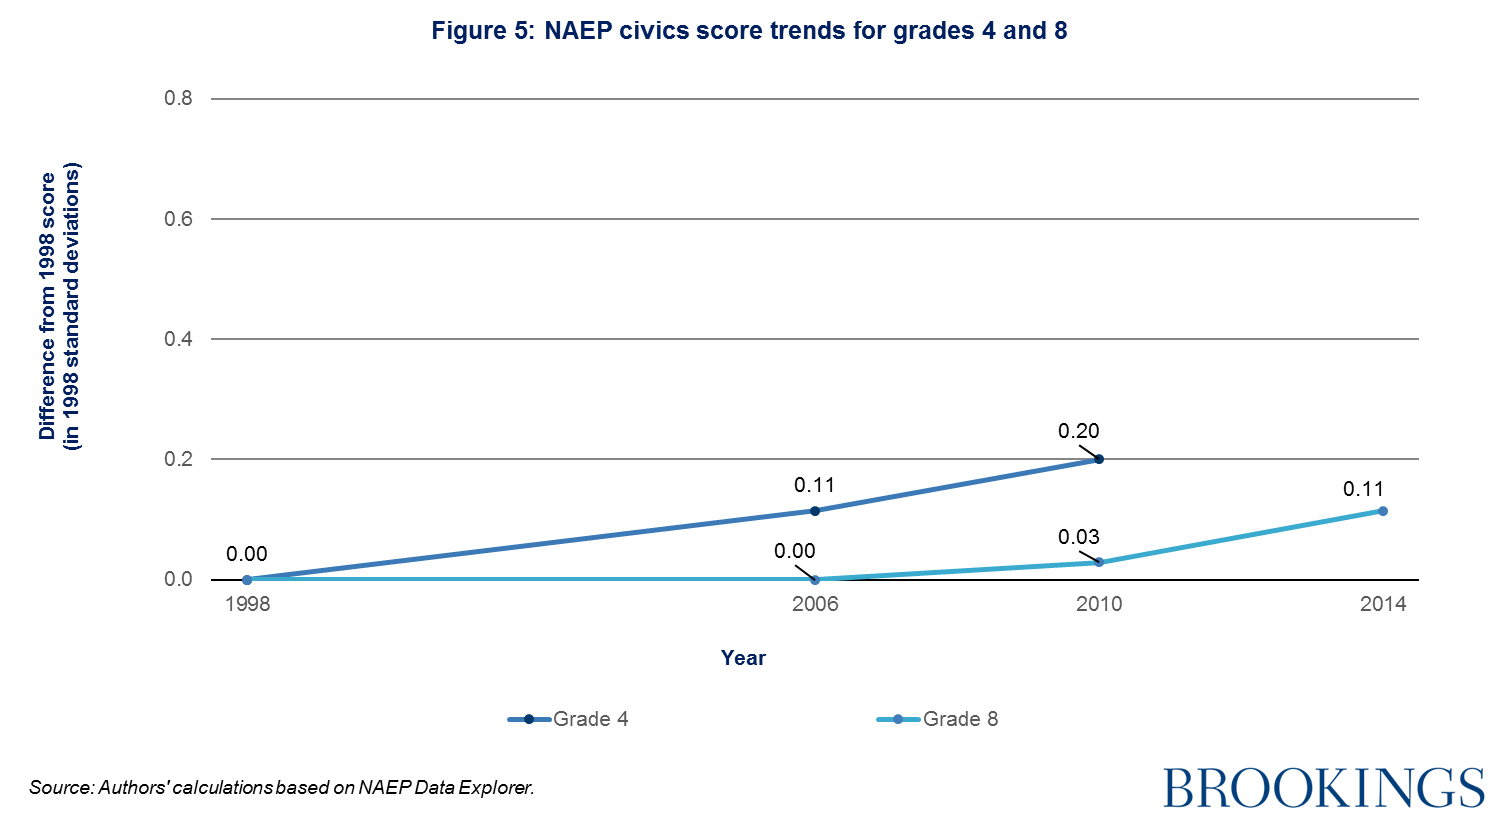
Despite social studies not featuring prominently in NCLB testing requirements, scores on NAEP civics assessments have remained steady or climbed slightly. These trends are broadly similar to the trends in reading scores. Fourth-grade scores climbed more quickly than eighth-grade scores, with little movement in eighth grade until 2014. Over the observed period, fourth-grade scores climbed by 0.20 SD and eighth-grade scores climbed by 0.11 SD. These gains are in the same range as the concurrent reading gains and more modest than the math gains.
Importantly, NAEP civics results might provide a very limited assessment of whether U.S. students are receiving a rich, well-rounded civics education. We return to this question in detail in the next chapter. However, it is notable that NAEP results do not indicate a drop in performance during the NCLB era.
Trends in gaps by race, ethnicity, and family income
If we expect schools that feel accountability pressure to focus their time and resources on tested content, we might expect schools that feel the most intense accountability pressure to focus most intently. This could be schools that serve disadvantaged student populations. NCLB prioritized proficiency rates over growth, putting schools that serve large percentages of students who arrive well below grade level at particular risk of being sanctioned. This suggests that low-income students and students of color might have experienced an especially clear shift away from civics and social studies.
Figure 6 shows gaps on the NAEP civics assessment by race, ethnicity, and FRL eligibility. We created this figure using the same approach that we used for Figures 3 and 4 (for math and reading gaps, respectively).
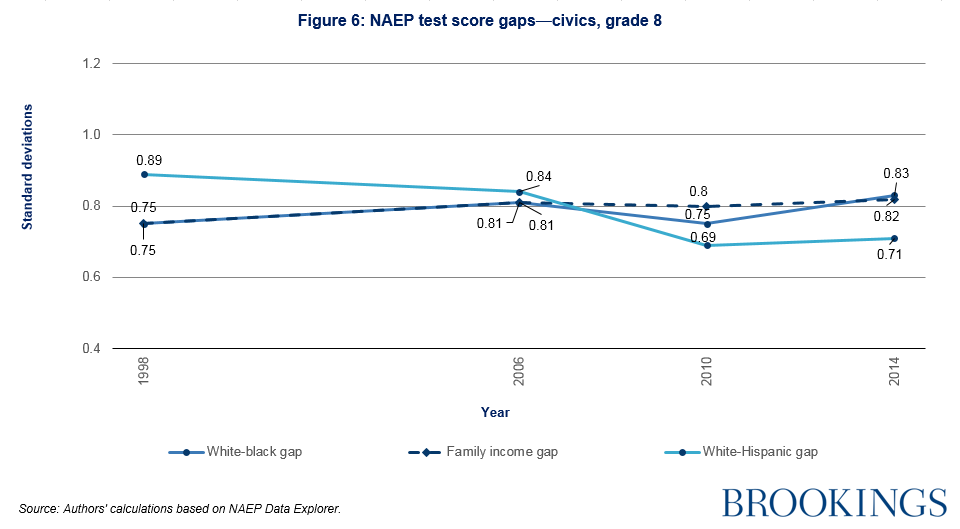
Gaps on the eighth-grade civics assessment are—and long have been—very wide. As of 2014, the white-black gap was 0.83 SD, the income gap (based on FRL eligibility) was 0.82 SD, and the white-Hispanic gap was 0.71 SD. In each case, the median score for the lower-scoring group falls between the 10th and 25th percentile of the higher group’s scores.
Over the course of the NCLB era, the white-black gap widened slightly (0.75 SD in 1998 to 0.83 SD in 2014) and the income gap widened slightly (0.75 SD to 0.82 SD). The white-Hispanic gap narrowed (0.89 SD to 0.71 SD), which is a similar pattern to white-Hispanic gaps in eighth-grade math and reading, although the civics gap remains wider.
Despite social studies not featuring prominently in NCLB testing requirements, scores on NAEP civics assessments have remained steady or climbed slightly.
Caveats about NAEP’s limitations notwithstanding, the size of these gaps—and the lack of progress in closing race- and income-based gaps—is disconcerting. Civic participation affords political power, and broad participation is essential for a healthy, inclusive democracy. The U.S. has a long history of political inequality, with gaps in representation in elected office and many ways in which the voices of historically disadvantaged groups have been suppressed.18 Schools, more than any other public institution, are tasked with developing Americans’ civic knowledge, skills, and dispositions. While gaps in measures like the NAEP civics assessment reflect more than just what happens at school, research indicates that schools that make a concerted effort to increase civic participation can, in fact, do so.19 Moreover, these gaps serve as a reminder that monitoring educational equity requires looking at measures beyond just math and reading scores.
Conclusion
So what do the last two decades of NAEP scores tell us about the NCLB era, and what should we look for in the years to come?
Test-based accountability, the centerpiece of NCLB, has likely had profound effects on school decisionmaking. In the words of Daniel Koretz, “Walk into almost any school, and you will enter a world that revolves around testing and test scores, day after day and month after month.”20 Whether this relentless focus has been healthy is a subject of fierce debate. On one hand, NCLB accountability might have drawn schools’ attention to particularly important subject matter, strengthened their incentives to teach that subject matter well, and improved our understanding of student performance by subgroup and locale. On the other hand, it might have drawn schools’ attention away from other important responsibilities—including preparing students as citizens—and led to instructional approaches more likely to improve test scores than develop meaningful knowledge and skills.
Since NCLB’s early years, scores have largely plateaued at levels of nationwide performance that many Americans find underwhelming, leaving still-large gaps between historically advantaged and disadvantaged groups.
NAEP scores can be used—or misused—to support either perspective. Math scores climbed sharply in NCLB’s early years, in part because of substantial improvements in the scores of black and Hispanic students. Since then, scores have largely plateaued at levels of nationwide performance that many Americans find underwhelming, leaving still-large gaps between historically advantaged and disadvantaged groups. It is fair to say that NCLB-style accountability is not a panacea for closing test score gaps and putting schools on a path toward rapid, sustained gains in academic performance. It is also fair to say that this would be an unreasonable expectation.
We should reiterate that NAEP scores reflect much more than the effects of a single piece of legislation, even one as consequential as NCLB. NAEP trends over the last two decades likely reflect much more than the impacts of NCLB. Notably, though, research on the causal effects of test-based accountability also show relatively large, sudden test score gains, especially in math.21
It is also important to put NAEP scores in perspective. The education policy community now places so much emphasis on NAEP math and reading performance that many take for granted that the “Nation’s Report Card” covers a small subset of the work we ask of schools. By historical standards, U.S. education policy has been narrowly focused on student performance in core academic subjects, specifically math and reading.22 ESSA, which replaced NCLB in 2015, has the potential to change that. It provides greater flexibility to states in designing their accountability systems while requiring them to incorporate at least one indicator of “school quality or student success,” broadly defined. Still, requirements for math and reading assessments persist, and whether states will use their increased flexibility to reshape the goals they set for schools remains to be seen.
Read the next section of the 2018 Brown Center Report, or visit the full report page.
References
Brown, A., & Atske, S. (2016, June 28). Blacks have made gains in U.S. political leadership, but gaps remain. Pew Research Center. Retrieved from http://www.pewresearch.org/fact-tank/2016/06/28/blacks-have-made-gains-in-u-s-political-leadership-but-gaps-remain/.
Chingos, M. (2016). No more free lunch for education policymakers and researchers. Brookings Institution. Retrieved from https://www.brookings.edu/wp-content/uploads/2016/06/free-and-reduced-lunch3.pdf.
Cronin, J., Kingsbury, G. G., McCall, M. S., & Bowe, B. (2005). The impact of the No Child Left Behind Act on student achievement and growth: 2005 edition. Portland, OR: Northwest Evaluation Association.
Dee, T. S., & Jacob, B. A. (2010). The impact of No Child Left Behind on students, teachers, and schools. Brookings Papers on Economic Activity, 2010(2), 149-207. Washington, DC: Brookings Institution.
Figlio, D., & Loeb, S. (2011). School accountability. In E. A. Hanushek, S. Machin, L. Woessmann (Eds.), Handbook of the Economics of Education, Vol. 3 (pp. 383-421). Netherlands: Elsevier.
Flores, A. (2017, September 18). How the U.S. Hispanic population is changing. Pew Research Center. Retrieved from http://www.pewresearch.org/fact-tank/2017/09/18/how-the-u-s-hispanic-population-is-changing/.
Gill, B., Tilley, C., Whitesell, E., Finucane, M., Potamites, L., & Corcoran, S. (2018). The impact of Democracy Prep Public Schools on Civic Participation: Final report. Princeton, NJ: Mathematica Policy Research.
Hanushek, E. A., & Raymond, M. E. (2001). The confusing world of educational accountability. National Tax Journal, 54(2), 365-384.
Hill, C. J., Bloom, H. S., Black, A. R., & Lipsey, M. W. (2008). Empirical benchmarks for interpreting effect sizes in research. Child Development Perspectives, 2(3), 172-177.
Holland, P. W. (2002). How big is big when it comes to gaps in scores? In Ad Hoc Committee on Confirming Test Results (Eds.), Using the National Assessment of Educational Progress to confirm state test results. Washington, DC: National Assessment Governing Board.
Jackson, C. K., Wigger, C., & Xiong, H. (2018). Do school spending cuts matter?: Evidence from the Great Recession. NBER Working Paper No. 24203.
Koretz, D. (2017). The testing charade: Pretending to make schools better. Chicago, IL: University of Chicago Press.
Lafortune, J., Rothstein, J., & Schanzenbach, D. W. (2018). School finance reform and the distribution of student achievement. American Economic Journal: Applied Economics, 10(2), 1-26.
Loveless, T. (2006). The 2006 Brown Center report on American education: How well are American students learning? Washington, DC: Brookings Institution.
Reardon, S. F. (2011). The widening academic achievement gap between the rich and the poor: New evidence and possible explanations. In G. J. Duncan & R. J. Murnane (Eds.), Whither opportunity? Rising inequality and the uncertain life chances of low-income children. New York, NY: Russell Sage Foundation Press.
Rothstein, R., Jacobsen, R., & Wilder, T. (2008). Grading education: Getting accountability right. Washington, DC: Economic Policy Institute; New York, NY: Teachers College Press.
Schneider, M. (2011). The accountability plateau. Washington, DC: Thomas B. Fordham Institute.
West, M. (2007). Testing, learning, and teaching: The effects of test-based accountability on student achievement and instructional time in core academic subjects. In C. E. Finn, Jr. & D. Ravitch (Eds.), Beyond the basics: Achieving a liberal education for all children (pp. 45-62). Washington, DC: Thomas B. Fordham Institute.
Authors


-
Footnotes
- The Main NAEP also assesses students in grade 12, but a change in the mathematics framework in 2005 prevents these scores from being comparable across years before and after that change. For details, see https://nces.ed.gov/nationsreportcard/about/ltt_main_diff.aspx.
- The 2018 NAEP civics assessment has been administered, but results are not yet available. Both the 2014 and 2018 assessments were restricted to students in grade 8, after earlier assessments included students in grades 4 and 12 as well.
- To illustrate, we calculate that the average 2017 math scores were 0.52 SD higher for fourth-grade students than they were in 1996. We took the average scale score in 2017 (240), subtracted the average scale score in 1996 (224), and then divided the difference by the standard deviation of the 1996 scores (31).
- It is also possible to interpret these gains in terms of typical year-to-year student learning. Researchers have proposed a number of ways of doing so. One rule of thumb is that typical yearly growth from fourth through eighth grade amounts to about 11 to 12 NAEP points per year (Holland, 2002; Loveless, 2006). Hill, Bloom, Black, and Lipsey (2008) focus on the differences in typical gains across grades and subjects. They report that math scores tend to increase by 0.56 SD from grades 4 to 5 and 0.22 SD from grades 8 to 9, while reading scores tend to increase by 0.40 SD from grades 4 to 5 and 0.24 SD from grades 8 to 9.
- Changes in scores for reading and civics are reported in 1998 standard deviation units. We calculated change over time by subtracting the average score in 1998 from a particular year’s score and dividing by the 1998 standard deviation.
- Schneider (2011).
- See Cronin, Kingsbury, McCall, & Bowe (2005) for discussion.
- Jackson, Wigger, & Xiong (2018).
- Lafortune, Rothstein & Schanzenbach (2018).
- Flores (2017).
- Chingos (2016).
- NCES defines parental education as the highest level achieved by either of the student’s parents, based on student responses to two background questions.
- Reardon (2011).
- Hanushek & Raymond (2001).
- West (2007).
- Dee & Jacob (2010).
- Koretz (2017).
- Brown & Atske (2016).
- Gill, Tilley, Whitesell, Finucane, Potamites, & Corcoran (2018).
- Koretz (2017), p. 21.
- Figlio & Loeb (2011).
- Rothstein, Jacobsen, & Wilder (2008).
The Brookings Institution is committed to quality, independence, and impact.
We are supported by a diverse array of funders. In line with our values and policies, each Brookings publication represents the sole views of its author(s).