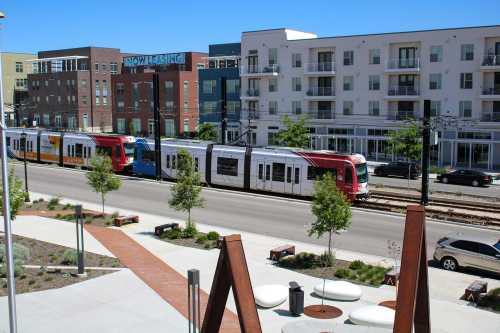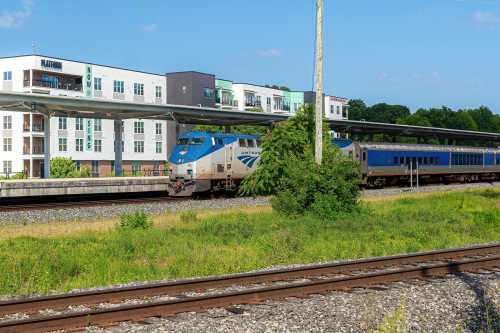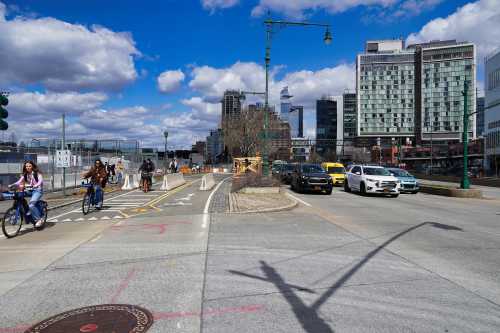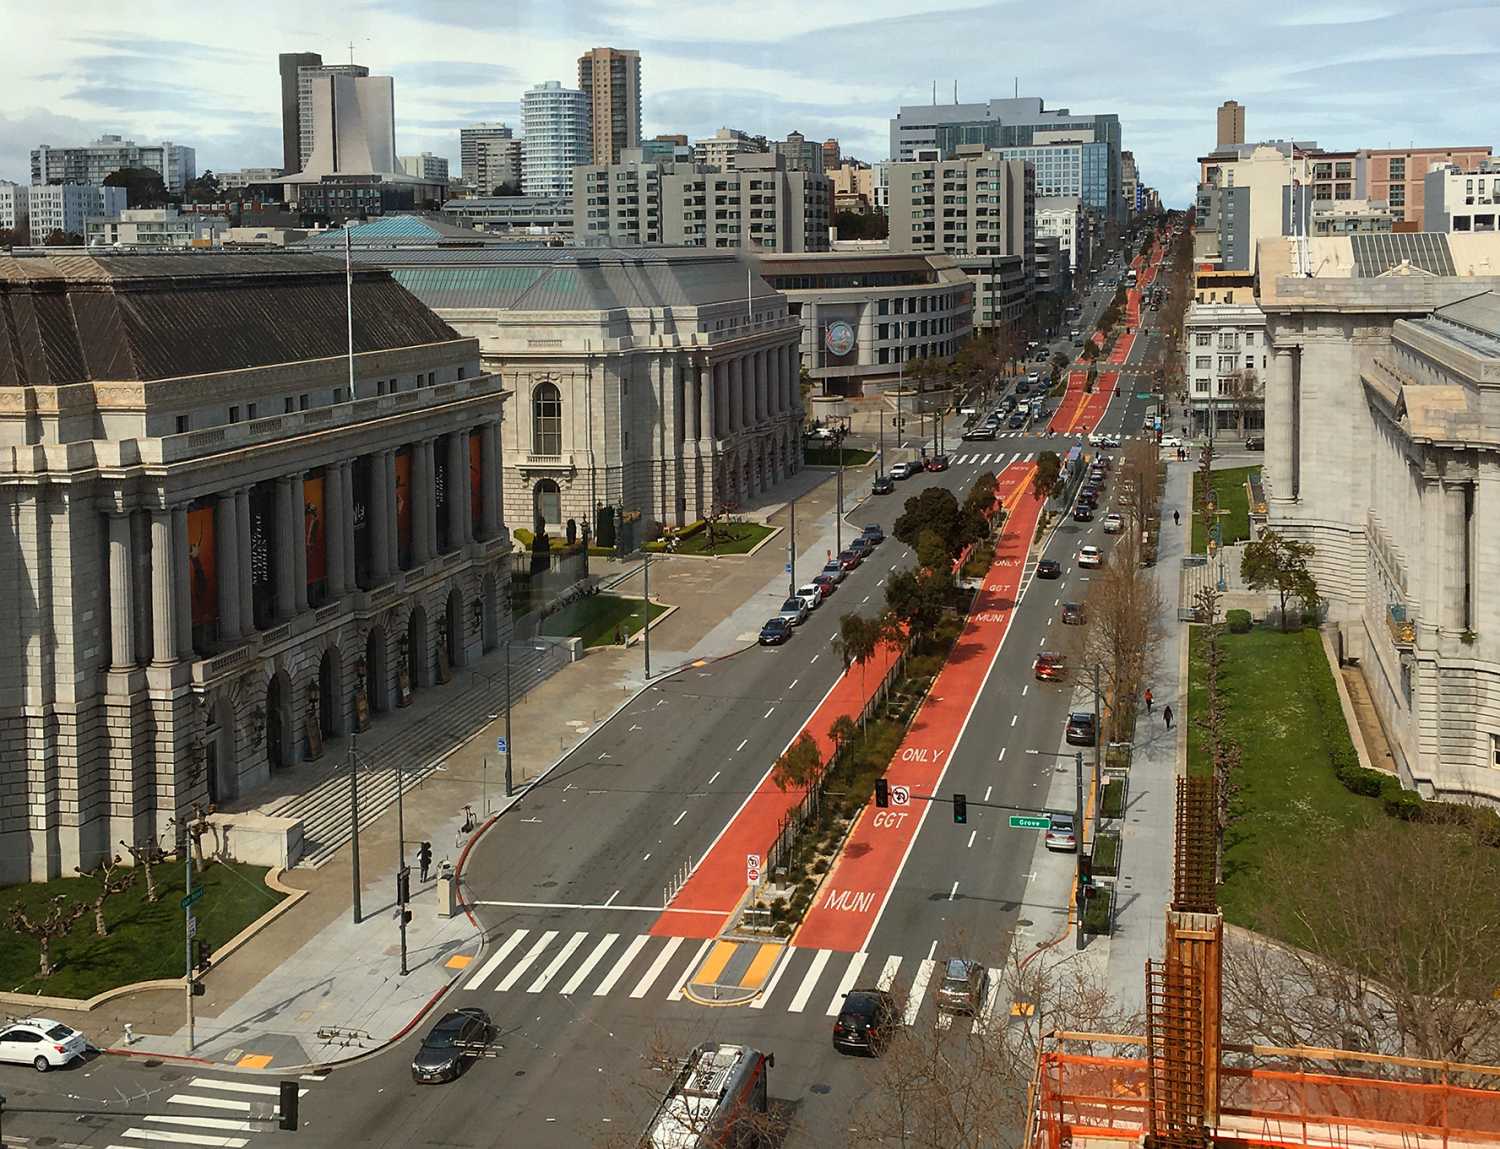
This report is one component of a three-part series studying the barriers to transit-oriented development (TOD) in U.S. metropolitan areas. It’s accompanied by a report on emerging models for state-led TOD governance and a report on how business groups can advance TOD in their regions.
Introduction
State departments of transportation (DOTs) may be best known for building the Interstate Highway System, but that reputation hasn’t caught up to their modern role. Today, state DOTs control massive road networks, of which only so many are limited-access roads. States also own Main Streets in small towns and major boulevards in big cities; some even own secluded neighborhood streets. Whatever their individual form, state-owned roads are the backbone of the country’s urban road networks. State DOTs made their name connecting regions to other regions; now, they own thousands of miles of roads within those regions.
State highways in urban areas don’t just shuttle people and goods at high speeds. While interstate highways get drivers from Point A to Point B, other state-owned roads have become destinations unto themselves. Land next to these roads—and the side streets and parallel roads that surround them—is developed. In many cases, there are bus routes going up and down these roads and rail stations nearby. It’s no surprise that these roads are often where we go to work, shop, and eat. Put simply: The areas near state-owned roads are economic engines for regions and host their most popular destinations.
State DOTs have a responsibility, then, to plan and design these roads in a way that reflects their economic import. Transit-oriented development (TOD) might be the best way to do just that. The concept is intuitive: Build more housing, commercial space, schools, and other amenities near transit. And the rewards can be massive: TOD can make life more affordable for residents, improve the fiscal health of local governments, increase transit ridership, juice tax revenue, promote regional accessibility, and offer more housing within small land areas.
State DOTs can play a huge role in advancing and executing TOD. State-owned roads and their designs are just as crucial to TOD as bus stops and train stations. Dense development thrives near transit stations, but the roads serving those destinations can and should keep everyone safe, promote business development, and make homes near transit preferred places to live. Once these roads are built to achieve those goals, elected officials and agency staff have a suite of tools they can use to spur TOD.
All of which makes state roads near transit—the asphalt, sidewalks, bike lanes, street parking, and land underneath—the perfect place for states to put their weight behind TOD. To better understand the opportunity for TOD along state-owned corridors, we used the National Transit Map to find the more than 72,000 state-owned roads near transit of any mode—from light rail and subways to buses and ferries—and then analyzed the areas that surround them. Our analysis revealed:
- State governments control more than 113,000 miles of roads in urban areas. That’s nearly 10% of the 1.2 million miles of non-interstate urban roads in the U.S.1 In more than 2,500 of the country’s 2,611 urban areas, state DOTs own at least some roads; in over half of these urban areas, they own more than 10 miles. These trends vary by region and state: Mid-Atlantic urban areas tend to host more state roads than those in the West and Great Plains, and states such as Delaware and North Carolina that own the vast majority of roads statewide naturally have higher urban ownership rates.
- There are 33,844 miles of urban state-owned roads within a quarter-mile of a transit stop of any mode, split across 72,776 unique corridors. Urban areas in states that own the most roads naturally have the highest nominal mileage of state-owned roads near transit. However, higher shares are found in Western urban areas.
- Over a third of state-owned corridors outperform their region on five indicators of TOD readiness: a higher density of jobs, higher density of residents, more developed land, more building floor area, and tighter street grids. Almost half of corridors longer than 1 mile outperform their region on all five indicators. But even those longer corridors are dominated by a smaller variety of land uses—less than 45% have more diverse mixes of land uses. Corridors consistently overperform in Southeastern urban areas, especially in Georgia, South Carolina, and Tennessee.
- Seventy-six percent of transit-served corridor mileage attracts more visitors per square mile than the region, but visitors to these areas are no more likely to take transit. People are more likely to take transit to these state-owned corridors where there is more robust and mature transit service across the whole urban area, particularly in Northeastern urban areas.
- People die in vehicle-related crashes around state-owned roads near transit more often than they do near other roads in almost 9 out of 10 urban areas. Southern roads are particularly dangerous, with just three Southern states (Texas, Florida, and Tennessee) accounting for 10 of the 20 regions with the deadliest roads.
This research reveals that state-owned, transit-served corridors are woefully underutilized, yet bursting with potential. This analysis won’t say exactly where to develop or which road to redesign—instead, it underscores the huge responsibility states have to make these places better. States need to adopt new approaches to how they design and manage these roads. DOTs should launch divisions dedicated to supporting land development along transit-served corridors and make sure their staff are experts in context-sensitive roadway designs and development finance. Legislators should complement these offices by mandating context-sensitive designs and authorizing new funding and financing instruments. Purpose-built reforms can accelerate TOD and save lives at the same time.
How to read this report
We used a three-step analysis—described in more detail in Table 1—to characterize and understand state-owned roads near transit. First, we determined where states own roads in urban areas, removing bridges, tunnels, and limited-access highways that cannot serve adjacent development. Then, we found all continuous stretches of state-owned roads that were completely within a quarter-mile of a transit stop of any kind.2 Finally, we analyzed a host of characteristics: trips made, land use, demographics, built environment, development patterns, and fatality rates within a quarter-mile radius of each of those 72,766 corridors.
What we’re left with is a complete understanding of what we simply call “corridors”: the zonal areas extending out a quarter-mile in each direction from transit-served, state-owned roads in urban areas.
A “corridor” is the area within a quarter-mile of an urban state-owned road near a transit stop or station.


Note: These corridors have been isolated to aid visual understanding of corridors. Nearby corridors are not included.

Five methodological considerations should be understood throughout this report:
- “Miles” refers to centerline miles. The number and width of lanes are not typically included in federal data on roads.3
- We use “urban area” and “region” to refer to census-defined urban areas. These are distinct from metropolitan statistical areas. Urban areas are composed of census blocks and refer to cities and adjacent built-up areas. Metropolitan statistical areas are drawn around county borders and give federal agencies a standard definition of the country’s economic centers.
- We primarily analyze “corridor miles” instead of counts of corridors. Because corridors vary significantly in length, their characteristics are better explained using their aggregate length as opposed to a nominal count.
- We often limit our analysis to corridors longer than 1 mile. This helps focus on corridors with consistent transit service, excluding intersections with a single stop.
- Analysis of urban areas is usually limited to those with at least 5 miles of corridors of interest. That lets us focus on regions with a big enough sample for meaningful analysis. If analysis is done on urban areas regardless of state-owned corridor mileage, we call out “urban areas regardless of corridor mileage” explicitly.
We relied on several public and private data sources for this analysis. Descriptions of those sources and their limitations, as well as brief methodological explanations, are in Table 1. For more information, see the methodological appendix.

Finding #1: State governments control many roads within urban areas
Across the country, states own 113,376 miles of roads in urban areas.4 There are 2,611 urban areas in the 50 states and Washington, D.C., and states own roads in 2,501 of them. Though some urban areas have relatively few state-owned roads, state DOTs own 5 or more miles in 2,004 urban areas—more than 75% of all urban areas.

This trend varies sharply between states. In New Jersey, the state owns only 6% of all road mileage (both urban and rural), while that number is 82% next door in Delaware. The five states with the most miles of state-owned urban roads are North Carolina, Pennsylvania, South Carolina, Texas, and Virginia. The reason why isn’t always as simple as there being more roads. North Carolina, for example, owes its high rate of state ownership to a Depression-era effort to alleviate fiscal pressure on local governments.

Beyond limited-access urban highways, states often control recognizable, heavily trafficked arterial roads in large urban areas. In Denver, for example, the state owns Colfax Avenue—a road that bisects the northern and southern portions of the city, runs directly adjacent to the state capitol building, and is such an important commuting thoroughfare that state and local governments have implemented bus rapid transit along some parts. In Philadelphia, some of the city’s most recognizable streets are state-owned: Broad, Market, Chestnut, and the eastern section of Walnut.
On the other hand, state roads in small towns are often the “Main Street,” usually forming the spine of a traditionally defined downtown. In Traverse City, Mich., the state controls part of East Front Street and Munson Avenue. Where the state owns East Front Street, it’s a four-lane highway; where state ownership ends and local ownership begins, the street becomes the recognizable Main Street that has helped boost the city’s status as a vacation destination. With just over 55,000 people, the town of Mooresville, N.C., owns most of its roads. Yet its actual Main Street (that’s its name) is owned by the state DOT.
Note: Interstates, non-Interstate limited-access roadways, ramps, bridges, tunnels, and causeways are excluded.
Source: Brookings' analysis of Highway Performance Monitoring System and National Transit Map data.
Finding #2: Nearly one-third of state-owned urban road mileage is near transit
Across the United States, state roads are frequently served by transit. Of the more than 113,000 miles of state-owned urban roads, 33,844 are located within a quarter-mile of a transit stop—that’s 30% of all state-owned urban roadway miles. While some are quite short, many state roads benefit from uninterrupted stretches where every point on the road is within a quarter-mile of some transit stop. The upshot is impressive: States own over 72,000 transit-served corridors across the U.S.

A few methodological nuances about these corridors need to be teased out. First, a single road may be divided into several transit-served corridors where there are underpasses and overpasses. That’s a methodological choice meant to exclude bridges and tunnels without development potential. Second, a road can qualify as a “transit-served” corridor without having transit running along it; a transit line may run on an adjacent road within a quarter-mile, and when a road without a transit route intersects with one that does, that small area around a stop or station may be captured as a “transit-served corridor.”
We account for these edge cases by checking corridor lengths. While more than half of the country’s transit-served corridors are less than a quarter-mile in length, those small corridors only make up about 4,050 miles (12%) of the total 33,844. By contrast, nearly half (16,361 miles) of all miles of transit-served corridors are in the 8,131 corridors that are longer than 1 mile.

These corridors can also be understood by the robustness of their transit service. That’s as simple as checking how many transit stops are within a quarter–mile of these corridors—a threshold existing literature has repeatedly supported. Over 59,000 corridors (81%) hosting 31,346 miles (93%) have two or more transit stops. At five or more transit stops, those numbers are 33,179 corridors (46%) and 24,703 miles (73%). That’s an especially meaningful threshold, because it drops corridors served by two or fewer bus stops (accounting for a stop on each side of the street).

Because denser areas put more people within walking distance of transit—which boosts ridership and lowers costs per rider—state-owned roads in urban cores and inner-ring suburbs are more likely to be transit-served. This generalized dichotomy is visible in the Chicago, Salt Lake City, and Atlanta urban areas (see below).


Finding #3: Many corridors are ready for transit-oriented development, but they need more diverse land use and more homes
Transit-oriented development can happen in every corridor, but it’s easiest under the right conditions. The places that are best set up to host TOD typically have high concentrations of jobs and residents and tight street grids, and are relatively built-up. Fortunately, state-owned transit-served corridors overperform their urban areas on each of these conditions. Across all 33,844 miles of corridors, almost 36% outperform their urban area on all of these metrics; 46% of the 16,361 miles of corridors longer than 1 mile share that distinction. However, these corridors are more likely than their urban area to be dominated by just a handful of land uses, particularly commercial and office buildings. Put simply: Many state-owned corridors have the conditions for TOD, but they need more housing to optimize the opportunity.

At the urban area level, the scale of opportunity varies. In New York and Los Angeles, 20% and 37% of all their corridor miles, respectively, outperform on each indicator. That number rises to 44% in Atlanta and 49% in Tampa, Fla., and 14 of the 20 corridor miles in San Jose, Calif., hit that threshold. These differences underscore the need to understand the potential for TOD differently in different regions.
Source: Brookings' analysis of Highway Performance Monitoring System, U.S. Census, National Transit Map, Census LEHD LODES 8.0, OpenStreetMap, and Microsoft Building Data.
Note: Key indicators of TOD-readiness include job density, population density, intersection density, developed share of land, and floor-area ratio.
No matter how you slice it, these corridors are where employers set up shop and Americans go to work. Nationally, more than 73% of corridor miles in corridors longer than 1 mile have higher job density than their urban area. It’s a consistent pattern: In 93 of the 100 most populated urban areas, more than 50% of corridor miles outperform the urban area on job density.5
Still, several places stand out. Quirks of road ownership in Virginia mean the state owns few roads within the central city of each urban area, which helps explain why Virginia Beach-Norfolk is the only urban area among those 100 most populous in which less than 30% of corridor miles outperform the region. Conversely, corridors in urban areas in Florida are consistently job-rich; Miami may be the state’s weakest, but even so, 487 of its 715 corridor miles have a higher job density than the urban area.

What gets built in these corridors reinforces their commercial strength and status as employment centers. Analyzing the land area composition of corridors relative to their urban area, 63% of corridor miles have more land being used for offices, and 72% have more being used for retail. Those numbers decline slightly when looking at building area composition: Only 51% have a greater share of building area dedicated to offices, and 68% to retail.
Corridors also have built environment characteristics that make them ideal places for TOD within their urban area. Intersection density is the number of intersections in a street network, controlling for the area’s size (see Figure 5 below)—measuring how tight a street network is in a certain place. More than 75% of corridor miles in corridors longer than 1 mile outperform their urban area on intersection density. Literature suggests that higher intersection densities can encourage non-automobile travel and be fundamental to TOD.
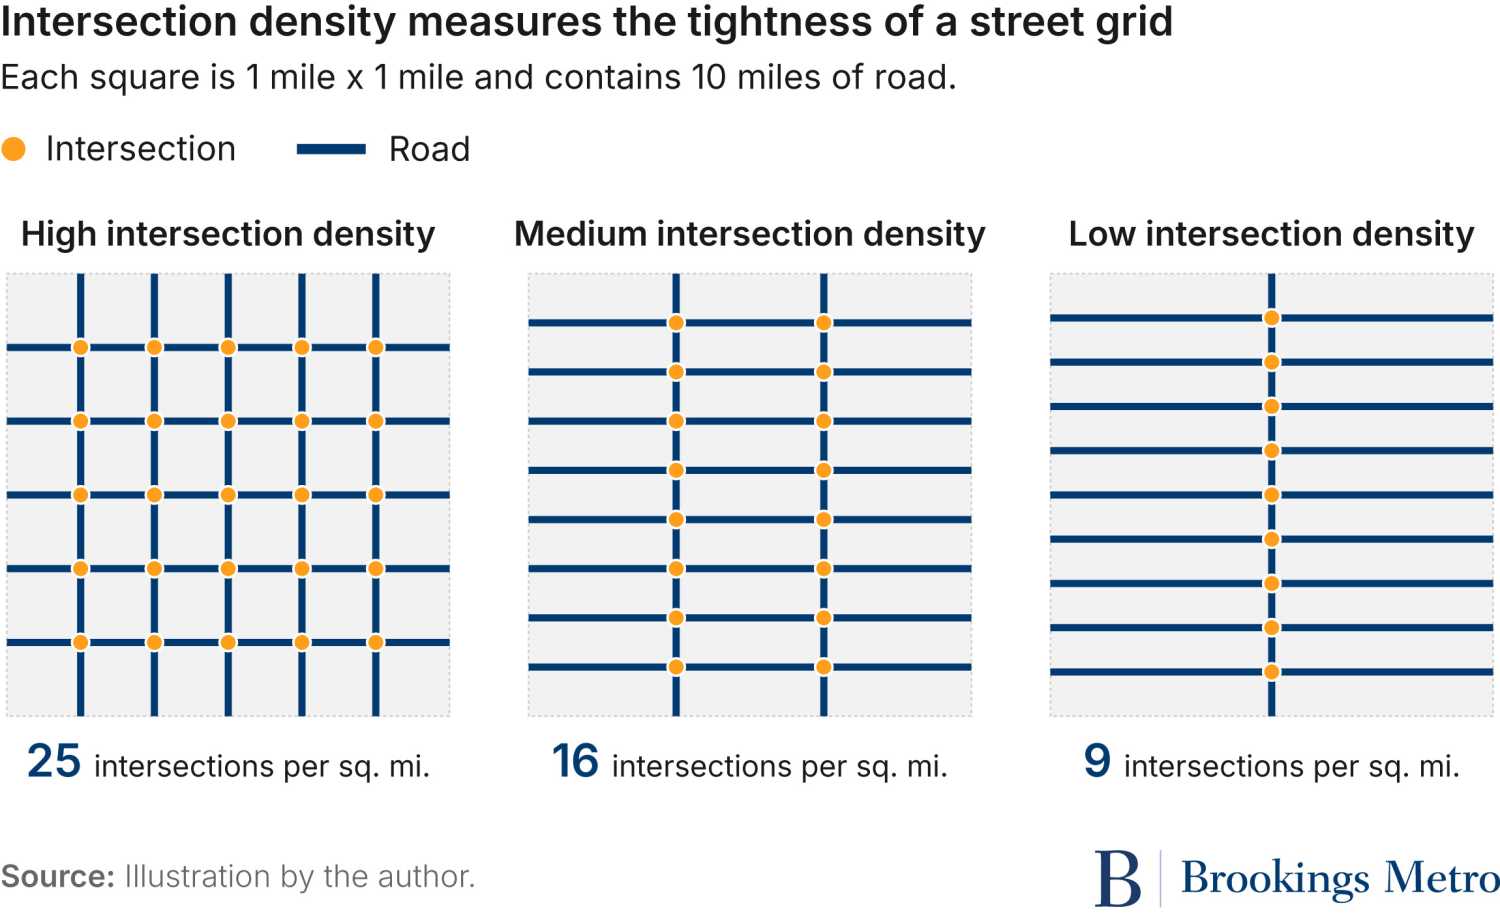
Looking at the 100 most populous urban areas, corridors tend to have tighter street grids in the Midwest, Northeast, and Southeast; underperforming urban areas are more common in the South and Southwest. Texas, for example, has eight of these urban areas with over 5 miles of corridors—but only in two do more than 50% of corridor miles have a higher intersection density than the urban area. In every one of these urban areas in Arizona, New Mexico, and Nevada, less than 50% of corridor miles have higher intersection densities than the broader region. On the other hand, more than 60% of corridor miles in every top 100 urban area in the Southeast have tighter street grids than their region.6

Many of the country’s state-owned corridors are already home to a higher share of buildings than their overall urban areas. For example, Minneapolis’ floor-area ratio is 0.16—meaning that for every square mile of land in the urban area, there’s about 0.16 square miles of building floor space. In the area around Minneapolis’ Central Avenue Northeast between Broadway and I-694, however, that ratio is approaching almost double, at 0.28. That means that the region’s largest corridor is significantly more built-up than the urban area, even though it still has room for further development. Understanding differences in development across urban areas and between corridors within urban areas is crucial for delivering TOD effectively.

These trends in corridor development characteristics may make them perfectly suited to TOD. First, TOD often thrives as infill development in places with homes, offices, shops, and schools already nearby; that means higher floor-area ratios indicate prime opportunities. Second, it may be that large swaths of surface parking, paved roads, and driveways make corridors appear less developed.7 If that’s the case, it shouldn’t deter prospective TOD projects—many state-government-backed TOD projects focus on developing surface parking near transit. Research suggests the net effect of prioritizing these corridors could be delivering thousands of housing units and reshaping these spaces.
On top of all of that, people often live in these corridors: 59% are more densely populated than their urban area, or 67% when looking only at corridors longer than 1 mile. Across the 663 urban areas with more than 5 miles of corridors, 402 see more than half of corridor miles achieve higher population densities than their region. By contrast, almost no urban area (18 of 663) sees less than 10% of the urban area’s corridor miles overperform on population density. Urban areas in the Southeast and Midwest tend to overperform more dramatically than others.

Despite having many helpful built environment characteristics and a wealth of jobs and residents, these state corridors fall short on just one TOD precondition: They don’t have a variety of land uses. Scarce housing means less than 35% outperform on diversity of land use, using a metric called “land use entropy.”8 Even when looking only at corridors longer than 1 mile (where there’s greater opportunity for land use mix), just 44% of mileage in those corridors has more varied land use than the urban area.
This is a relatively consistent pattern across urban areas. Even so, some large urban areas have corridors with significantly more diverse land use, particularly in the Southeast: 91% of Chattanooga, Tenn.’s corridor mileage has greater diversity than the urban area, and the same is true for 83% corridor miles in the Atlanta and Knoxville, Tenn., urban areas.

Fortunately, the path to improving this key piece of TOD readiness may be TOD itself. Land use characteristics in these corridors are stark: Barely half of corridors longer than 1 mile have a greater share of their building area dedicated to multifamily housing than their regions. Conversely, 23% dedicate more building area to single-family housing than their region, raising questions as to whether these corridors are currently underutilized relative to their potential. Said plainly: These are job hubs, not residential hubs.
Finding #4: State-owned, transit-served corridors serve many of their regions’ biggest destinations, but transit use isn’t booming
State-owned corridors host some of the most popular destinations in nearly every urban area—people travel to the areas around these roads more than they do elsewhere in their region. Yet despite being defined by the transit service that exists nearby, people traveling to destinations in these corridors take transit at roughly the same rate as the urban area more broadly. In other words, transit service isn’t equating to extra transit use.
The popularity of these state-owned corridors is clear. Comparing trips per square mile ending in these corridors to trips ending in the wider region demonstrates just that. People travel to destinations within more than 25,500 miles of corridors (76% of the total) more often than the urban area around them. Those numbers rise significantly when the noise of small corridors is eliminated: In corridors longer than 1 mile, destinations along 14,070 corridor miles (86% of the total) receive more trips per square mile than their region.
This trend is on full display in the top 15 urban areas by population. In Chicago, for example, people make more trips per square mile to destinations in 887 of 1,106 corridor miles than the broader urban area. In Miami–Fort Lauderdale, Fla., the rate is even higher: Destinations near 616 of 715 corridors miles receive more trips per square mile than the urban area. For residents of small towns, it may come as no surprise that their state-owned Main Street is a popular destination. But the dominant popularity of so many of these corridors in each urban area means that entire state networks—from downtown Main Streets to suburban arterials—are attracting people.
What’s particularly striking is just how average the transit mode share for these areas is. Though each corridor has a transit stop within just a quarter-mile of every point along the road, only 53% of mileage in corridors at least 1 mile long experiences a higher transit mode share than all urban area trips.9 Pedestrian use is slightly higher, with trips that end in these corridors slightly more likely to be taken on foot. Though transit providers are spending money to serve these corridors, the return on that investment is lower than it should be. TOD may be able to help bridge this gap: One of its proven benefits is increasing transit ridership.
The phenomenon of middling transit ridership to these corridors varies across U.S. regions. The urban areas where state-owned corridors see less transit riders than the urban area average concentrate in the Northeast and other regions with more mature transit service, such as Chicago and Seattle. This may be a product of higher transit ridership, as transit users flow to neighborhoods with more established TOD. On the other hand, state corridors see higher transit ridership in the South and Southeast, as well as a handful of Midwestern states tracing a line north from Kentucky to Michigan through Ohio. These urban areas deserve their own careful, place-specific analysis to understand why transit use is relatively higher on state-owned corridors.

Finding #5: A disproportionate number of roadway deaths are on state-owned transit-served corridors
The need to rethink transit-served corridors is greater than just tapping development potential: These corridors are deadly. No matter how you parse it, a disproportionate number of roadway deaths occur near state-owned, transit-served corridors. That’s true in 565 of the 654 urban areas with at least one death and 5 miles of these corridors.

Of the 16,361 miles that make up corridors longer than 1 mile, corridors that make up 11,135 of those miles have a higher fatality rate than their urban area.10 That means 68% of these longer corridors, by their mileage, are more deadly than the average road in the region.
Examining individual urban areas brings the problem into sharp relief. In each place, asking whether a greater share of an urban area’s roadway deaths is in transit-served corridors than roads writ-large can reveal if there’s greater transit-adjacent danger. In New York City, for example, only 16% of roads are in a state-owned, transit-served corridor, but those corridors saw 27% of roadway deaths.
What’s astonishing is how consistently deadly the corridors are within the 50 most populous urban areas. The severity of the safety crisis is especially pronounced in the South and Southeastern U.S. Among the 20 areas with the most disproportionately deadly roads, Florida and Texas are each home to four, while Tennessee has two and Louisiana has one.

The lethality of state-owned roads, particularly in urban areas, is a known fact among transportation practitioners, and one that is getting more and more media attention. Why these roads are so deadly is often due to their design—a particular issue for state-owned roads, which may be designed to prioritize vehicle speeds over pedestrian safety. What this data make clear is that states aren’t doing nearly enough to protect system users along the corridors that should be most hospitable to pedestrians and other transit users.
Implications and recommendations
The conditions and performance of state-owned roads near transit are complicated. On one hand, many of these roads serve areas that are the economic hubs of their regions, packed with desirable destinations and rich with jobs, residents, and retail. These are places where development is already happening and where street grids are relatively tight.
But on the outcomes, many of those same state-owned corridors are falling short. They lack homes, have less diverse land use, and don’t see the transit ridership one would hope nearby service would produce. These areas are also deadlier to pedestrians and drivers alike, which is both a public health burden to the entire community and a potential barrier to attracting TOD in those places.
What these results can’t tell us is exactly why deaths are more common in these corridors and taking transit is not. This analysis does not include data on pedestrian infrastructure, lane and road widths, and other related roadway design and built environment topics. Transit frequency is similarly omitted. These variables, plus many others, can all help explain transit ridership and safety.
That means that it is incumbent on those who do have that information to act on it. State and local governments often have ready-made access to data on lane widths, speed limits, intersection designs, pedestrian infrastructure, signal timings, and transit headways. These officials and practitioners can test these built environment and transit characteristics against safety and mobility outcomes, and design their strategies from there.
They’ll likely find one of two possible outcomes. Some corridors may be relatively safe already, complete with the pedestrian infrastructure and built environments characteristics for TOD to thrive. Other corridors might have the characteristics found in this analysis—jobs, residents, development, and tight street grids—but also roads that are too wide, signals timed too long, or transit too infrequent to support TOD.
In the first case, state governments and their transportation departments should look to accelerate TOD. This analysis finds that the most ideal corridors still need homes and people. State governments can prioritize developing their own land along these corridors first; states that own the transit stops can pursue value capture strategies themselves, while the rest can support their transit agency partners in the same way.
In the second case, state DOTs need to urgently prioritize upgrading their roads. For the most motivated DOTs, significant redesigns should be on the table. They could retrofit their urban right-of-way to match local road designs and support surrounding development characteristics. Modest improvements such as sidewalk upgrades and signals don’t make headlines, but they can save lives and promote development.
Neither of those are easy undertakings. Taking full advantage of the opportunity that executing TOD on these corridors presents—a way to make life more affordable, balance government budgets, and make roads safer—will require a coordinated approach from every corner of state government.
Governors should set up state government to support TOD
Governors can lead the charge in advancing TOD. They can appoint leaders to the state DOT who will push for TOD near their own assets. They can issue executive orders directing state agencies to organize themselves to support TOD and kick off an inventory of state-owned land near these state-owned, transit-served corridors. They can flex federal funds to increase fiscal support for the transit systems around which TOD is anchored.
This executive approach should include establishing a TOD office meant to consolidate knowledge and programming within state government. The exact position within the state’s organizational structure is less important than creating a culture that recognizes TOD’s positive spillovers and takes a more holistic view of how state-owned corridors can promote economic prosperity.
Legislators should remove fiscal and regulatory barriers to TOD
State legislators should do what they can to improve the legal and financial feasibility of TOD. Legislators ought to consider reforming regulations that prevent real estate development, such as modifying or removing statewide parking minimums, legalizing accessory dwelling units, and possibly preempting restrictive local zoning ordinances. These reforms open the door to more varied development that can better support TOD. Legislators should also create a fund to fix old infrastructure and build new assets that will be necessary to support new housing. These upgrades can make new multifamily housing projects near state-owned roads pencil out for developers.
State DOTs should update their design standards
State DOTs should update their roadway design and access management manuals. Many states have adopted or regularly use the American Association of State Highway and Transportation Officials’ (AASHTO) Green Book, which improves on traditional highway design principles.11 AASHTO’s guide is not binding, however, and states should formalize design standards in administrative documents and department policy that recognize differences in land use, account for context around the roadway, and include the kind of pedestrian and active transportation infrastructure that makes TOD work. If state DOTs won’t update their design guidebooks, state legislators may want to consider legislation requiring that state-owned urban roads be built to the design standards of their city, including recognizing the National Association of City Transportation Officials’ (NACTO) Urban Street Design Guide.
State DOTs should upgrade infrastructure in targeted locations
With new fiscal policies and design standards in place, state DOTs can begin to upgrade transportation infrastructure in priority corridors. That includes roadway design elements such as improved sidewalks and crossings, but equally important is investing in transit-related improvements. Developers often worry that bus stations can be moved—taking the “T” out of TOD.12 State DOTs can borrow principles of bus rapid transit, even without committing fully to delivering such a system, and redesign curbs to allow for at-grade boarding, add bus priority signals, and even reallocate vehicle lanes to buses.
All stakeholders must thoughtfully consider whether to transfer corridor ownership
If state-owned roads are too deadly and continue attracting too few transit riders, practitioners and elected officials should consider jurisdictional route transfers from state to city or county (sometimes called “turnbacks”). Practices around turnbacks vary widely, but a few considerations are key. All stakeholders need to agree to the transfer.13 Localities need to consider whether they’re ready to take on ongoing maintenance costs, while states should pay to make sure the road is in good condition before it’s transferred. Agreements on all aspects of turnbacks should be transparent and set in writing, and state legislators in states that don’t have a formal process in law should consider replicating those that do.
States should act with urgency to encourage TOD along their urban, transit-served corridors
State DOTs are in a time of transition. Decades spent building new roads of all designs mean they are now far more than “highway departments.” State DOTs need to serve everyone in the state, and urban area residents in every single state are facing a multipronged crisis related to affordability, accessibility, and physical safety. State DOTs need different tools—and a different vision altogether—for their urban roads.
When those roads are near transit and meet key characteristics, state DOTs should be laser-focused on encouraging transit-oriented development. When roads don’t meet those requirements, it’s the job of state DOTs to make their assets safer and better for users of all modes.
Making this shift will take work. Legislators and governors will have to set a clear vision for their state and install leaders who can execute it. Then, it’ll be on state DOT staff to deliver the specific, place-focused reforms that can help build more affordable and safer communities.
Authors


Downloads
-
Acknowledgements and disclosures
The authors thank Michael Gaynor for editing, Nick Mourtoupalas for web design, Alec Freidhoff for interactive design, and the rest of the Brookings Metro communications team for their support. The authors personally thank Jyot Chadha, Yonah Freemark, Ben Holland, Justyn Huckleberry, John Renne, Corrigan Salerno, and Reed Schwartz for feedback during the research stage of this project and invaluable comments on early drafts of this report. They especially thank Tracy Loh for her feedback on drafts of this report. The authors are solely responsible for all remaining errors and omissions.
The Brookings Institution would like to thank Arnold Ventures and TransitCenter for their generous support of this research. The views expressed in this report are solely those of its authors and do not represent the views of the Brookings Institution and its donors, their officers, or employees.
-
Footnotes
- This share is likely an underestimate, as Highway Statistics data include bridges, tunnels, and non-interstate limited-access roadways that our analysis excludes.
- We include all transit modes, including buses.
- Future research using novel methodologies to derive such information about road widths could add interesting details to this analysis.
- That includes Washington, D.C., where roads owned by city government are treated as state roads in federal data.
- Only counts those urban areas with at least 5 miles of transit-served state-owned corridors.
- This includes major urban areas in Arkansas, Alabama, Florida, Georgia, Louisiana, Mississippi, North Carolina, South Carolina, and Tennessee.
- The analysis shows that 32% of corridors longer than 1 mile, by mileage, have less than 10% of their area covered by buildings; 61% have between 10% and 20% covered.
- Decades of research has found a clear link between land use mix and how ready a place is for TOD.
- These shares exclude urban areas for which Replica does not model transit trips.
- Fatality rate takes the five-year sum of roadway fatalities in a geography, from 2020 through 2024, and normalizes by how many miles of roads there are. That’s done for corridors and urban areas.
- See forthcoming Brookings research.
- Source: Brookings’ expert interviews.
- It’s worth being explicit about this, as a University of Kentucky study found that only 4 of 11 states studied required local consent before a route was transferred.
The Brookings Institution is committed to quality, independence, and impact.
We are supported by a diverse array of funders. In line with our values and policies, each Brookings publication represents the sole views of its author(s).